Ant communities are well suited for monitoring ecosystems because the distribution patterns of individual species are relatively stable (Alonso and Agosti 2000). In addition, the stability, sedentary nature, and sensitivity to environmental perturbation also make ant communities suitable for assessing the general state of an environment (Alonso and Agosti 2000, Yamaguchi 2005, Ribas et al. 2012). Consequently, numerous studies have examined ant responses to a variety of environmental disturbances (Human and Gordon 1996, Thompson and Mclachlan 2007, Menke et al. 2011).
Most of the studies conducted to date on ants in urban environments have concentrated on the negative effect of the urbanization on ant biodiversity (Holway and Suarez 2006, Sanford et al. 2009) or the relationship between invasive and native species (Miyake et al. 2002, Touyama et al. 2003, Sunamura et al. 2007). However, given the difficulties associated with conducting long-term observations in urban environments, the amount of ecological data collected in urban environments is typically limited (Buczkowski and Richmond 2012). Consequently, most of the studies on ants in urban environments have been performed at a single point in time along a gradient of urbanization (e.g., urban vs. rural areas, urban periphery vs. inner city, and urban green spaces vs. residential areas), or surveys have been conducted in several sites that have similar environmental condition (Yamaguchi 2004, 2005, Stringer et al. 2009). While these approaches have allowed us to simplify the complicated effects of urbanization (Antonova 2005) and increased our understanding of the impact of invasive species on native communities (Touyama et al. 2003, Stringer et al. 2009), these approaches also have shown several associated problems. To date, numerous studies have been undertaken at different sites for better understanding of the effect of urbanization on ant diversity in urban. However, it is difficult to assess the effect of urbanization on ant diversity in urban environments in isolation because different sites have subtle differences as microhabitat characteristics (Buczkowski and Richmond 2012). According to Porter and Savignano (1990), invasion of the fire ant
In order to better understand the ecology of urban environments, we examined changes in the community structure of ants in urban parks over a decade. We also clarified the impacts of invasion by the Argentine ant
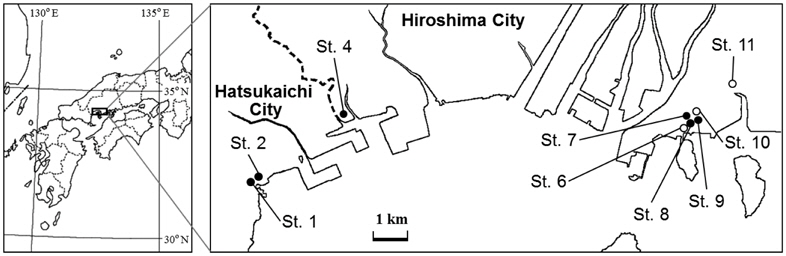
We resampled the nine urban parks among 12 urban parks (Touyama et al. 2003) in Hatsukaichi and neighboring Hiroshima (Fig. 1) to compare changes in ant assemblages over time because the three urban parks have been changed and trimmed for the construction of high-way road and apartment.
All of the urban parks surveyed were small (less than 0.5 ha) with a centrally situated playground consisting of bare soil, playing equipment, and occasionally wisteria trellises. Organic matter in the topmost soil layer (e.g., leaf litter and humus) was limited to areas under shrubs, as fallen leaves and weeds were usually removed during routine park maintenance. The environmental conditions in the surveyed parks were thus considered to be very stable over time.
Ants were collected using the same time-unit sampling method as that employed in 1999. The method consisted in collecting as many species as possible within a specified time period (10 min, repeated 10 times at each park in this study) by conducting visual and manual searches for ants on the ground surface, under stones and bark, and around the bases of trees (Touyama 2000, Ogata 2001). Ant specimens were then sorted and identified to species by using taxonomic keys provided by the Japanese Ant Database Group (2003).
Using the frequency data for each species, we performed a non-metric multidimensional scaling (NMDS) analysis to examine the similarities between all parks over time. This ordination technique represents samples as points in a two-dimensional space, such that the relative distances of all points are in the same rank order as the relative similarities of the samples (Van der Gucht et al. 2005). We used the Bray-Curtis index as a similarity measure for different parks. The Bray-Curtis index is considered to be well suited for multivariate statistics because it is less affected by the numbers of rare species in the samples (Krebs 1989). The NMDS goodness of fit was estimated using a stress function which ranged from 0 to 1, with values approaching zero indicating a good fit. An analysis of similarity (two-way crossed ANOSIM) with 999 permutations was used to test for significant differences between groups. In addition, the similarity percentage tests (SIMPER) were conducted to identify which species contributed the most to the average measure of dissimilarity between groups (Clarke 1993). All analyses were performed using Primer ver. 5 (Clarke and Gorley 2001).
Finally, to assess temporal species turnover, we computed Jaccard’s index (JI) from the presence-absence data in the ant data matrix; JI =
>
Changes in the number of ant species over time
Table 1 shows a list of the species identified in each park together with their abundance. A total of 25 species are shown; 23 species were recorded in the 1999 survey, and 20 species were recorded in the present survey. The differences between the two datasets are due to the inclusion of two previously unobserved species,
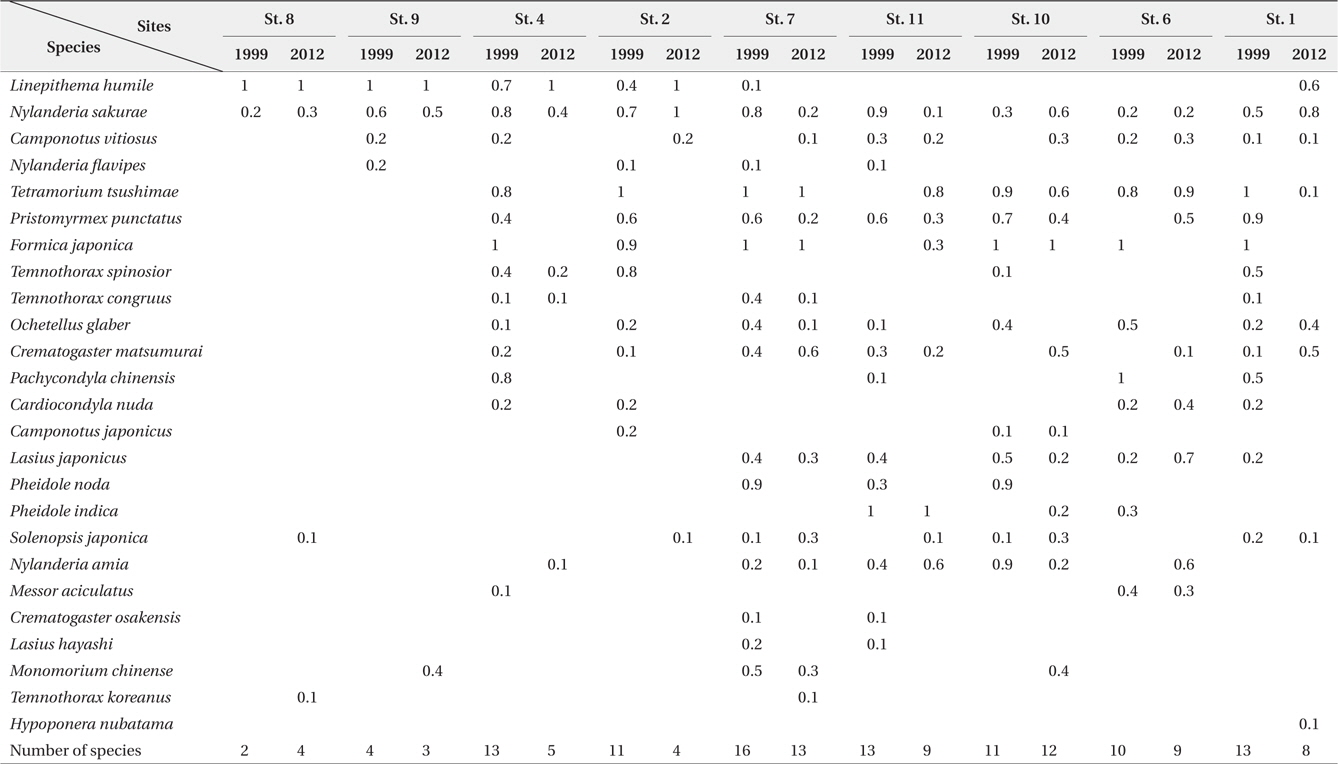
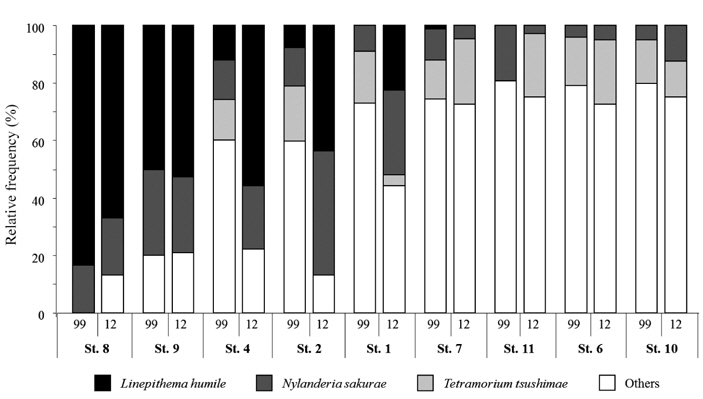
Relative frequency (0 to 1, n = 10) of ant species in the urban parks surveyed by time-unit sampling* in 1999 and 2012
The number of ant species exhibited several different inclinations among the examined parks. First, in parks where
>
Changes in occurrence patterns of each ant species over time
Fig. 2 shows the relative frequency of three ant species that were common to all of the parks surveyed in both 1999 and 2012. Interestingly,
Spearman’s rank correlation coefficient analysis revealed a significantly negative correlation between the incidence of
>
Changes in ant community composition over time
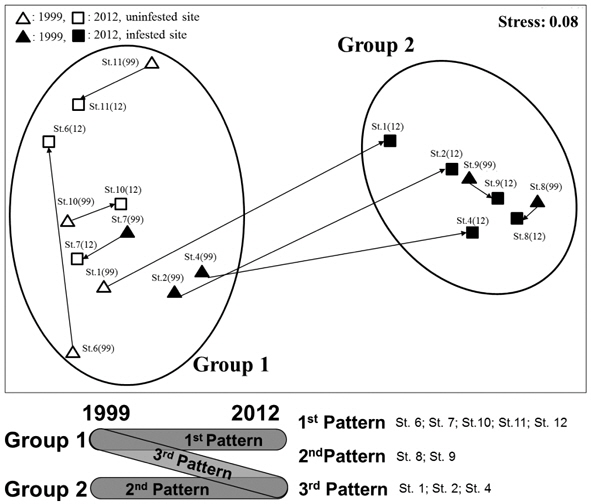
The NMDS analysis separated ant communities into two groups (Fig. 3); stress was low (0.08), indicating a good degree of fit. A two-way crossed ANOSIM showed that the species composition of the ant communities at the sites did not change over time (
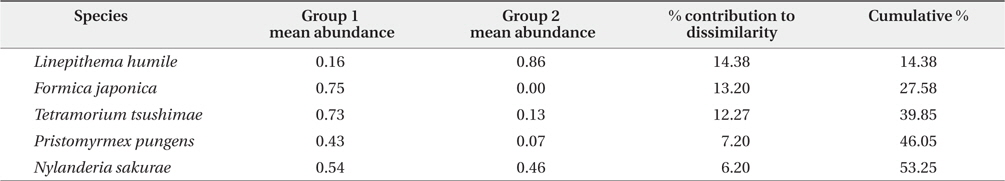
Additionally, SIMPER analysis revealed that five species were the main contributors to the differences between two groups (overall dissimilarity = 77.38%, see Fig. 3). The representative species of group 1 were

Results of the similarity percentage (SIMPER) analysis for five ant species representing more than 50% of the cumulative contribution to average dissimilarity between two groups
In addition, we identified three general patterns of change in ant community structure between groups 1 and 2 in response to changes in
In this study, we clarified the effect of urbanization and invasion by
First, the number of ant species decreased significantly after an invasion or increase in
Second, both urbanization and high numbers of
Third, NMDS analysis showed that the ant communities of the surveyed parks could be divided into two groups, and that the compositions of the ant communities in each of these groups were significantly different. Three patterns of change in ant community structure were identified in both groups; only the third pattern exhibited a shift from group 1 to group 2. This shift was caused by an increase in
In conclusion, because most urban parks are maintained regularly for the benefit of visitors and are located in developed areas, these habitats are considered to be very difficult for ant species to invade. However, in the event that colonization by an invasive species does occur, the impact on any existing indigenous ant assemblages is expected to be negative. The findings of this study demonstrated that invasion by