Wetlands dominated by emergent macrophytes are among the most productive ecosystems (Wetzel and Howe 1999, Gessner 2000). The emergent macrophytes serve as nutrient sink by fixing nutrients on plant during the growth period, whereas the dead biomasses do as nutrient source by releasing nutrients on surrounding during the decomposition period (Carpenter 1980). The nutrients released into the environment are reabsorbed by other organisms such as microorganisms and plants, indicating that the decomposition of plant litter regulates the nutrient cycle (Hobbie and Vitousek 2000).
The decomposition of plant litter in wetlands can be affected by the various environmental conditions. The environmental variables such as water temperature and oxygen level affect directly the microbial activity, and the litter qualities such as C:N ratio, initial nutrient levels, and lignin content also have a significant influence on the availability of decomposed materials (Swift et al. 1979, Aber and Melillo 1980, Hodson et al. 1984, Kim 2001). In addition, the increase of nutrient availability including the increased concentration of dissolved nitrogen or phosphate can correlate positively with litter decay (Suberkropp and Chauvet 1995, Rosemond et al. 2002, Kim 2005).
Among the factors that affect litter decomposition, the water flow regimes can be a key driver in wetland ecosystem (Molles et al. 1995, Glazebrook and Robertson 1999, Andersen et al. 2003). The water flow regimes can affect nutrient circulation by determining the physical and chemical characteristics of wetland (Robertson et al. 2001, Tockner et al. 2000, Heffernan and Sponseller 2004). Hydrological factors that can cause the change of nutrient cycle include frequency, timing and duration of flooding, and water turn-over time.
Langhans and Tockner (2006) reported that the duration of inundation was the crucial variable of decay rather than the frequency. Study in experimental microcosms has shown that dry litter decomposed slower than flooded litter but decay rate of litter subjected to different duration of inundation were similar (Day 1983). The field study by Neckles and Neill (1994) showed similar result to the study in microcosms. Floodplain inundation changes riparian vegetation and species diversity (Tiegs et al. 2005). The change can affect leaf litter quality and quantity which affect further litter decomposition (Kim and Kim 2009).
In particular, water turnover time in wetlands is one of important determinants of the chemical characteristics and, thus closely associated with the retention and circulation of nutrients in wetland ecosystems. However, most of previous studies on how the hydrology affects nutrient cycling have focused on frequency and duration of inundation, and there is a paucity of study with the effects of water turnover time on the decomposition of macrophytes and nutrient cycling (Day 1983, Shim et al. 1992, Neckles and Neill 1994, Langhans and Tockner 2006).
Therefore, the present study aims to investigate how the difference of turnover time affects the decomposition of emergent macrophytes and nutrient dynamics between the litter and surroundings in artificial condition. Based on the results, the further purpose is to suggest ways of managing the hydrological regimes in order to promote nutrient retention in wetland ecosystems.
>
Microcosm experiment: preparation for leaching experiment
The plant species used for being provided as litter, wild rice
Only the leaf blades were prepared for the litter. The leaf blades were cut into 10 cm size and air-dried at 60°C for more than 72 hours. The litterbag was 20 × 20 cm nylon bag with 1 mm mesh. Each litterbag enclosed about 7 g of litter. Four litterbags were placed into each pot microcosm (27 × 20 × 8 cm) with 3 L of distilled water and submerged under water which is the default state, because wetland ecosystem was based on the experiment. A total of 68 bags were prepared, 4 bags were used for determining initial conditions and 64 bags were used for four treatments. Four treatments representing different water turnover time, exchange of water every 1 (treatment A), 2 (treatment B), and 4 (treatment C) weeks and non-exchange of water (treatment D) until 8th week, were applied with 4 replicates for each treatment. The microcosms were transferred into growth chambers with no light for limiting the growth of green algae and the temperature of 35°C for enhancing microbial activities (O’Connell 1990, Kirschbaum 1995). All the microcosms were remained in aerobic conditions.
>
Litterbag retrieval and chemical analysis
The 4 litterbags from each treatment were retrieved every 2 weeks after the litterbag installation until 8th week (Table 1). The water for the nutrient analysis was simultaneously sampled with the litterbags.
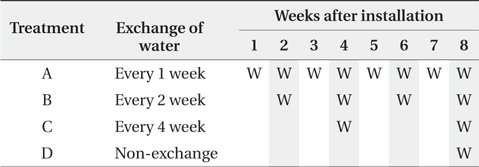
Water turnover time and litterbag retrieval of the experimental microcosms. ‘W’ in cells indicates the exchange of water and shaded cells indicate timing of litterbag retrieval
The plant leaves in the sampled litterbags were weighed after drying at 60°C for more than 72 hours. Each dried sample was ground in a planetary ball mill (Pulverisette 23; Fritsch, Idar-Oberstein, Germany) and was sieved through 0.42 mm mesh of the US Standard No. 40 sieve.
The organic matter content was determined by measuring weight loss on ignition at 450°C for 4 hours in a muffle furnace (Dean 1974, Boyle 2004). To determine the concentrations of K, Ca, and Mg, 0.3 g of each sample powder was mixed with 5 mL of nitric acid and 1 mL of peroxide and acid-digested with a MARS Xpress microwave (CEM, Matthews, NC, USA). An atomic absorption spectrophotometer (AA240FS; Varian, Palo Alto, CA, USA) was used to quantify the K, Ca, and Mg in these digested solutions.
The remaining weight of the litter was expressed as a percentage of the initial sample weight. Decomposition rate,
where
Sampled water was filtered through glass fiber filters to remove particulate organic matter. We analyzed content of available N (NO3-N, NH4-N), available P (PO4-P), and cation such as K, Ca, and Mg in the water. NO3-N, NH4-N, and PO4-P were analyzed by the hydrazine method, indophenol method, and ascorbic acid method, respectively (Kim et al. 2004). The contents of K, Ca, and Mg were measured by using an atomic absorption spectrophotometer (AA240FS; Varian).
SPSS ver. 20.0 software (SPSS, Inc., Chicago, IL, USA) was used for a one-way analysis of variance (ANOVA) and Scheffe’s post hoc test at a 5% significance level for analyses.
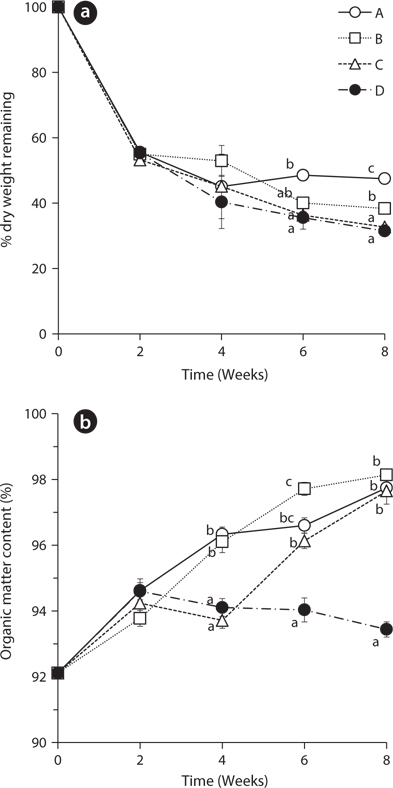
The dry weights of
The percentage of organic matter content increased in all treatments from 92.11 ± 0.28 to the range of 93.78 ± 0.24 to 94.62 ± 0.36 during the first 2 weeks (Fig. 1b). This result indicates that leaching of the inorganic matter is likely much faster than decay of the organic matter in the beginning of the experiment (Kim and Chang 1989). During the next two weeks, the organic matter content increased in treatments A and B with the exchange of water at 2nd week but decreased in the treatment C and D without water exchange at that time. These results showed the statistically significant difference at 4th week. Also, after 2nd week, the treatment D with no water exchange showed a gradually decreasing trend of organic matter content. This result suggests that non-exchange treatment had more rapid decay of organic matters than other treatments. The slow decay of leaves in the treatments with water exchange may be due to the removal of micro-organisms and dissolved nutrients which were involved in decomposition of organic matter (Howard and Howard 1974).
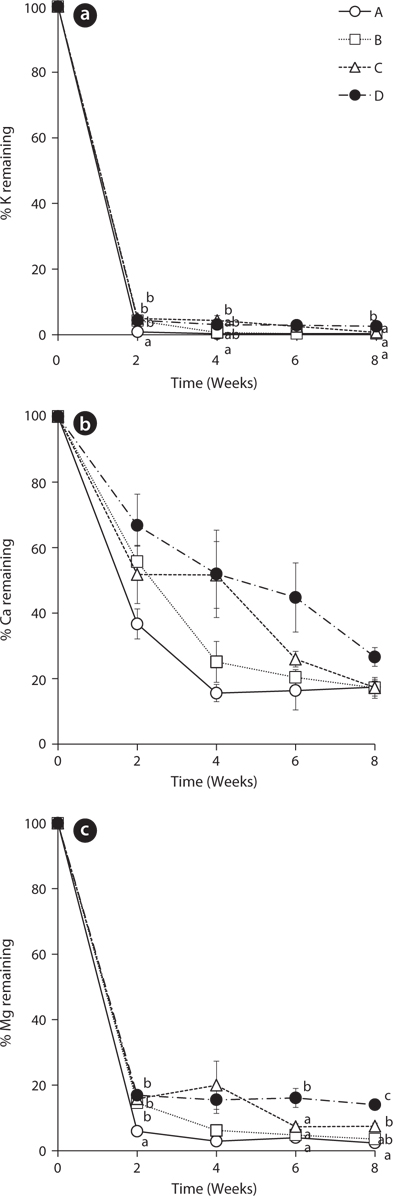
The leached rates of major cations in the leaves of
The remaining percentage of Ca decreased more steadily than that of K during the experiment period (Fig. 2b). However, the remaining percentage of Ca at the 8th week was higher than that of K. After 8 weeks, the percentages of Ca in the treatment A, B, C, and D were 17.42 ± 1.86, 17.19 ± 3.20, 17.25 ± 2.54, and 26.61 ± 2.86, respectively. These results support that K is known more labile nutrient and Ca is known more tightly held by some species (Davis and van der Valk 1978, Mun et al. 2001).
The change of remaining percentage of Mg showed a similar tendency with K (Fig. 2c). Mg in all treatments decreased sharply in 2 weeks and thus, most of Mg in
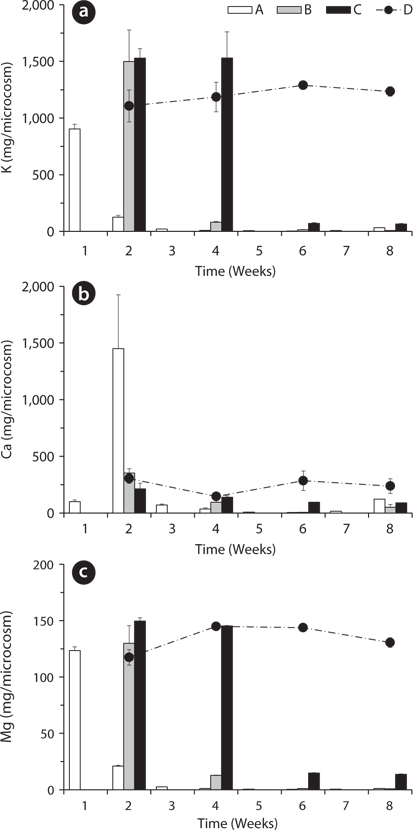
Total amount of nutrients including NH4-N, NO3-N, PO4-P, K, Ca, and Mg in the water of the microcosms was estimated to determine the leached amount from the litter to the surrounding water (Figs. 3-5). Treatment A was shown at an interval of one week because of the weekly sampling during the water exchange, while the results for the other treatments were shown every two weeks.
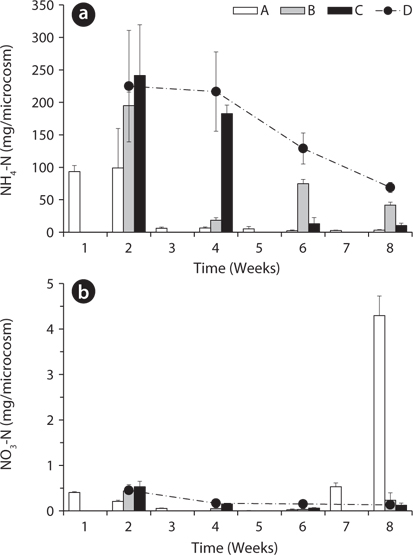
The NH4-N content in water was highest in the 2nd week in all treatments except B (Fig. 3a). After the water exchange at the 4th week, it was still high in the treatment B. The treatment C and D showed a decreasing trend of NH4-N content even during the period without water exchange. This might be due to the volatilization of NH4-N to NH3 gas at the water surface (Kirchmann and Witter 1989) or oxidation to NO3-N. NO3-N content in water also was highest in the 2nd week in all treatments but less than 1 mg/box (Fig. 3b). These results indicate that most of nitrogen in the litter was leached out as the form of NH4-N rather than NO3-N. After the 6th week, NO3-N content in water sharply increased to 4.30 ± 0.43 mg/box in the treatment A. This might be due to the transform of NH4-N to NO3-N, which can be often triggered by the addition of dissolved oxygen in the exchanged water (Kirchmann and Witter 1989).
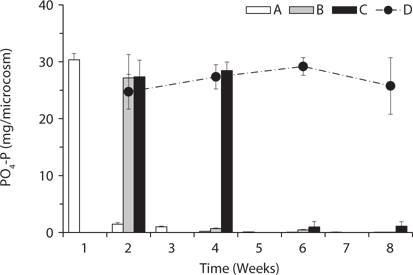
PO4-P content in water showed relatively steady pattern in all treatments compared with available nitrogen (Fig. 4). PO4-P content in the treatment D ranged from 24.73 ± 3.05 to 29.17 ± 1.57 mg/box during the experimental period, while the treatment A showed 30.36 ± 1.10 mg/ box during the first 1 week. These results suggest that the most PO4-P from the litter was maintained in the microcosm system unless the water containing PO4-P would be exchanged out.
Based on the change of available nitrogen and phos-dephorus in water during the experimental period, the water turnover time can provide an additional clue to the difference of the decay rates among the treatments in Fig. 1a. As the water turnover time is getting longer, the amount of available nitrogen and phosphorus are maintained higher and this can lead to the increase of microbial activity (Suberkropp and Chauvet 1995, Rosemond et al. 2002).
The changing tendency of major cation contents in water except Ca at the 2nd week in the treatment A was similar to that of PO4-P content in water (Fig. 5). These results indicate that a large amount of cations could be leached from the litter at the early period and remain in the water as measurable ion-forms in the treatment with the slow exchange of the water because of less outflow and transform of the cations. In particular, K showed relatively very high content during the first 2 weeks and this result supports the fast decrease of K in the litter (Fig. 2a) and K has high leached rate at the beginning of the litter decay.
The present study showed that the litter decomposition is decreasing with the shorter turnover time of water in the closed system. In addition, most of the nutrients in the litter were leached to water during the first 2 weeks and the leached nutrients were removed from the microcosm by the water exchange representing the turnover time of water in the field. The microcosm without the turnover of water has a consistent influx of nutrients, and the increased nitrogen and phosphorus and no outflow of the nutrients can cause the eutrophication problem. Therefore, our study suggests that artificial wetlands with very slow water turnover time may have higher potential of eutrophication and the fast water turnover time has to be applied in order to decrease the decay rate of litters and to remove the accumulative nutrients for preventing the eutrophication of water.