The fusion of clothing fashion and digital technology has been driving innovation in the overall environment of the clothing industry, many of whose current works that used to be done manually in the manufacturing process have become automated with the computer since the introduction of CAD/CAM systems. The use of CAD for apparel related to textile design and pattern works has been successfully integrated. Those technologies have recently led to the commercialization of 3D scanners, 3D reconstruction technology, and 3D virtual try-on simulations. As those technologies are incorporated into web-based application and IT technologies, the fashion industry is moving toward full scale digitalization. In particular, more attention has recently been paid to technologies which integrate digital content with the fashion industry and their possibilities along with the spread of smartphones. In correspondence with industry trends, the virtual actuality technology has been incorporated into fashion, which has resulted in the introduction of virtual try-on simulation technology in the stages of product planning and sales in the fashion industry.
Virtual try-on simulations are based on 3D human body scanning and computer graphics technology as a technique to transform 2D clothing patterns into 3D clothing patterns (Kim et al., 2011). They have such advantages as saving a considerable amount of time and effort when used as an alternative tool to provide information about clothing products in an online clothing shopping mall environment where consumers cannot see, feel, or experience products first-hand. They also facilitate in the manufacturing of samples in the planning stage of clothing products. Reflecting those advantages, some online shopping malls have introduced 3D virtual try-on simulations. One good example is Land’s End (www.landsend.com), an American online clothing company, which introduced “My Virtual Model” a few years ago to provide virtual try-on simulations using a virtual model close to the figures of customers. Similarly, i-Fashion Mall (www.ifashionmall.co.kr), a South Korean online clothing retailer, incorporated the virtual try-on simulation technology to offer a virtual try-on feature for its products. Although the utilization of virtual try-on simulation has been increasing from the early trial stage to the present day, its application to clothing products and items of various designs has not been smooth.
Choi and Nam(2009) took a survey and reported that the virtual try-on technology had some disadvantages including “limitations with the expression of materials” (10.94%), pointing out that the technology made it difficult to estimate what it would be like to actually put on a product due to the shortage of expressions on the feel and thickness of materials and that it had some room for improvement in expressing behavior according to elasticity and drapability when putting a product one. With fashion moving towards state-of-the-art advancement, it is essential to take advantage of apparel science and 3D shape information technologies and integrate engineering technologies to express them so that the 3D virtual try-on simulation technology will establish itself as a revolutionary tool in the clothing industry.
Previous studies(Do, 2008; Kim, 2007; Sung & Ha, 2006) on apparel science related to virtual try-on simulations covered both the application of 3D virtual try-on systems to patterns and the principles as well as application methods of the system(Choi et al., 2003; Kim & Gotoh, 2005; Kim, 2007; Lee et al., 2000). Some studies(Koo & Suh, 2009; Lee et al., 2007; Park, 2007) compared the results of virtual try-on simulations to actual try-on results and tested their accuracy. Those studies made various attempt at diverse approaches to the methods and expressive techniques of effective clothing simulation and offered basic data on resulting appearances, silhouettes, and visual images of the clothes. Those results will form a database for engineering technologies to express actual clothes three dimensionally in virtual space. Those previous studies, however, usually used a limited material definition which could not provide directionality to resolve the limitations of virtual try-on simulation with material expression.
In virtual try-on simulations, it is extremely important to express the exterior shape of clothing close to its actuality. Such material expressions depend on adequate computer modeling of the physical properties of the materials. Textile materials droop down and produce nodes, being influenced by bending, cutting characteristics, and weight, which is called drapability. In fact, drapability is one of the critical elements to determine the shapes of clothes. The drapability of textile materials is a type of buckling phenomenon and is closely related to their physical factors, which means that it is extremely important to convey visual images accurately by capturing the physical characteristics of textile materials and expressing their drapability well. In other words, it is necessary to visually express differences between the exterior shapes of clothes formed by differences in drapability.
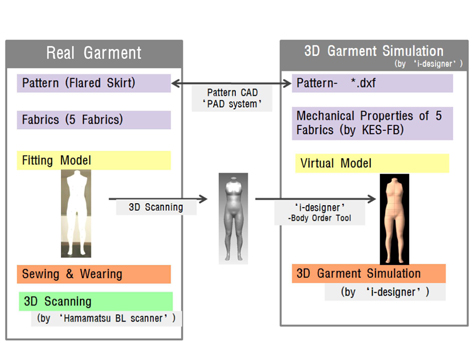
The purposes of this study were thus to analyze the exterior clothing shapes and visual images from 3D virtual try-on simulations with materials whose drapability was differentiated and then test the accuracy of the expression of the drapability of the materials. For those purposes, the study carried out 3D virtual try-on simulations by selecting flared skirts as an item to best express differences in drapability along with five materials of different physical properties and offered some basic data for greater utilization of virtual try-on simulations by comparing and analyzing them with the exterior shapes and visual images of actual flared skirts. The research proceeded as follows and Fig. 1 illustrates the research model:
1) The study analyzed the drapability of five different materials.A. The study measured the drape coefficient, number of nodes in drapes, mean node height, and mean distance between nodes to analyze the drapability of five different materials. 2) The study also analyzed the shapes and visual images of the flared skirts by applying the physical properties of each material.A. The study measured the right and left breadth of hemline, number of nodes, node height, and distance between nodes and compared the results of virtual try-on models with those of actual ones to analyze the shapes of the flared skirts.B. The study took measurements with the semantic differential scale by using visual image adjectives and compared the results of virtual try-on with those of actual try-on to analyze the visual images of the flared skirts. 3) The study further analyzed correlations between the drape coefficient of materials and the exterior shapes and visual images of the flared skirts and compared the results of virtual try-on with those of actual try-on.
The investigator selected textiles of five different materials to make flared skirts in actuality and in virtual simulation. They include cotton, linen, silk, wool, and polyester most used to make flared skirts. They were all white. Table 1 shows the measurements of their physical properties with KES-FB. The investigator made actual flared skirts with the five textiles and used the measurements of Table 1 as the physical properties to be entered for the 3D virtual clothes simulations.
[Table 1.] Physical properties of 5 types of fabrics

Physical properties of 5 types of fabrics
2.2. Measurement of material drapability
The drapability of five textiles was measured according to KS K ISO 9073-9. There are two ways to measure drapability: one is to use paper weight for drape shapes, and the other is to use an image entry device. The present study employed the latter for an experiment, which also involved the Cusick drape measurer and 2D images of drape shape shadows shot by a camera to analyze drapability. The 2D images present the phenomenon of textile materials drooping down on the mount, being used to measure drape coefficient, number of nodes in drape shapes, mean node height, and mean distance between nodes. Prototypes that were 30 cm in diameter were randomly sampled for five textiles according to KS M ISO 186. The mount of the drape measurer was 18 cm in diameter. Fig. 2 shows the drape coefficient and expression.
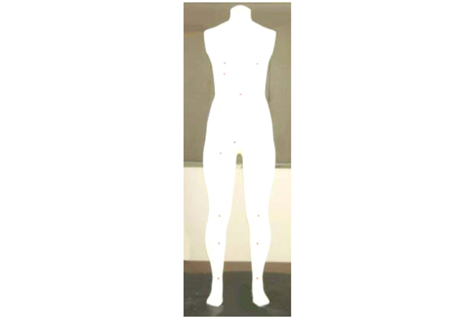
The investigator made an actual flared skirt with each of the five textiles. The measurements for patterns were based on the whole body (Fig. 3) made as the standard figure of Korean women in their twenties. Table 2 presents the measurements by the items. Patterns were made with the pattern CAD software called ‘Pad System 4.1.’ As seen in Fig. 4, the patterns of flared skirts were made to ensure that the entire skirt width was 180°. The position of the waist circumference of the flared skirts was the same as that of the body. A belt of 3 cm in width was attached to the waist circumference. Skirt length was set in a way that the hemline would come at the knee circumference of the body. Cutting was done to make the front and back central line the positive bias of a textile material, reflecting the results of a previous study (Koo & Suh, 2009) which reported that drape shapes were better expressed when they were cut in a way that the front and back central line of a flared skirt would be a positive bias.
[Table 2.] Body device size for Korean women in their 20s

Body device size for Korean women in their 20s
There was a 1 cm seam allowance in the side line and waist circumference. The hemline was cut along the completion line with no margin to seam in order to minimize the effects of margin to seam. A margin to seam on the side line was processed with seaming. There was a 15 cm slit on the left side line. Sewing was done with industrial Needle No. 11 sewing thread of polyester 60’s/3 at four stitches per centimeter with back stitching in 1 cm at both the beginning and end.
The 3D simulation software i-Designer was used to make five virtual flared skirts with the same try-on body, pattern and material as the actual ones. i-Designer is a 3D virtual try-on system developed by Technoa of Japan and has a range of features including the creation of a virtual body model, pattern making and revision, and creation of virtual try-on coordination and accessory needed for virtual try-on simulations.
Using the “Body Order Tool” of i-Designer, the investigator built a virtual body model that was the same as a whole body based on the standard figure of Korean women in their twenties Fig. 3. The whole body with legs and feet was scanned by using Hamamatsu BL(Japan) 3D scanner. The file format of the scanned data was “.dxf”. Virtual flared skirt simulations were performed with the resulting virtual body model and the flared skirt patterns made with ‘Pad System 4.1.’(Fig. 5). The physical properties of the five materials measured with KES-FB were entered in the physical properties entry box in i-Designer. Given the characteristics of i-Designer, the simulation must be conducted several times in order to converge on a shape that is the closest to actuality. The present study set the number at 12 based on previous studies (Koo & Suh, 2009; Park, 2007).
2.4. Analysis of flared skirts in shapes
The shape analysis parameters of flared skirts were the number of nodes, height of nodes, and distance between nodes in the hemline as seen in Fig. 6. The five actual try-on shapes for measurement used scanned 3D data, whereas the five virtual try-on shapes used the 3D data exported from i-Designer. The 3D reverse design software ‘RapidForm2006’ was used for analysis.
2.5. Analysis of flared skirts in visual images
The visual images of flared skirts were measured with the semantic differential scale comprised of a set of adjectives to express drapability. The front, back, and side images of ten skirt shapes were printed and used as stimulants. 20 South Korean women in their twenties or thirties who were majoring in apparel science were asked to evaluate images on a questionnaire, which consisted of items based on adjectives to express drapability. Consulting a previous study (Kim et al., 2011), the investigator used five adjectives, which include “wound,” “drapable,” “soft,” “stiff” and “fluffy,” on a 7-point scale.
Data were analyzed with the SPSS statistical program(Ver. 12.0). The research findings were analyzed with descriptive statistics, correlation analysis, and t-test.
3.1. Analysis of material drapability
Table 3 presents the measurements of drape coefficient, number of nodes, and average height of nodes by analyzing the drapability of five materials. Silk had the highest drape coefficient, being followed by linen, cotton, wool, and polyester in the order. Higher drape coefficient means greater stiffness, whereas lower drape coefficient means greater softness. Silk of the highest drape coefficient was the stiffest of the five materials, whereas polyester of the lowest drape coefficient was the softest and most drapable. Polyester had the most nodes at ten; wool had eight; and cotton, linen, and silk all each had seven. The higher the drape coefficient was and the softer the textile was, the more nodes were created. Silk had the highest mean node height, and polyester had the lowest mean node height. The drape coefficient is, the more nodes are created, in which case the textile is very drapable and droops down, which results in low node height. The higher the drape coefficient is, the fewer nodes are created, in which case the textile is stiff and does not droop down much, which results in higher node height.
[Table 3.] Results for drapability for 5 types of fabrics

Results for drapability for 5 types of fabrics
3.2. Shape analysis of actual and virtual try-on according to the types of materials
Fig. 7 presents the shapes of five actual try-ons scanned in 3D and the hemline shapes of five virtual try-ons exported from i-Designer. As for the forms of the hemline, four shapes were similar or slightly different in number of nodes and distance between nodes with the exception of silk, which turned out to have a lowest thickness level, be the lightest, and be the stiffest with the highest drape coefficient. There were huge differences in the hemline forms of silk between actual and virtual try-ons. Table 4 presents the measurements of right and left width, number of hemline nodes, mean distance between nodes, and mean node height by the materials between actual and virtual try-ons.
[Table 4.] Results for shape analyses for actual and virtual simulations
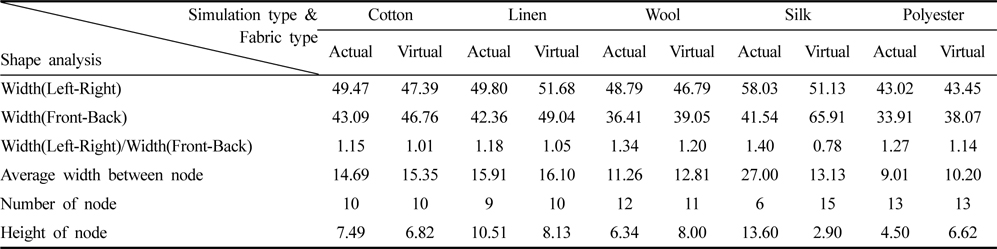
Results for shape analyses for actual and virtual simulations
As for the number of nodes in flared skirts, cotton and polyester were the same between actual and virtual try-ons at 10 and 13, respectively; linen had nine nodes in actual try-ons and ten in virtual try-ons; wool had 12 nodes in actual try-ons and 11 in virtual try-ons; and silk had six nodes in actual try-ons and 15 in virtual try-ons showing a significant discrepancy. While the six nodes had a clear and big form in actual try-ons, the 15 nodes had a small and muted form.
As for right and left width of skirt, polyester was the most similar between actual and virtual try-ons with a difference of 0.43 cm, being followed by linen with 1.88 cm, wool with 2 cm, and cotton with 2.08 cm in that order. The right and left width of silk was 58.01 cm in actual try-ons and 51.13 cm in virtual try-ons with the latter being smaller by 6.9 cm. Silk thus showed the biggest difference in right and left width of the five textiles. As for front and back width, wool was the most similar with a difference of 2.64 cm between actual and virtual try-ons, being followed by cotton with 3.67 cm, polyester with 4.16 cm, and linen with 6.68 cm in that order. The front and back width of silk was 41.54 cm in actual try-ons and 65.91 cm in virtual try-ons with the latter smaller by 24.37 cm. Silk thus showed the biggest difference in front and back width of the five textiles.
All five textiles had a bigger right and left width ratio against front and back width in actual try-ons than virtual try-ons. When the ratio was closer to 1, it meant it was closer to the prototype. When the ratio was bigger than 1, the skirt was bigger in the right and left direction. When the ratio was smaller than 1, the skirt was bigger in the front and back direction. Silk was the highest at 1.40 in actual try-ons, being followed by wool (1.34), polyester (1.27), linen (1.18) and cotton (1.15) in that order. Wool was the highest at 1.20 in virtual try-ons, being followed by polyester (1.14), linen (1.05), cotton (0.01), and silk (0.78) in that order. In most cases, they were higher than 1 and accordingly bigger in the right and left direction with the exception of silk which was 0.78 in virtual try-ons and bigger in the front and back direction.
All of the five textiles had bigger mean distances between nodes in virtual try-ons than actual try-ons except for silk which had no differences between them. The measurement difference between actual and virtual try-ons was 0.19 cm for linen, which was followed by cotton (0.66 cm), polyester (1.19 cm), and wool (1.55 cm) in the order of greatest difference in virtual try-ons. However, silk displayed a very big difference in the mean distance between nodes between actual and virtual try-ons at 13.87 cm, which is attributed to its big differences in number of nodes, right and left width, and front and back width between actual and virtual try-ons.
As for node height, cotton, linen and silk had smaller node height in virtual try-ons than actual try-ons, whereas wool and polyester had bigger node height in virtual try-ons than actual try-ons. When node height is big, flared skirts have bigger nodes and clear plaits. Silk had the highest node height of 13.60 cm in actual try-ons, being followed by linen (10.51 cm), cotton (7.49 cm), wool (6.34 cm), and polyester (4.50 cm) in that order. Linen had the highest node height of 8.13 cm in virtual try-ons, being followed by wool (8 cm), cotton (6.82 cm), polyester (6.62 cm) and silk (2.9 cm) in that order. Silk exhibited the biggest difference between actual and virtual try-ons. Silk formed thick and clear nodes in actual try-ons and small and muted nodes in virtual try-ons because silk had many more nodes in virtual try-ons.
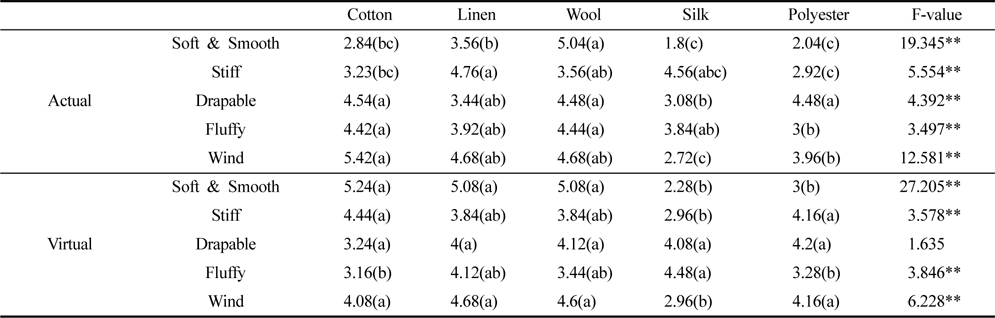
The visual images of flared skirts were evaluated with the adjectives used in previous study(Kim et al., 2011) and included the factors of drape feel through factor analysis, which are “soft,” “stiff,” “drapable,” “fluffy” and “wound.”
Table 5 shows the mean and standard deviation of the image adjectives of flared skirts between actual and virtual try-ons and also the test results of similarity between them via t-test. There were significant differences of
[Table 5.] Comparison of actual and virtual simulation visual images

Comparison of actual and virtual simulation visual images
Table 6 shows the analysis results of visual images according to the types of materials between actual and virtual try-ons. There were significant differences across all the items by the types of materials in actual try-ons. It was the same with virtual try-ons with the exception of “drapable.” Cotton was evaluated to be wound and drapable compared with other textiles and have a fluffy image in actual try-ons and to be soft, stiff, and wound in virtual try-ons. Soft and stiff can be interpreted to be conflicting with each other. The evaluators seem to have perceived soft as a concept of tactile sensation. Wool was evaluated to be soft and drapable both in actual and virtual try-ons. Linen was evaluated to be stiff in actual try-ons and soft and wound in virtual try-ons. Silk was evaluated to be stiff in actual try-ons and fluffy in virtual try-ons. Polyester was evaluated to be drapable in actual try-ons and stiff and wound in virtual try-ons. Except for wool, the materials showed opposite image evaluation results between actual and virtual try-ons. The evaluations varied according to the simulation and material types. In short, flared skirts were evaluated to be soft in virtual try-ons compared with actual try-ons. Wool (5.04) was the only material evaluated to be soft in actual try-ons. Cotton (5.24) and wool (5.08) showed rather different patterns in virtual try-ons. There were also rather conflicting results in the “stiff” factor between actual and virtual try-ons. Especially silk was evaluated to be a moderately stiff at 4.56 in actual try-ons and be not stiff at 2.96 in virtual try-ons. Polyester was evaluated to be a slightly not stiff at 2.92 in actual try-ons and slightly stiff at 4.16 in virtual try-ons.
[Table 6.] Comparison of actual and virtual simulation visual images by fabric type

Comparison of actual and virtual simulation visual images by fabric type
There were significant correlations of P0.01 in “stiff,” “drapable,” and “wound” between drape coefficient and visual images in actual try-ons and also in all the items between drape coefficient and the shapes of flared skirts(Table 7). Significant correlations of
[Table 7.] Correlations for drape coefficient, flare skirt shape and visual image

Correlations for drape coefficient, flare skirt shape and visual image
There were significant correlations of
There were no correlations between the visual image of “drapable” and all the exterior shape factors in virtual try-ons, which indicates that virtual try-on simulations fail to accurately reflect the visual images of actual try-ons.
In short, there were significant correlations between drape coefficient and the exterior shape factors both in actual and virtual try-ons. Drape coefficient, a quantitative item, and exterior shape factors can serve as useful data in virtual try-on simulations. In actual try-ons, on the other hand, there were no correlations between “fluffy” of the subjective visual images and drape coefficient and all the exterior shape factors. In virtual try-ons, the adjective “drapable” had no correlations with drape coefficient and the exterior shape factors, which reveals differences in results between adjectives with correlations according to simulation methods. In particular, non-significant correlations between all the quantitative items and the adjective “drapable” in virtual try-ons point to the limitations with virtual try-on simulations and to a need to reflect quantitative numbers related to drapablity in simulation programs.
There should be ongoing research to resolve and supplement problems in order to raise the utilization level of virtual try-on simulations by maximizing their various advantages. The virtual try-on technologies of the current level have limitations with material expression as well as some difficulties with commercialization. There are differences in simulation results and subjective evaluations perceived by consumers according to the types and physical characteristics of materials used in virtual try-on simulations. The present study thus selected five different types of materials, measured their quantitative exterior shapes factors to indicate drape coefficient and drapability, and analyzed visual images according to the simulation methods. Furthermore, it analyzed correlations between the quantitative measurements related to material drapability and visual images and reached the following conclusions about relations between virtual and actual try-on images:
First, the analysis results of hemline shapes between actual and virtual try-on according to the types of materials showed no match among the quantitative items of exterior shapes factors. The variation differences varied according to materials. Of the five materials, stiff silk, which had a very high drape coefficient and the lowest number of nodes, exhibited the biggest differences in the number of nodes between actual and virtual try-ons. Polyester showed the smallest difference in measurements of right and left width between them, whereas silk showed the biggest difference. While wool had the most similar measurements of front and back width, silk had the biggest ones. All of the five materials had a bigger measurement of ratio of right and left width against front and back width in actual try-ons than virtual try-ons, which indicates that the skirt form is closer to the prototype in virtual try-on simulations. Silk had the biggest mean distance between nodes, which corresponds with the result that silk showed the biggest differences in the number of nodes, right and left width, and front and back width.
Secondly, the study carried out statistical analysis of visual images in actual and virtual try-ons to analyze the visual images of five adjectives related to drapability according to the types of materials. As a result, there were no significant differences in the visual images except for “soft” according to the simulation methods, which means that the items can serve as part of a scale for visual image comparison. The analysis results of zero visual images between the two methods according to the types of materials reveal significant differences in all the items in actual try-ons according to the types of materials and also significant differences in all the items except for “drapable” in virtual try-ons. Except for wool the materials had conflicting image evaluation results between actual and virtual try-ons. Evaluation results varied according to simulation and material types.
Finally, the study also analyzed correlations between drape coefficient, exterior shapes, and visual images of various materials and found that there were significant correlations between drape coefficient and exterior shape factors both in actual and virtual try-ons. This suggests that drape coefficient and exterior shape factors can be useful data for virtual try-on simulations and confirms a need to reflect quantitative numbers related to drapability in simulation programs.
As pointed out in previous studies, there is a need for a systematic consideration through research that employs various types of materials with their basic physical properties modeled or that investigates differences in visual images by categorizing the basic physical properties by stages. It is nacessary to reflect quantitative numbers regarding “drapability” proposed in the study simulation software and to continue to build a systematic database for virtual simulations by investigating and testing various materials.