Discovery of rotation-power pulsars is a great example of a theoretician’s dream comes true. Shortly after the discovery of the neutron by Chadwick (1932), Baade & Zwicky (1934) proposed the existence of the neutron stars. Their conclusion was resulted from their investigation of the explosive endpoint of massive stars - Supernovae. In view of the tremendous energy release in supernovae, Baade & Zwicky had speculated that the release of the gravitational energy when a massive stellar core collapsed to form a neutron star can possibly power supernova. They envisioned that supernovae represent the transitions from “normal” stars into neutron stars, which would be at an ultra high density and with a small radius (cf., Baade & Zwicky 1934). This is the first precise prediction that neutron stars can be formed in core-collapsed supernova explosion. Despite progress in theoretical investigations had been made shortly after the prediction by Baade & Zwicky (e.g., Tolman 1939, Oppenheimer & Volkoff 1939, Hoyle et al. 1964), there was no conclusive observational evidence for the existence of neutron stars until late 1960s.
The most remarkable breakthrough of neutron star study came in November 1967. At the Mullard Radio Astronomy Observatory, Antony Hewish and his collaborators had build a large radio telescope array to study interplanetary scintillation of compact radio sources at 81.5 MHz. Soon after the instrument started operating, it had been noticed a series of weak sporadic signals. Observing with this transit telescope, these fluctuating signals appeared four minutes each day which indicated their celestial origin. In November, systematic investigations of these signals were initiated by adopting a recorder with a faster response time. The first sequence of clearly distinguishable pulses with periodicity of ~ 1.337 s were firstly recorded on November 28, 1967. This is the first detected pulsar - PSR B1919+21 (Hewish et al. 1968). The absence of any parallax ≥ 2 arcmin showed that the source is located further than 103 A.U. away. Also, the rapidity of the pulsation placed the upper limit of the source size to ~ 5 × 10³ km. This insight leaded the authors to suggest that the source could be a compact object, either a neutron star or a white dwarf. They have further speculated that the observed phenomena were associated with the oscillations of the compact star.
The discovery of PSR B1919+21 exerted an enormous impact on the international astronomical community. This can be reflected by the fact that more than 100 papers about pulsars were published in 1968. As a new class of objects appeared, the identification of their physical nature was badly needed. Actually, the correct path in explaining the origin of pulsar emission had already been published just before the discovery of PSR B1919+21. Adopting an oblique magnetic dipole rotator, Pacini (1967) had shown that the rotational energy of a neutron star can be converted into electromagnetic radiation. The author also specifically pointed out the possibility that a large amount of energy and momentum can be pumped from a rotating neutron star to the supernova remnant such as the Crab Nebula. Without knowing the work by Pacini (1967), Gold (1968) independently suggested that the observed pulsars were in fact rotating neutron stars which have magnetic fields as high as 1012 G. The author had also pointed out that neutron stars can explain many observed properties of pulsars such as the short and the high accuracy of the observed periodicities. Moreover, directional beam rotating like a lighthouse beacon was proposed to explain the substructure of the observed pulses. The author had also precisely predicted that the pulsar period should increase slowly as it radiates at the expense of the star’s rotational energy. Shortly after the publication of Gold (1968), a radio pulsar was discovered in the Crab Nebula which had a period as short as ~ 33 ms (Staelin & Reifenstein 1968). Such short period can only be achieved by either the rotation or vibration of a neutron star. This discovery had intimately connected supernovae, neutron stars and pulsars. Later, Richard & Comella (1968) discovered the increase in the period of the Crab Pulsar which was in agreement with the prediction by Gold (1968). Since the slowdown of the period can only be resulted from the rotation and not from vibration. This leaves a rotating neutron star as the most plausible model to explain all the observational facts. Furthermore, Gold (1969) demonstrated that the implied energy loss by the Crab Pulsar was approximately equal to the energy requires to power the Crab Nebula. At this time, the identification of pulsars as rotating neutron stars was generally accepted. The discovery of pulsars had eventually made a theoreticians’ dream come true!
Although Hewish et al. (1968) is generally regarded as the first milestone in pulsar astronomy1, the “first” light from the stellar system that host a neutron star had actually met our eyes earlier than PSR B1919+21. With a hindsight, the powerful persistent extra-solar X-ray source, Scorpius X-1, had been discovered with the X-ray detector on an Aerobee rocket (Giacconi et al. 1962)2, is now thought to be a neutron star in a low mass X-ray binary (LMXB) with an 18.9 hrs orbit and accretes from a ~ 0.4M⊙ companion. Systems of this kind have intimate relation with an exotic class of pulsars - millisecond pulsars (MSPs).
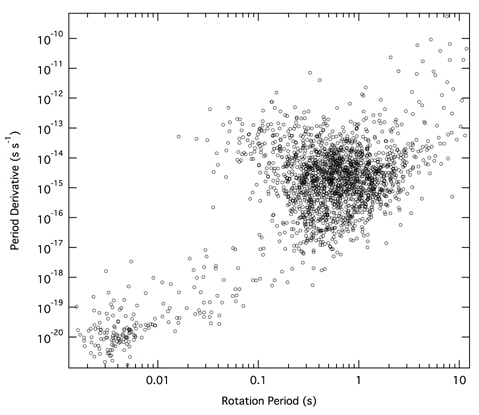
It is not possible to discuss the nature of MSPs without mentioning the evolution of rotation- powered pulsars. Fig. 1 shows the P-Ṗ diagram of the known pulsar population, which plays a crucial role in understanding the evolution of pulsars. It is obvious that the majority of them cluster at P ~ 0.1-5 s and Ṗ ~ 10-17-10-13 s s-1. This population starts to thin out towards the lower-right corner of the diagram. This phenomena is related to how a pulsar evolves as it ages.
As mentioned in Section 1, pulsars are rotating and highly magnetize celestial objects, they behave as natural unipolar inductors and are expected to generate huge electric field in vacuum. For those regions in the magnetosphere have their charge density deviated from the Goldreich-Julian density (which assumes a force-free condition, Goldreich & Julian 1969), electric fields can be developed along the magnetic field lines. By tapping the rotational energy of the pulsars, such regions can accelerate the particles to ultra-relativistic speed and radiate pulsed emission from radio to γ−ray. Various emission models had been proposed. Despite the fact that these models are fundamentally different from each other, they do incorporate acceleration of electron/positron in the charge depletion regions (or gaps) of certain forms. For theoretical reviews on these models, please refer to Harding (2013) and Cheng (2013).
Since pulsars radiate at the expense of its rotational energy, it will rotate slower and slower and moves gradually to the lower right corner of the diagram. After tens to hundreds million years, when the rotation eventually becomes too slow for sustaining the particle acceleration in the magnetosphere, the pulsed emission will be ceased and such pulsar enters its graveyard.
However, this is not the end of their story. Besides the main cluster centered at P ~ 1 s in the P-Ṗ diagram, one should notice there is a distinct population in the lowerleft corner (see Fig. 1) which their rotational period < 20 ms. These are MSPs. The standard scenario for the formation of MSP is that a dead pulsar comes out from its gravyard by accreting material from its binary companion (Alpar et al. 1982). During this “recycling” phase, the system appears as a LMXB. Approaching the end of this phase (on a Gyr timescale), the neutron star will accrete sufficient angular momentum and resuscitate particle acceleration in the magnetosphere and hence the pulsed radiation again. This marks the birth of a rotation-powered MSP.
This scenario was proposed by Alpar et al. (1982) shortly after the discovery of the first MSP PSR B1937+21 (Backer et al. 1982). Since then dedicated pulsar surveys have resulted in a population of more than two hundred MSPs which comprise ~ 10% of the whole pulsar population known today (Manchester et al. 2005). MSPs are characterized by their fast rotation and a surface magnetic field much weaker than the canonical pulsars (107 < B < 1010 G). Both characteristics are thought to be resulted from the recycling. Although the details of the magnetic field decay is still a subject under discussion (e.g., Konar 2010), the surface field can be somehow buried by the accretion. The current record of the fastest spin is the MSP PSR J1748-2446ad that resides in the globular cluster Terzan 5 (Hessel et al. 2006). It spins over 716 times per second which is more than double of the best Formula 1 engine!
Despite the aforementioned MSP formation scenario has been proposed for more than 30 yrs, many details of the recycling process remain uncertain. While MSPs are expected to be the end products of the X-ray binary evolution, it is surprised to notice that ~ 30% of the known MSPs in the Galactic field are found to be isolated (Roberts 2013). One popular scenario to explain their solitudes is the high energy radiation and/or the pulsar wind particles from these rejuvenated pulsars have ablated their companions (van den Heuvel & van Paradijs 1988). This suggested scenario was motivated by the discovery of MSP PSR B1957+20 (Fruchter et al. 1988). It is a binary contains a 1.6 ms MSP and a very low mass companion (Mc ~ 0.02M⊙) in a 9.2 hrs orbit. Eclipses of radio pulsations have been observed from this system when its companion lies between the MSP and us. Such eclipses occur regularly for ~ 10% of the orbit around the aforementioned phase which is called inferior conjunction (INFC). It has been suggested that this can happen when the radio signal has been absorbed or scattered by the dense ionized gas streaming off from its evaporating companion (Kluzniak et al. 1988, Ruderman et al. 1989a,b). A binary system of this kind is commonly referred as “black widow” because the situation is similar to a female spider that eats its mate after mating.
The relativistic wind particles, which have been speculated for their role in evaporating the companion stars, have consumed a large fraction of the rotational energy of the neutron star. While the pulsed emission is originated within the magnetosphere, the wind region extends beyond the light cylinder (i.e. the distance from the pulsar at which the corotation velocity equals to the speed of light). Despite the fact that they carry a large amount of energy, these wind particles are mostly invisible on their own. Then how does one know their existence and their role in vaporizing the companion star?
The presence of pulsar wind will be noticed when it interacts with the surroundings. Three different effects of interaction with pulsar wind particles has been observed from PSR B1957+20: (1) acceleration of wind particles in the termination shock ahead the direction of the pulsar’s motion; (2) Intrabinary shock resulted from the interaction between the pulsar wind and the ablated material from its companion; (3) The heating of its companion by the wind collision.
To characterize the wind, a magnetization parameter, σ, is commonly used which is defined as the ratio between the Poynting flux and the particle energy flux. Almost all pulsar emission models predict that the Poynting flux is many orders of magnitude larger than that of the particles (cf. Gaensler & Slane 2006). When the wind flows through the light cylinder, σ is typically > 104. However, modeling the structure of the Crab Nebula requires σ ≤ 0.01 just behind the termination shock (Kennel & Coroniti 1984, Rees & Gunn 1974). This implies the wind particles must be dramatically accelerated in a region between the light cylinder and the termination shock. Although there are many attempts in establishing the connection between the magnetosphere and the wind zone (e.g., Contopoulos et al. 1999), there is no generally accepted model.
In the termination shock, the relativistic wind particles interact with the shocked interstellar medium and radiate synchrotron radiation across the electromagnetic spectrum. Physical models for describing pulsar wind nebular emission can be divided into to two main classes, depending on whether the pulsar is moving subsonically or supersonically (Cheng et al. 2004). For a subsonic pulsar motion, the termination shock radius Rs is determined by the balance between the wind ram pressure and the total magnetic and particle pressure within the nebula (Rees & Gunn 1974). This will result in axisymmetric nebulae with the pulsars at the center, which are observed for many young pulsars. The classic example is the Crab Nebula.
On the other hand, in case of supersonic motion, bow shock nebulae can be formed which has been found for the less energetic but fast-moving pulsars (e.g., Hui et al. 2012, 2008, 2007, 2006). Rs is then determined by the balance between the wind particles and the interstellar medium (ISM) at the head of the shock:

where ρISM is the density of the ISM and vp is the pulsar velocity. Such bow shock nebulae typically have a cometarytail morphology. After being accelerated in the termination shock, the relativistic wind particles radiate synchrotron emission as they trail behind the pulsar’s motion. And therefore, such synchrotron bow shock nebulae typically have a cometary-tail morphology. Studying the X-ray emission from bow shock nebulae may help to better understand their ambient environment and the interaction between the pulsar and the ISM. Until now only two MSPs, PSR B1957+20 (Stappers et al. 2003) and PSR J2124-3358 (Hui & Becker 2006) have been found to be associated with X- ray nebulae. For such rare systems, it is worthwhile to investigate them in details with follow-up observations.
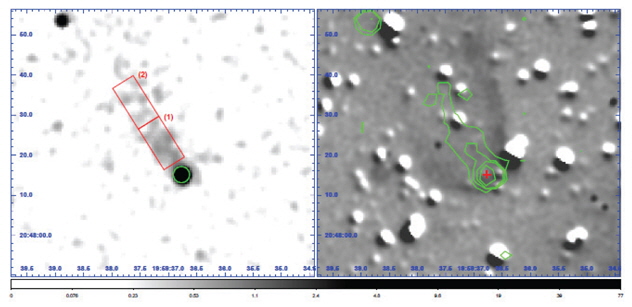
At a radio dispersion measure inferred distance of ~ 2.5 kpc, PSR B1957+20 moves through the sky with a supersonic velocity of 220 km s−1 (Arzoumanian et al. 1994). We have carried out a follow-up X-ray study with a deep Chandra observation of an uninterrupted 169 ks exposure (Huang et al. 2012). Fig. 2 (left panel) shows the Chandra X-ray image in the energy band 0.3–8 keV of the field around PSR B1957+20 obtained by the Advanced CCD Imaging Spectrometer (ACIS) on board. This image was created by using an adaptive smoothing algorithm with a Gaussian kernel of σ < 3 pixels in order to probe the detailed structure of faint diffuse emission. Both the pulsar and its X-ray nebula can be clearly seen in this image. A ~ 25′′ X-ray tail extending from PSR B1957+20 with a position angle opposite to the pulsar’s proper motion direction is unambiguously resolved.
Cheng et al. (2006) suggests that the observed length (l) of the X-ray tail can be interpreted as the distance traversed by the pulsar within the electron synchrotron cooling timescale (tc), i.e., l ~ υp tc, where υp is the proper-motion velocity of the pulsar. The cooling time in the X-ray band is ~ 108 (hvX/keV)-1/2 s, where BmG is the inferred magnetic field strength in the emitting region (Cheng et al. 2006). Adopting the inferred tail length of ~ 9.7 × 1017 cm at the distance of 2.5 kpc and a proper motion velocity of 220 km s-1, the synchrotron cooling timescale is estimated to be ~ 4.9 × 10⁴ yrs. This yields a magnetic field of B ~ 17.7 μG in the shock region. Considering a magnetic field strength of ~ 2 − 6 μG in the ISM (cf., Beck et al. 2003, and references therein), we found that the magnetic field in the termination shock might be compressed by a factor of ~ 3, which is consistent with the estimated value reported by Kennel & Coroniti (1984).
The deep exposure time of this Chandra observation allows us to constrain the emission nature of the X-ray tail with a spatially-resolved spectroscopy. A softening of the spectrum of the X-ray tail as a function of the distance from the pulsar is expected if synchrotron cooling of the particles injected at the termination shock is dominated. For the purpose of investigating the possible spectral variation, we performed a spatially-resolved spectral analysis using two separate extraction regions along the tail. We refer the segment close to the pulsar as region 1 and the further one as region 2 in the following (Fig. 2). Through a joint spectral analysis (see Hui et al. 2012 for details), the powerlaw indices inferred for region1 and region 2 are found to be Γx ~ 1.6 and Γx ~ 2.1 respectively (Huang et al. 2012). This provides a support for the scenario that particles injected at the termination shock are dominated by synchrotron cooling.
We have also investigated the orbital X-ray modulation in details. Huang & Becker (2007) have reported a strong correlation of the pulsar’s X-ray flux with its orbital period. However, due to the short exposure we could not know whether the flux modulation was periodic and given the limited photon statistics it was not possible to investigate any spectral variation as a function of orbit phase or to determine the exact geometry of the peak emission. With a repeated coverage of the binary orbit in our deep Chandra observation, we have attempted to determine the emission geometry with improved accuracy (Huang et al. 2012).
As this Chandra observation covers over five consecutive binary orbits, we can firmly conclude that the X-ray flux is not steady with time. We also applied a Kolmogorov-Smirnov (KS) test to the unbinned light curve data in order to have a bin-independent statistical evaluation of the X-ray emission variability. Calculating the corresponding KS probabilities between our data set and the cumulative distribution function generated by assuming a constant X-ray flux indicated a marginal deviation between these two distributions. The significance for an intra-orbital flux modulation from this test is only at the level of ~81%. A more significant result, i.e. ~ 96%, is obtained if we restrict the analysis to the soft energy band below 2 keV.
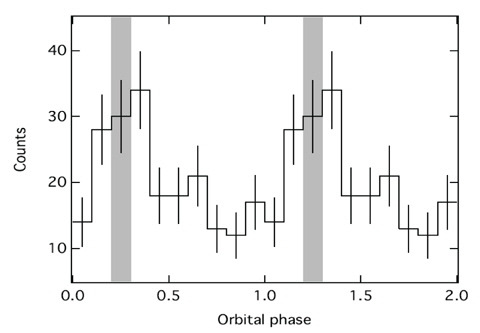
In order to search for a modulation of the X-ray flux as a function of orbital phase, we first selected X-ray data covering 5 complete and consecutive orbits and then to fold a light curve at the orbital period according to its radio timing ephemeris (Fig. 3). Using a χ2 -test, the significance for a flux modulation over the observed orbit was found to be ~ 99%.
The folded light curve shows that the observed flux peaks just before and after the pulsar eclipse can be interpreted as the Doppler effect caused by the bulk flow in the down stream region. If the post-shocked wind flows toward (or away from) the Earth, the Doppler effect increases (or decreases) the observed flux from the flux for an isotropic case. The shock geometry is controlled by the ratio of the momentum fluxes of the pulsar wind to the stellar wind. For PSR B1957+20, the observed orbital period derivative Ṗb ~ 10-11 (Fruchter et al. 1990) suggests the mass loss rate Ṁ* ~ M* ṖbPb-1 ~ 10-10 M⊙ yr-1, where M* = 0.02 M⊙ and Pb = 33001 s is the orbital period. With the mass-loss rate of Ṁ ~ 10-10 M⊙yr-1, the ratio of the momentum fluxes of the pulsar wind and the stellar wind is in the order of η ≡ Lsd/Ṁ* vesc ~ 10(Lsd/1035 erg s-1 Ṁ*/10-10 M⊙ yr-1 ves/300 km s-1, indicating the companion star is confined by the pulsar wind and the shock. With momentum ratio η ~ 10, the opening angle of the cone-like shock is ~ 50 − 60◦, which corresponds to ~ 0.15 orbital phase. Because the emission is concentrated in the forward direction of the flow, therefore, we expect that double peaks due to the Doppler effect appear at ~ 0.15 phase before and after the phase of radio eclipse, which is consistent with the observation.
As we can see in Fig. 3, the observed ratio of maximum to minimum fluxes is 2 ~ 3. For the emissions from the pulsar wind, the outgoing flux is modified by the Doppler effect as Fv (E) = D3F'v'(E') and E = DE', with primed quantities refereeing to the comoving frame. Here the relativistic boosting factor is given by
where Γf and βf is the Lorentz factor and velocity in units of the speed of light of the flow, respectively, and θf is the angle between the Earth viewing angle and the direction of the flow. The ratio of maximum to minimum fluxes is estimated by

where α is the photon index, θf,max and θf,min ~ π − θf,max are typical angles at the orbital phases where the observed fluxes are maximum and minimum, respectively. For example, the observed ratio Fmax/Fmin ~ 2 − 3 and the photon index α ~ 2 implies the flow velocity βf ~ 0.12 − 0.19 for θf,max = 45◦ and βs ~ 0.2 − 0.32 for θf,max = 65◦. Note that Guillemot et al. (2012) estimates the fraction of the pulsed emissions as about 30 % of the total emissions. In such a case, the pulsed emissions may considerably contribute to the observed emissions at off-peak orbital phase, and the intrinsic ratio of the maximum to minimum fluxes of the X-ray emissions from the inter-binary shock is larger than Fmax/Fmin ~ 2 − 3. This results in increase in the flow velocity estimated from equation (3).
To investigate whether the X-ray spectral behavior of PSR B1957+20 varies across the orbit, we analyzed the X-ray spectra within the orbital phase of ø = 0.05 − 0.45 which covers the ingress, eclipsing, and egress region and outside the aforementioned region (ø = 0.45 − 1.05) separately. We found that the binary-phase resolved spectral analysis reveals a non-thermal emission nature of the detected X-rays and each of the observed spectra can be well described by a single power-law (PL) model with different photon indices (Γ ~ 2.1 in ø = 0.05 − 0.45, Γ ~ 2.5 in ø = 0.45 − 1.05), which indicates that its spectral behavior is orbital dependent.
All these suggest the orbital-modulated non-thermal X-ray emission from PSR B1957+20 is mostly due to intrashock emission at the interface between the pulsar wind and the ablated material from the companion.
Optical observations had also revealed that the pulsar wind consisting of electromagnetic radiation and highenergy particles is ablating and evaporating its white dwarf companion star (Fruchter et al. 1988, van Paradij et al. 1988). Subsequent analyses of the optical light curve for the binary system by Reynolds et al. (2007) gave a constraint to the system inclination of 65◦ ± 2◦ for a pulsar in the mass range 1.3 − 1.9 M⊙. The effective temperatures of T = 2900 ± 110 K and T = 8300 ± 200 K for the unilluminated side and the illuminated side of the companion were also obtained in their studies.
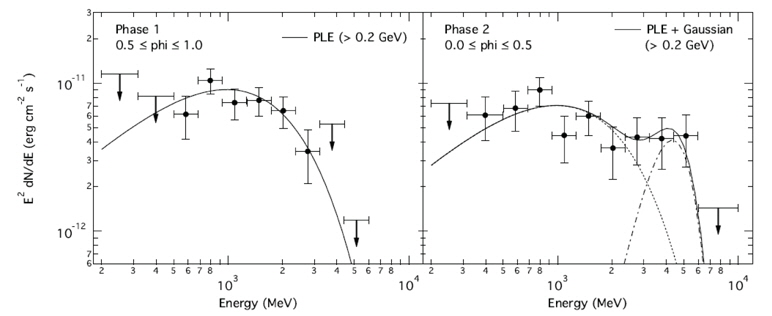
Apart from the aforementioned X-ray investigation, we have searched for orbital dependence of the γ-ray emission from PSR B1957+20 by using the data obtained by the Large Area Telescope (LAT) onboard Fermi Gamma-ray Space Telescope (Wu et al. 2012). To investigate whether the γ- ray spectral properties vary with the orbital phase ø, we divided an orbital cycle into two parts: half of the orbit centered at the superior conjunction (hereafter “Phase 1”) and the other half containing the inferior conjunction (hereafter “Phase 2”). We obtained the best-fit parameters for both regions by an unbinned likelihood analysis and assume the spectral shape has a form of a power-law with an exponential cut-off (PLE) model, dN/dE = N0(E/0.2 GeV)-Γ exp [−(E/Ec)], where N0 is a normalization factor, Γ is the photon index and Ec is the cutoff energy. For Phase 1, the best-fit parameters are a photon index of Γ1 = 0.83 ± 0.56 and a cut-off energy of Ecutoff,1 = 0.84 ± 0.30 GeV, while for Phase 2, Γ2 = 1.58 ± 0.30 and Ecutoff,2 = 2.28 ± 0.88 GeV. The difference in cut-off energies in the two phases suggests that the spectrum of Phase 2 extends to higher energies than that of Phase 1.
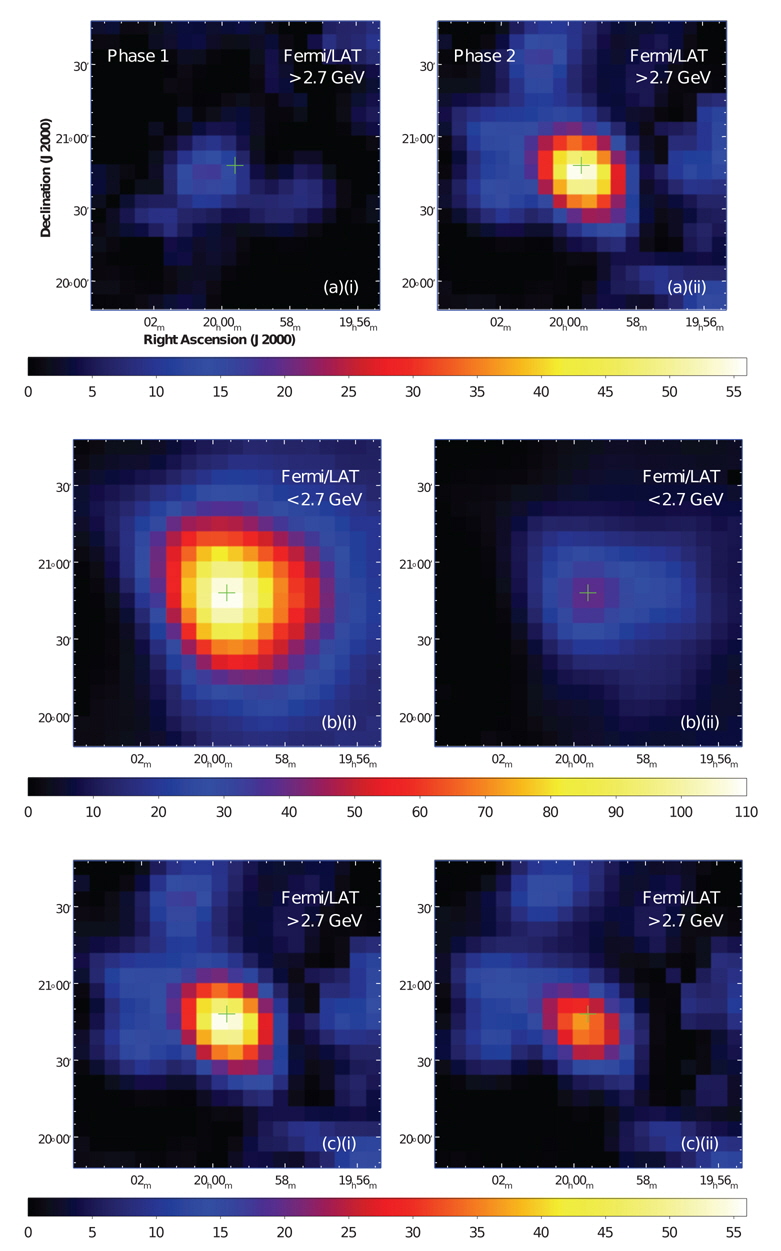
By comparing the γ-ray spectra, we speculate that the spectrum for Phase 2 could be described by two components, one being magnetospheric, and the other component above ~ 3 GeV which originates from the interaction between the pulsar wind and the companion star. To describe this component while avoiding bias towards any emission scenario, we adopted a simple Gaussian profile dN/dE =Aexp-[(E-Ē)2/σG2] to fit the data along with a PLE model with the spectral index and the cutoff energy fixed at the best-fit values derived from Phase 1. The best-fit two-component model is presented as the solid line in the right panel of Fig. 4. The best-fit parameters for the Gaussian component are Ē = 3.76 ± 0.59 GeV and σG = 1.10 ± 0.39 GeV. To access the significance of emission of this extra component, we performed likelihood analysis using the data at energies above Ē − σG ≈ 2.7 GeV by assuming a simple power-law model, alleviating the effect of the spectral model on the significance. For Phase 2, a test statistic (TS) value of 55 was achieved, corresponding to a significance of ~ 7σ, whereas for Phase 1, a TS value of 14 was obtained, indicating that the detection significance is below 4σ at > 2.7 GeV for Phase 1. We have computed the TS maps using at energies > 2.7 GeV for both Phase 1 and Phase 2, which are shown in . 5(a). The difference in the TS values for the two orbital phases is readily observable by comparing the maps.
We further compare the significance of emission in Phase 2 below and above 2.7 GeV, before and after removing the magnetospheric contribution. At energies below 2.7 GeV, the TS value decreased from 105 to 38, while at energies above 2.7 GeV, the TS value decreased from 55 to 36. Fig. 5(b) and Fig. 5(c) show the TS maps for a visual comparison before and after the removal of the pulsed component.
The above results indicate the presence of emission above 2.7 GeV, which is significantly detected in Phase 2 but not in Phase 1. Hence, the γ-ray emission from PSR B1957+20 is dependent on the orbital phase of the binary system. Moreover, the removal of the pulsed emission component has caused a greater decrease in the detection significance at energies below 2.7 GeV than above, implying the majority of the emission of 2.7 GeV in Phase 2 are not produced inside the pulsar magnetosphere, but in the intrabinary region.
Since the best-fit two-component model suggests that photons at ≥ 2.7 GeV may be modulated with the orbital phase, we constructed a phase-folded light curve with the photons of energies > 2.7 GeV which is shown in Fig. 6. The post-trial significance of this γ-ray modulation is ~ 2.3σ.
All these results have demonstrated that the significant emissions above 3 GeV appears around INFC, while the emissions below 3 GeV are steady and are described by the pulsar emissions. We expect that the modulated emissions above 3 GeV is originated from the inverse-Compton scattering of the thermal radiation of the companion star off the “cold” (i.e. low energy of the leptons in the comoving frame of the plasma) ultra-relativistic pulsar wind.
In the last few years, a new population of eclipsing binary MSPs has emerged. Although the range of orbital period spanned by these systems is similar to that of black widow MSPs (Pb ≲ 20 hrs), their companion masses (Mc ~ 0.2 − 0.4M⊙) are significantly larger than that of black widows (Mc ≪ 0.1M⊙) (Roberts 2013). This population is dubbed as “redbacks” (which are the Australian cousins of black widow).
More than a dozen of redbacks have been identified so far3. These systems are suggested to have their states possibly swinging between rotation and accretion power phases according to the mass transfer rate (Shvartsman 1970, Burderi et al. 2001). Theoretical models have suggested for a long time that an accretion-powered MSP in a LMXB will turn on as a rotation-powered MSP when the system is in quiescence (Alpar et al. 1982). Although how exactly the transition happens is not completely understood, it is widely believed that the radio pulses from the MSP can only get through after the removal of the accretion disk. Possible disk removal mechanisms include the pulsar wind ablation, radiation pressure originated from the MSP, and the propeller effect.
PSR J1023+0038 is the first identified redback MSP which provides evidence for the transition from an X-ray binary to a radio MSP (Archibald et al. 2009, 2010, Thorstensen & Armstrong 2005). It was firstly identified as a LMXB (Homer et al. 2006) and a radio MSP was found subsequently (Archibald et al. 2009). The source clearly showed an accretion disk before 2002 (Wang et al. 2009) and the disk has then disappeared (Archibald et al. 2009); radio pulsation was found in 2007 (Archibald et al. 2009). Therefore PSR J1023+0038is considered as a newly born MSP, representing the long sought-after missing link of a rotation-powered MSP descended from a LMXB. Shortly after this exciting discovery, we have investigated PSR J1023+0038 in X-ray and γ−ray regimes (Tam et al. 2010).
In X-ray, we have searched for it orbital variability by using the XMM-Newton observations which conveyed on 2004 May 12 and 2008 November 26. We found that the single PL model provides an acceptable description of the combined data with the spectral parameters as in Archibald et al. (2010). However, we found systematic deviations in this model, indicating that additional component(s) might be required. Motivated by the possible presence of both pulsed emission and emission dependent on the orbital phase of the binary, we fit the spectrum with a broken power law (BKPL). The goodness of fit was found to be improved significantly. Different from the PL fit, no systematic fitting residuals were found in this model. We also examined the data from each observation with the BKPL individually and found the same behavior in both epochs. The break energy was found to be keV. The spectrum was found to be steeper () at E < Eb than that in the hard band (). The unabsorbed flux was found to be erg cm-2 s-1(0.01-10 keV). At a distance of d ~ 1 kpc, the isotropic X-ray luminosity is ergs s-1(0.01–10 keV), corresponding to an X-ray conversion efficiency of ≥ 0.03% of the spin-down luminosity.
The fact that more than one PL index is required to explain the observed X-ray spectrum strongly suggests an additional non-thermal X-ray contribution from this system besides the magnetospheric radiation. we speculate that the additional non-thermal component originates from the intrabinary shock. Furthermore, our spectral analysis suggests that the emission below and above the break energy might have different origin. This led us to perform an energy-resolved analysis of the modulation of the X-ray flux as a function of orbital phase. According to the resultant break energy, we divided the energy range (0.3–10 keV) suitable for timing analysis into two bands: 0.3–2.0 keV (soft) and 2.0–10.0 keV (hard), and computed energy-resolved light curves.
From the XMM-Newton observation in 2004, we have found no significant variability at the orbital period in both the soft and hard bands. This can be ascribed to low photon statistics as well as insufficient orbital coverage. Therefore, we focus on the 2008 observation. The orbital light curves of the soft and hard bands are shown in Fig. 7. It can be clearly seen that both soft and hard X-rays contribute to the orbital modulation and the troughs and peaks in the orbital light curves in these two bands occur at the same orbital phases (around 0.2 and 0.6 respectively). Using a χ2-test, the significance for a flux modulation over the observed orbit in the soft and hard bands was found to be ~99.1% and ~85.5%, respectively. Although the significance derived from this test is higher for soft X-rays than for hard X-rays, we could not determine the energy band for which the modulation is greater.
The spin down power of PSR J1023+0038 (Lsd ≤ 3×1035 erg s−1) is relatively high compared to other γ-ray emitting MSPs (Abdo et al. 2009). Therefore, a small fraction of this power would suffice to generate γ-ray emission. Since these γ−rays may be responsible for ejecting the disk material out of the binary system, this prompted us to search for γ-rays from PSR J1023+0038 (Tam et al. 2010). Using the Fermi LAT data obtained between 2008 August 4 and 2010 July 14, we have discovered γ−ray emission from PSR J1023+0038 at a significance of ~ 7σ. The TS map of the 5◦×5◦ region around the pulsar with 200 MeV–20 GeV γ-rays is shown in Fig. 8. The γ-ray spectrum can be described by a PL with a photon index of 2.9±0.2, resulting in an energy flux above 200 MeV of erg cm-2 s-1. At a distance of 1.3 kpc, the γ−ray luminosity is ~ 1.1 × 1033 erg/s which implies a γ−ray conversion efficiency of only ≥0.3%. Such γ−ray luminosity and conversion efficiency are among the smallest of γ−ray emitting MSPs.
In such a system that recently transited from the LMXB phase to the radio MSP phase, we have predicted that its radio pulsation may not be permanent as an accretion disk may reform around the neutron star and hence can possibly switch off the radio MSP. Therefore, cycles of on and off states of pulsar activity could possibly be repeated. Therefore, continuous monitoring in all wavelengths of this unique source will test this idea and help us to comprehend its on-going evolution. Since then, we have devoted considerable effort in monitoring this system from optical to γ−ray.
Indeed, another exciting episode of PSR J1023+0038 was on around the middle of 2013. Since 2013 late-June, the radio pulsation of PSR J1023+0038 has disappeared between 350 MHz and 5 GHz (Stappers et al. 2013, Patruno et al. 2014). Meanwhile, recent optical spectroscopy shows strong double peaked Hα emission indicating that an accretion disk is formed (Halpern et al. 2013). Moreover, the X-ray emission has increased by a factor of at least 20 comparing with previous quiescent values (Kong 2013) and the UV emission has brightened by 4 magnitudes (Patruno et al. 2014). All these strongly indicate that PSR J1023+0038 is switching from a radio MSP back to a LMXB with an accretion disk. In addition, the γ−ray emission (> 100 MeV) as seen with Fermi has been reported to brighten by a factor of 5 (Stappers et al. 2013, Patruno et al. 2014). It is somewhat a surprise as we expect that the γ−rays should be turned off like radio during the accretion state (e.g., Takata et al. 2010, 2012).
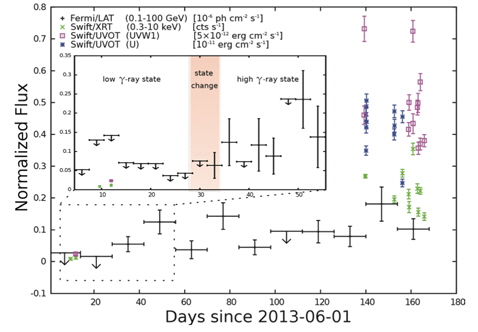
The results of our multiwavelength monitoring campaign from June 1 2013 to November 13 2013 are shown in Fig. 9 (see Takata et al. 2014 for details). Fermi LAT is an ideal instrument for uninterrupted monitoring as it continuously scans the whole sky approximately every 3 hours. To show the change in γ-ray flux just before and after the state change, we constructed γ-ray light curves since June 2013 with the one shown in the inset focusing on the time interval of the γ-ray state change seen in late June/early July. The bin size is 14 days and 3 days for the main panel and inset, respectively. Upper limits were derived for those time intervals in which the TS values were below 9 (4) for the main panel (inset), assuming a power-law index of Γ = 2.3. It is clear that PSR J1023+0038 cannot be detected in two week’s time before July 2013; we designate such time interval as low γ-ray state. After the state change (a time interval we call high γ-ray state), the γ-ray flux has remained at a much higher level for most of the time.
We estimated the dates of the state-change, i.e., when the binary system changed from the low γ-ray state to the high γ-ray state, as follows. Likelihood analysis were performed for the time intervals spanning one week (7 days). The first time interval that we used starts at June 2 0 and ends June 26, then we shifted the analyzed time interval for one day, i.e., the next time interval is hence June 21–27, the third time interval is June 22–28, and so on. The last time interval is July 8–14.
In the beginning, TS values are below 10. The first bin having TS>10 occurred at June 29 – July 5. Note that never before (or, never since March 2013) could PSR J1023+0038 be detected at this significance with only one week of data, so during this particular week (June 29 – July 5) PSR J1023+0038 has undergone a state change from the low state to high state in γ-rays. We indicate this time interval in Fig. 9.
To look for orbital modulation, we mapped orbital phase to geocentric arrival time and divided the data into two halves in orbital phase, each center red at one of the conjunctions. We performed the same analysis as above in each phase interval and did not detect any significant orbital modulation.
In X-ray, the flexible scheduling of Swift makes it suitable for monitoring PSR J1023+0038. Apart from the X-ray telescope (XRT), Swift also equips with UVOT which makes a simultaneous observation in X-ray and UV possible. Since the disappearance of the radio pulsation, the pulsar has been monitored by Swift/XRT for the X-ray evolution. The X-ray properties observed in 2013 June 10 and 12 (Kong 2013) are roughly consistent with previous XMM-Newton observations taken in 2004 and 2008 (Archibald et al. 2010, Tam et al. 2010), indicating the system was still in quiescence. Since October 18, an enhanced X-ray emission was detected from a 10 ks XRT observation (Kong 2013, Patruno et al. 2014) reflecting a rapid X-ray activity in the binary system. Since then, a daily monitoring campaign was triggered to monitor PSR J1023+0038 almost daily in November (Papitto et al. 2013) and the X-ray source has stayed at a high flux level with high variabilities on timescales of a few tens of seconds. In this study, we mainly focus on the observations taken after the X-ray brightening (i.e., October 18) to investigate the origin of the enhanced X-ray radiations.
In examining the individual observation, we found no sign of significant spectral variability among them. Therefore, we combined all the selected events to construct an averaged X-ray spectrum (0.3–10 keV) with a total exposure time of 22.6 ks, which can be well described by an absorbed power-law model with a . An absorption corrected luminosity of L0.3−10 = (2.20 ± 0.07) × 1033 erg/s at 1.3 kpc. Comparing with previous XMM-Newton results (Tam et al. 2010), the X-ray luminosity during the high state is increased by at least a factor of 20 with a much softer photon index.
As the average observed count rate is about 0.21 cts s−1, a 50-second bin time is used for the lightcurve binning to achieve a mean signal-to-noise ratio > 3 per bin approximately. Short term variabilities on timescales of a few tens of seconds are clearly seen in the curve with variations up to a factor of ten between two consecutive bins. Interestingly enough, at least 21 of the data bins (with fractional exposure equals one) have zero count rate, which are unlikely random events due to an extremely low Poisson probability of getting a null count in a 50-second exposure (i.e., 0.0027%). Some of the zero count bins are close enough with other low count rate bins (≤ 0.07 cts s−1) to form several low-flux intervals in ranges of 200 to 550 seconds. Meanwhile, the peak flux reaches 1.64 ± 0.23 cts s−1 which arises from 0.10 ± 0.06 cts s−1 in 100 seconds, stays for about 50 seconds, and then drops to 0.06 ± 0.05 cts s−1 in 100 seconds. However, no significant hardness variability is found despite the high flux variability.
We have also search for the X-ray periodic signals from the known orbital and pulsar periods (Archibald et al. 2009, Wang et al. 2009). Although no reliable signal regarding to the orbit nor the pulsation is found, an unknown periodic signal of P ≈ 245s is detected from UT 6:36:42 to 7:04:35 on October 19 (about 7 cycles), which is not detected in other observations.
Using the UVOT onboard Swift, we have observed PSR J1023+0038 in UV (3465Å and 2600Å) simultaneously with XRT during its X-ray high state. We found that the UV magnitudes are much brighter than those quiescent measures taken in June by ~ 3.7 mag. The UV emission varies among the observations between 16.76–15.98 mag (3465Å) and 16.90–16.12 mag (2600Å) with uncertainties less than 0.07 mag (extinction uncorrected). No trend can be found when folding the obtained lightcurve by the orbital period Pobs = 0.198094(2) days (Thorstensen & Armstrong 2005) suggesting that the variability is not orbit related. The observations were from November 6 have provided us with sufficient resolution to investigate short term variabilities with timescales down to a few tens of seconds. We chose a binning factor of 50 seconds and found that the binned lightcurves are full of variabilities with timescales between ~ 100 and ~ 500 seconds. The corresponding XRT data were examined but no clear correlation between the UV lights and the X-rays was found.
Although we have not observed PSR J1023+0038 in radio, it is instructive to have a review on its history of radio emission. The radio emission from the position of PSR J1023+0038 was firstly reported by the FIRST VLA 1.4 GHz survey (Becker et al. 1995). In re-examing the FIRST data, Bond et al. (2002) realized that the detection reported by Becker et al. (1995) was based on a single ~ 6.6 mJy flare from a 1.4 GHz observation on 10 August 1998. On the other hand, the observations on the 3 August 1998 and 8 August 1998 resulted in non-detections and the corresponding limiting flux densities are < 1.8 mJy and < 3.4 mJy respectively (Bond et al. 2002). These observations clearly demonstrate the variability of the radio emission from this binary system, which can vary by a factor of ~ 4 over a period as short as a week. However, without the optical spectroscopic results from this epoch, it remains uncertain whether the system was in rotation-powered or accretionpowered state. But the transient radio emission from a neutron star in an accreting binary is possible (Gaensler et al. 1999). During the rotation-powered phase, the radio emission from PSR J1023+0038 becomes more intense. Archibald et al. (2009) reported a mean flux density of ~ 14 mJy at 1.6 GHz. Recently, a long-term radio monitoring campaign of PSR J1023+0038 from mid-2008 to mid-2012 has reported the variable radio properties such as variable eclipses, short-term disappearance of signal and excess dispersion measure at random orbital phases (Archibald et al. 2013).
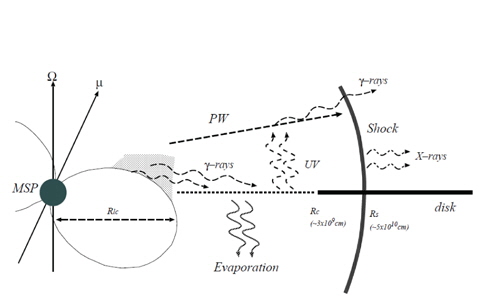
The schematic view of multi-wavelength emissions from PSR J1023+0038 after 2013 late-June. The accretion disk extends beyond the light cylinder radius (Rlc). Rs is the distance to the intra-binary shock from the pulsar. Below the critical distance (Rc), the gamma-rays evaporate the disk matter. UV/Optical photons are mainly produced by the disk emissions at R ~ 109−10 cm. The interaction between the pulsar wind and the stellar wind creates a shock and produces the non-thermal X-ray emissions. The inverse-Compton process of the cold-relativistic pulsar wind off UV/Optical photons from the disk produces the gamma-rays (see Takata et al. 2014).
Based on a radio observation at 1.4 GHz performed on 23 June 2013, Stappers et al. (2013) reported the non-detection of pulsed radio emission from PSR J1023+0038 with a limiting flux density of <0.06 mJy. However, it should be cautious in interpreting the result as it does not necessarily provide evidence for the quench of coherent radio emission mechanism. For an alternative scenario, assuming the pulsar remains to be active, the matter transferred from the companion toward the neutron star can be ejected by the pulsar wind (Ruderman et al. 1989). Also, the matter evaporated from the disk by the pulsar can further complicate the circumstellar environment. Therefore, even with the presence of active pulsar mechanism, the nondetection of pulsed radio emission can possibly due to the enhanced scattering/dispersion in the environment which results in a smearing of the pulsed signal.
Based on all these observational evidences, we have developed a theoretical model to explain the multiwavelength observations of PSR J1023+0038 in its current accretion active state by assuming the pulsar is still powered by rotation. Fig. 10 shows a schematic view of the multiwavelength emission from PSR J1023+0038 after 2013 late June. Our model suggests that a newly formed accretion disk due to the sudden increase of the stellar wind could explain the changes of all these observed features (see Takata et al. 2014 for further details).
With the observed flux of the UV emissions (LUV ~ 1033 erg s−1), the standard gas pressure supported disk model (Frank et al. 2002) implies a mass loss rate of Ṁ16 = Ṁ/1016g s−1 ~ 1 and the inner edge of the accretion disk is Rin ~ 109−10 cm from the pulsar. This result suggests that the accretion disk does not substantially extend down to the pulsar or the emissions from the disk below 109−10 cm is inefficient. Indeed, from the optical spectroscopy, the peak velocity of Hα infers an outer disk size of ~ 1010 cm.
Tam et al. (2010) expected that the GeV emissions during the pulsed radio state are originated from the outer gap in the pulsar magnetosphere, because the inverse-Compton processes of the shocked pulsar wind and the coldrelativistic pulsar wind could not explain the observed flux level. The existence of the GeV γ−ray emissions even after the disappearance of the pulsed radio emission suggests that the accretion matter does not enter into the pulsar magnetosphere, and the rotation powered activities are still turned on.
The increase in the flux by a factor of 10 after the disappearance of the pulsed radio emissions implies that an additional component emerges and it dominates the magnetospheric component. We propose that the inverse-Compton scattering process of the cold-relativistic pulsar wind off the soft photons from the disk produces the additional gamma-rays. With the observed luminosity of the UV emissions from the disk, the depth of the inverse-Compton scattering process is estimated to be of order of τic ~ nsσTr ~ 0.4(LUV /1033 erg s−1)(Es/3eV)−1(r/109 cm)−1, where ns = LUV/4πr2cEs is the number density of the soft photons, LUV is the luminosity of optical/UV emissions from the disk, Es is the soft photon energy and σT is the Thomson cross section. Hence, if the disk extends below R ~ 109 cm, the inverse-Compton of the cold-relativistic pulsar wind can produce the observable gamma-rays. We note that the up-scattered photons will be observed as a steady component with the orbital phase, because the accretion disk surrounds the pulsar.
After 2013 late-June, the X-ray emission does not show the orbital variation and increases by at least a factor of ~ 20. Previous X-ray observations during the radio millisecond pulsar phase revealed orbital flux variation, implying the emissions from the intra-binary shock (Tam et al. 2010, Bogdanov et al. 2011). Bogdanov et al. (2011) suggested that the emission region near the companion star and its orbital variation are caused by the eclipse of the emission region by the companion star. The disappearance of the orbital variation after 2013 late-June may suggest that the size of the emission region is bigger than that of before 2013 late-June. We expect that the increase in the mass loss rate from the companion star pushes the emission region back toward the pulsar, and more fraction of the pulsar wind is stopped by the shock, resulting an increase in the X-ray emissions from the system. The momentum ratio (η) of the stellar wind and the pulsar wind is η ~ (Ṁwvwc/Lsd) ~ 1(Ṁw/1016 g s-1)(vw/108 g s-1)(5∙Lsd/1034 erg s-1)-1, indicating the intra-binary shock stands at a distance Rs ~ a/2 ~ 5×1010 cm from the pulsar if the mass loss rate of the stellar wind after 2013 late-June increases to Mw ~ 1016 g s−1.
We expect that a strong shock forms if the magnetization parameter is smaller than or comparable to unity σ(Rs) ≤ 1 and the shocked pulsar wind particles form a power law distribution described by f(γ) = Kγ−p. The maximum Lorentz factor (γmax) is determined from the condition for which the particle acceleration time scale tac ~ γmaxmec/eB is equal to the synchrotron radiation loss timescale, τsync ~ 9m3ec5/e4Bγmax, where B is the magnetic field just behind the shock.
The minimum Lorentz factor and the normalization factor are calculated from the two conditions that ∫ f(γ)dγ=ζLsd/[4πΓPW (rs)rs2mec3(1+σ(rs))] and ∫γf(γ)dγ=ζLsd/[4πrs2c(1+σ(rs))], where rs is the radial distance to the shock from the pulsar, ζ is the fraction of pulsar wind stopped by the shock and ΓPW is the Lorentz factor of the bulk motion of the pulsar wind. With a simple one-dimensional model, we solve the distribution of the pulsar wind particles with the cooling processes via adiabatic expansion and radiation losses. The synchrotron radiation and the inverse-Compton radiation process from the shocked pulsar wind can be calculated.
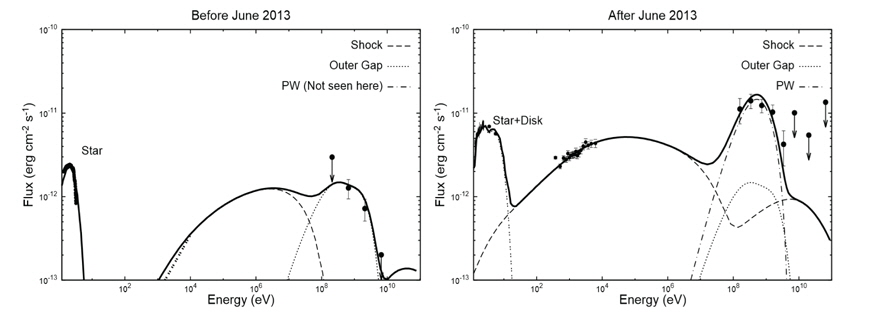
Fig. 11 summarizes the results of the model fitting for the observed emissions before (left panel) and after (right panel) 2013 late-June. The dotted, dashed and dasheddotted lines are the calculated spectra for the emissions from the outer gap (see Wang et al. 2010 for a detailed calculation), shocked pulsar wind and the cold-relativistic pulsar wind, respectively. The double-dotted line in the right panel shows the predicted spectrum of optical/UV emissions with the current model of the accretion disk. The flux predicted by inverse-Compton process of the coldrelativistic pulsar wind before 2013 late-June is of order of ~ 10−13 erg cm−2 s−1 and its spectrum is not shown in the figure. As we can see in the figure that the observed GeV emissions after 2013 late-June can be explained well by the inverse-Compton scattering process of the cold-relativistic pulsar wind off the soft photons from the disk.
The matter evaporated from the disk will smear out the pulsed radio emissions from the neutron star via scattering and/or absorption, if the local plasma frequency is greater than the frequency of the radio wave. Assumed that the disk matter below Rc ~ 3 × 109 cm are evaporated by the gammarays, one may estimate the local plasma frequency at the scattering region as (ωp/2π)~ 6GHz(Ṁd/1016 g s-1)1/2 (vd,w)/108 cm s-1)-1(Rc/3∙109)-1, where (Ṁd) is the evaporation of the disk matter, and vd,w is the velocity of the evaporated matter. This suggests that the matter evaporated from the disk smears out the pulsed radio emissions up to a frequency of several GHz, which is consistent with observations that no radio pulsation has been detected below 5 GHz during the accretion active state. In this scenario, the rotationpowered MSP is still active. While detecting the pulsation can be difficult, radio imaging can still be used to check the aforementioned scenario as such technique is not hampered by the complicated environment. Also, as the local charge density can possibly be increased by the aforementioned processes, if the observed frequency is below the local plasma density, this can lead to a non-detection even with imaging. In view of this, a high frequency radio imaging observation is encouraged to confirm/refute this alternative scenario.
Apart from PSR J1023+0038, we have also investigated γ−ray properties of other redbacks MSPs, including PSR J1723-2837 (Hui et al. 2014). PSR J1723-2837 has its radio and optical properties been recently reported (Crawford et al. 2013). The dispersion measure suggests it locates at a distance of 0.75 ± 0.10 pc (Crawford et al. 2013). Its rotational period and orbital period are 1.86 ms and 14.8 hr, respectively. The spin-down luminosity of the pulsar is estimated as Ė= 4.6×1034 erg s−1. The mass of its companion lies in a range of 0.4−0.7M⊙ and optical spectroscopy indicates it is a G-type star. The pulsar follows a nearly circular orbit. The eclipse of radio pulses takes ~ 15% of the orbit which is twice the Roche lobe size inferred for the companion (Crawford et al. 2013).
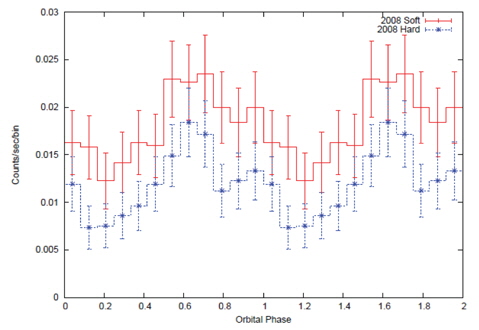
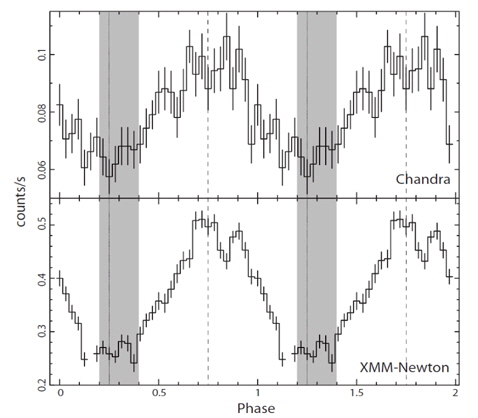
We have searched for its orbital modulation in X-ray by using the data obtained by XMM-Newton and Chandra (Hui et al. 2014). Using the radio ephemeris for PSR J1723-2837 (Tab. 2 in Crawford et al. 2013), we folded the background backgroundsubtracted light curves at the orbital period. The X-ray modulation can be clearly seen by both telescopes (Fig. 12).
For constraining the INFC and superior conjunction (SUPC) spectral shape, we have performed a phase-resolved spectroscopy by simultaneously fitting the spectra obtained by XMM-Newton and Chandra in these two intervals. The cross-calibration was accounted by allowing the normalizations to be different for these two telescopes. Assuming NH is variable at different orbital phases, we obtained , and ×1021 cm-2, ΓX = 1.05±0.08 for INFC and SUPC respectively. The spectral parameters inferred in these phase intervals can be reconciled within 2σ uncertainties. We have also explored the possibility that there is no significant variation of NH across the orbit. We jointly fitted individual powerlaw model to the INFC and SUPC spectra with NH in the individual model tied together. This yields ×1021cm-2 and , for INFC and SUPC respectively. The photon indices in these two intervals are consistent within 1σ uncertainties. Therefore, we do not found any conclusive evidence of the spectral variation across the orbit.
The observed X-ray photon index ΓX ~ 1.2 may imply the power law index of the particle distribution at the shock is p ~ 1.4. For the usual power law index p ~ 2 − 2.5 of the shock acceleration, this hard photon index in the spectrum will be reproduced if the typical synchrotron energy (E1) of the minimum Lorentz factorΓ1 is larger than 10 keV. The photons index changes from α = (p + 1)/2 above E1 to α = 3/2 below E1. In such a case, the X-ray emission properties break the degeneracy of σ and Γ1 in the emission model. For example, we can fit the observed properties α ~ 1.2 and fx ~ 1.3×10⁻¹² erg cm−2 s−1 with (σ, Γ1) ~ (0.1, 5×10⁴). The predicted Lorentz factor Γ1 ~ 5 × 10⁴ is similar to those of the original black widow pulsar PSR B1957+20 (Wu et al. 2012). As there is no evidence of spectral break found in 0.3-10 keV, observations with state-of the-art hard X-ray telescopes, NuSTAR and the upcoming Astro-H will be important for constraining E1.
Because PSR J1723-2837 follows an almost circular orbit, the shock distance from the pulsar does not vary across the orbit, suggesting the spectral properties of the intrinsic shock emissions do not modulate with the orbital phase. The variation of the observed flux will be caused by either Doppler boosting effect with a mildly relativistic flow of the shocked flow or physical eclipse of the emission region. However, these two effects will not produce a significant variation in the spectrum. The observed amplitude (see Fig. 12) implies the Doppler factor is ~ 1 − 2, which does not cause a significant change in the spectral shape. Furthermore, the synchrotron cooling time scale of the particles that emit photons of energies < 10 keV is τs ~ 33(B2/10G)−3/2(Es/10keV)−1/2 s, which is longer than the crossing time scale of the emission region, τc ~ 1s. The distribution of the particles and therefore the spectral shape of X-ray emission in < 10 keV does not evolve in the emission region. As a result, even if the partial region of the emission region is covered by the star, the observed spectral shape is the same with that for whole emission regions.
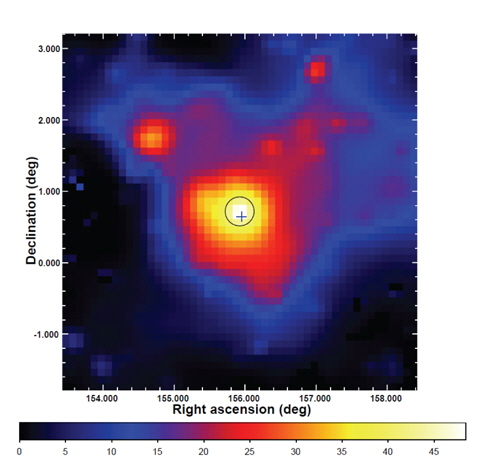
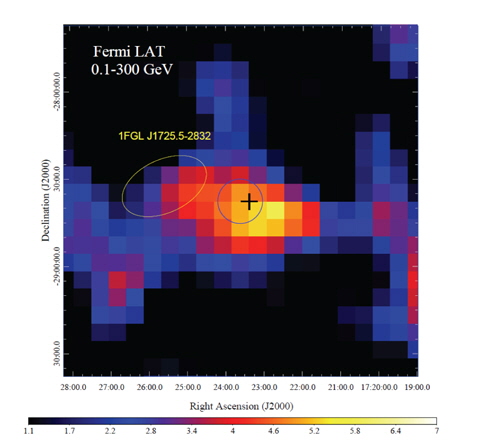
We have also searched for the γ−ray emission from PSR J1723-2837 with Fermi LAT (Hui et al. 2014). We have detected the γ−ray emission in 0.1 − 300 GeV from this system at a significance of ~ 6σ for the first time (see Fig. 13). The γ−rays in this energy range consumes ~ 2% of the spin-down power and can be modeled by a power-law with a photon index of ~ 2.6. A nearby source in the first Fermi catalog (Abdo et al. 2010a), 1FGL J1725.5-2832, is only ~ 1◦ away from PSR J1723-2837 (see Fig. 13). We studied their relation by adding 1FGL J1725.5-2832 to the background source model that had been used in the aforementioned analysis. It turned out that essentially the same group of photons contribute to the TS values of both sources. Therefore, we treat 1FGL J1725.5-2832 to be the same γ-ray source associated with PSR J1723-2837. Neither the γ-ray periodicity related to the orbital period nor the rotation period was found. Together with this discovery, all the redback MSPs have found in the Galactic field so far are all γ−ray emitters (Hui et al. 2014).
For black widow/redback pulsars, the magnetospheric emissions and pulsar wind emissions produce the GeV gamma-rays. For the original black widow pulsar PSR B1957+20, Wu et al. (2012) suggested both the magnetospheric and the pulsar wind emissions contribute to the GeV emissions seen by Fermi. With the results we have obtained, it is unclear which process operates for the observed gammarays for PSR J1723-2837, because neither pulsar’s spin period nor orbital modulation was founded in the current Fermi data, and whether or not there is a cutoff in the spectrum is inconclusive. A single power-law feature in the observed spectrum in 0.1–300 GeV band would suggest that the gamma-rays are emitted by the pulsar wind particles accelerated at the shock. In this case, the synchrotron radiation process explains the observed emissions around 100 MeV and the inverse-Compton process off the stellar photons contributes to the emissions above ~ 10 GeV.
The shocked particles that emit the synchrotron photons will produce TeV photons through the inverse-Compton off the stellar photons, for which the effective temperature is Teff ~ 4800 − 6000K. Based on the calculation with the isotropic photon fields, we can estimate the flux above > 100GeV as F>100GeV ~ 5 × 10⁻¹³ erg cm−2 s−1, which could possibly be measured by the planned Cherenkov Telescope Array (CTA). The measurement of the CTA on the redback systems will provide us additional information such as Lorentz factor of the relativistic pulsar wind and the maximum Lorentz factor of the shocked particles, etc.
Thanks to Fermi LAT, the number of MSPs found in our Milky Way is growing rapidly in the last few years. Surveying high latitude unidentified γ−ray sources has been demonstrated to be a very productive means of discovering new MSPs. The locations of these Unidentified Fermi Objects (or UFOs) essentially provide a “treasure map” for the pulsar hunters to constrain a relatively small region of sky for digging. As an example for this game of “MSP hunting”, in the following, I give a review on our multiwavelength identification of MSPs from the Fermi-LAT first source catalog (1FGL; Abdo et al. 2010a). In this search, we have successfully discovered an unidentified source 1FGL J2339.7-0531 as a new redback MSP (Kong et al. 2012).
For identifying the promising MSP candidates, we first selected UFOs from 1FGL based on the following criteria:
1. Temporal variability;2. Galactic latitude, and3. γ-ray spectral shape.
We used the variability index in the 1FGL catalog to characterize source variability. Gamma-ray pulsars have always been found to be steady sources of gamma-ray emission (Abdo et al. 2010a, 2010b). This property can therefore be used to help identify which of the unidentified sources are probably pulsars. The 1FGL catalog defines a variability index, for which a value greater than 23.21 means that there is less than a 1% probability of being a steady source. We therefore selected sources with a variability index less than 23.
MSPs are in general older than energetic γ-ray pulsars. Young objects like energetic γ-ray pulsars (τ < 1 Myr) are likely located in the Galactic plane, while a fraction of MSPs should be at higher Galactic latitudes. We thus selected Fermi sources with high Galactic latitudes (|b| > 40◦). The choice of this value is based on Monte-Carlo simulations for the Galactic population of MSPs, which show that no energetic γ-ray pulsar exists above |b| = 40◦ (Takata et al. 2011).
Finally, we identified potential candidates from the gamma-ray spectra. Although only a power-law spectrum is listed in the first-year catalog, it also has a curvature index to indicate how good of a power-law fit. For γ-ray pulsars, their γ-ray spectra is usually described by a power-law plus an exponential cutoff model (Abdo et al. 2010b). According to the 1FGL catalog, the curvature index, for which a value greater than C = 11.34 indicates less than 1% chance that the power-law spectrum is a good fit. Hence we chose objects with a curvature index larger than 12.
If a 1FGL source satisfied all four criteria, we shortlisted as a potential candidate. From the short list, we further searched for X-ray imaging data (Chandra, XMM-Newton and Swift) from public archive and looked for X-ray sources within the γ−ray error circles as the first step for multiwavelength investigation.
1FGL J2339.7-0531 has been observed by Chandra and Swift. Within the 95% error circle of Fermi, there is only one relatively bright X-ray source in both observations. The brightest X-ray source (CXOU J233938.7-053305)near the center of the error circle has an X-ray flux of 3×10⁻¹³ ergs s−1 cm−2 (0.3–10 keV) based on a spectral fitting using an absorbed power-law with a best-fit photon index of 1.1 (based on the Chandra observation). This indicates that the ratio between the X-ray and γ-ray (> 100 MeV) flux (Fγ ~ 3 × 10⁻¹¹ ergs s−1 cm−2) as measured by Fermi (Abdo et al. 2010a) become FX/Fγ ~ 0.01, which is consistent with typical observed values for γ-ray pulsars. It is worth noting that there are 9 much fainter Chandra sources in the error circle and their X-ray-to-γ-ray flux ratios are less than 0.1%. Although we cannot totally rule out their association with the gamma-ray source, such a low flux ratio is not typical. We therefore identified CXOU J233938.7-053305as the potential X-ray counterpart to 1FGL J2339.7-0531.
Within the Chandra error circle (0.6 arcsec at 90% level) of CXOU J233938.7–053305,there is a R ~ 19 star from the USNO catalog (Monet et al. 2003). The same optical source is also seen in the SDSS Data Release 8 images as SDSSJ233938.74-053305.2 with u' = 20.85, g' = 19.0, r' = 18.61, i' = 18.25, and z' = 18.23, as well as in the GALEX images with NUV=22.88 (177– 283 nm). Swift/UVOT observations taken simultaneously with the X-ray observations detected the source with U = 19.58, B = 19.53, and V = 18.88.The X-ray-to-optical flux ratio (390) is much too high for a foreground star and an AGN (e.g., Green et al. 2004, Laird et al. 2009). Moreover, the spectral energy distribution from UV to optical indicates that it is unlikely to be an AGN (e.g. Richards et al. 2002). Instead, it looks like a F- or G-type star. In a separate paper (Romani & Shaw 2011), they show via optical spectroscopy that the stellar object is consistent with a late-type star. We also had a long-term optical monitoring program with the MITSuME 50cm telescope (Kotani et al. 2005) located at Akeno Observatory in Japan from 2010 September to 2010 November. MITSuME equips with a tricolor camera that can perform simultaneous imaging in the g', R, and I bands. Observations from all three bands show noticeable variability. Based on the above observations, we believe that the γ−ray/X-ray source is likely a binary system with optical emission from the irradiation of the companion star, while the compact object is responsible to the X-ray and γ−ray emission.
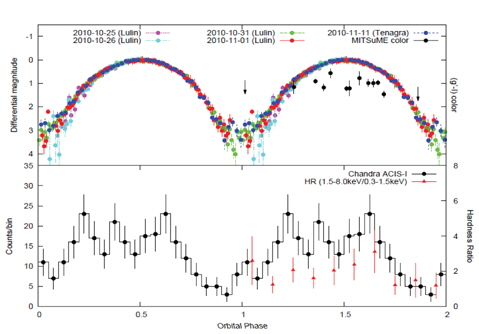
We have also carried out an intensive optical monitoring campaign using the 1m telescope at the Lulin Observatory in Taiwan and the 0.8m Tenagra Telescope in Arizona. By using the Lomb Scargle periodogram on the combined optical data, we have found a period of 4.6342(9) hours. Fig. 14 shows the folded light-curves of all the optical data (upper panel) and Chandra data (lower panel) at a period of 4.6342 hours. The phase zero is chosen at MJD 55500. In addition, we folded the optical colors (g'−I) obtained with MITSuME and X-ray hardness ratio (1.5–8keV/0.3–1.5keV) at the same period.
This system resembles the other aforementioned MSPs. The large orbital variation as seen in its optical lightcurve can be caused by the irradiation produces strong heating on the companion facing the pulsar. It is therefore suggestive that the companion is being evaporated by the high-energy radiation from the pulsar. Also, its X-ray/γ−ray properties are similar to that of PSR J1023+0038. Hence, we suggest that 1FGL J2339.7-0531 is a new MSP.
Interestingly, this object can also be nice target for keen amateurs. The aforementioned orbital modulation in optical regime shows that it swings from classes F (on the irradidated side) to M in ~ 2 hrs. Its peak magnitude is just below ~ 18 and it is optically the brightest pulsar-heated binary known so far. Also, this source can be easily found as it locates ~ 3' west of a 7.6 mag star (HD 222358). Therefore, any telescopes with a size larger than 10-inch and equipped with a sensitive CCD camera should be able to detect its blinking companion in one single observation! Who say that the joy of MSP hunting is only for professionals?