Most of the charged particles present in the inner magnetosphere of the Earth are trapped by the earth’s background magnetic field while they can drift across the magnetic field. The best example is the radiation belt particles, which are believed to be accelerated by global and local processes such as radial diffusion and wave-particle interactions. Equally important is the fact that such energetic particles do not necessarily remain trapped, and there is often loss of particles into the solar wind and the atmosphere (Millan & Thorne 2007). What spacecraft measure is therefore a net flux determined from a sensitive balance between acceleration (or source) effect and loss results (Horne & Thorne 2003, Green & Kivelson 2004, Shprits et al. 2009, Kim et al. 2011).
Loss into the solar wind by the magnetopause shadowing effect is now a well-established mechanism (Lyons et al. 2005, Bortnik et al. 2006, Shprits et al. 2009, Ukhorskiy et al. 2006, Ohtani et al. 2009, Kim et al. 2008, 2010, 2011, Turner et al. 2012, Hwang et al. 2013). This is particularly effective at higher L region, and can affect the phase space density even at lower L region (Lee et al. 2013). The related research is now at a stage for more elaborated quantitative assessment of this mechanism for a realistic situation. Another competing, more classical, mechanism for loss is the atmospheric precipitation when the trapped particles fill into loss cone. Wave-particle interaction is a most probable mechanism for loss cone filling in the radiation belt region (Horne & Thorne 2003, Green et al. 2004, Millan & Thorne 2007, Millan et al. 2007). Various waves have long been proposed and examined, including whistler chorus, plasmaspheric hiss, and electromagnetic ion cyclotron waves (Millan & Thorne 2007, Summers et al. 2007, Lam et al. 2010).
The atmospheric precipitation effect is hard to determine observationally near the magnetospheric equator since the loss cone angle there is extremely small, too small to be resolved by any realistic particle detectors. Since the loss cone angle becomes wider toward the Earth, low altitude satellite measurement of precipitating particles can be useful, although this means coverage of a very small pitch angle range around zero degree when mapped to the magnetospheric equator. Also, compared to deep spaceoperating, usually very limited number of, magnetospheric satellites, far faster-orbiting low-altitude satellites are much more advantageous in resolving time and spatial features of precipitation particularly when multiple satellites are available covering different MLT zones (Lam et al. 2010).
It is well known that, given a specific type of wave, wave-particle interaction is dependent on various factors including particle energy and pitch angle, particle species, geomagnetic activity level, etc. The specific details of such dependence are critical for understanding the precipitation loss process and are an area of currently intense investigation by many researchers. For a general review of this topic, the readers are referred to the recent comprehensive review paper by Shprits et al. (2008). Also there are some previous studies related to the dependence of wave-particle interaction effects on geomagnetic activity level (e.g., Lam et al. 2010, Li et al. 2010). In this paper we aim to examine the dependence of precipitation on the electron energy as well as the Kp index as a geomagnetic index. For the energy dependence, we choose to examine the precipitating electron fluxes at three energies, E1 => 30 keV, E2 => 100 keV, and E3 => 300 keV. For the Kp dependence, to allow a wide range of Kp values, we identified 84 storms with various intensity, during which we statistically examined the electron precipitation data. Our main goal is to examine the sensitivity of the precipitating electron fluxes of different energies to Kp changes, and to the authors’ knowledge this kind of viewpoint has not been suggested before.
We used the electron data from the Medium Energy Proton and Electron Detector (MEPED) onboard the NOAA Polar Orbiting Environmental Satellites (POES) low-altitude satellites. The NOAA POES satellites operate in a near-polar orbit at ~800 – 850 km altitudes, the orbital period of which is ~100 minutes, providing simultaneous measurements of both precipitating and trapped electrons (Lam et al. 2010, Rodger et al. 2010). Here we used the data from five of the POES satellites, NOAA-15, NOAA-16, NOAA-17, NOAA-18 and NOAA-19. One caveat that one should keep in mind is the fact that the POES MEPED instrument only observes 30 degrees field of view centered on ~0 degree local pitch angle. Since the loss cone at the POES altitude is ~60 degrees wide in local pitch angle, the instrument only observes precipitating fluxes deep in the loss cone, and thus being a good indicator of strong diffusion. In addition, the electron data from the MEPED instrument is known to often suffer from contamination by protons. We used the electron data after correcting this proton contamination (Lam et al. 2010, Rodger et al. 2010).
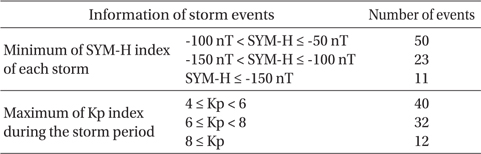
We identified a total of 84 storm events between 2001 and 2012 using the SYM-H index. The selection criteria are (i) the SYM-H minimum value≤ -50 nT, (ii) the main phase is well defined and (iii) the time of SYM-H minimum value is clearly identified. The basic statistics of the storms are summarized in Table 1.
[Table 1.] Summary of the basic statistics of the storm events studied in this paper.

Summary of the basic statistics of the storm events studied in this paper.
3. OBSERVATIONS AND INTERPRETATION
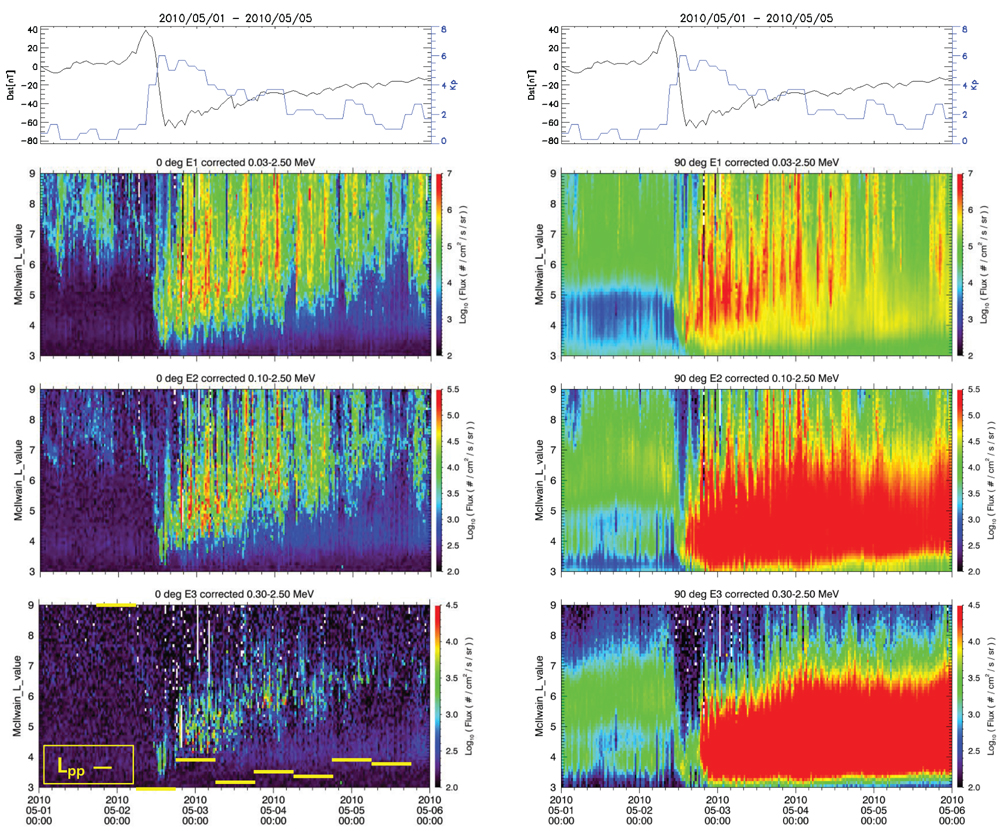
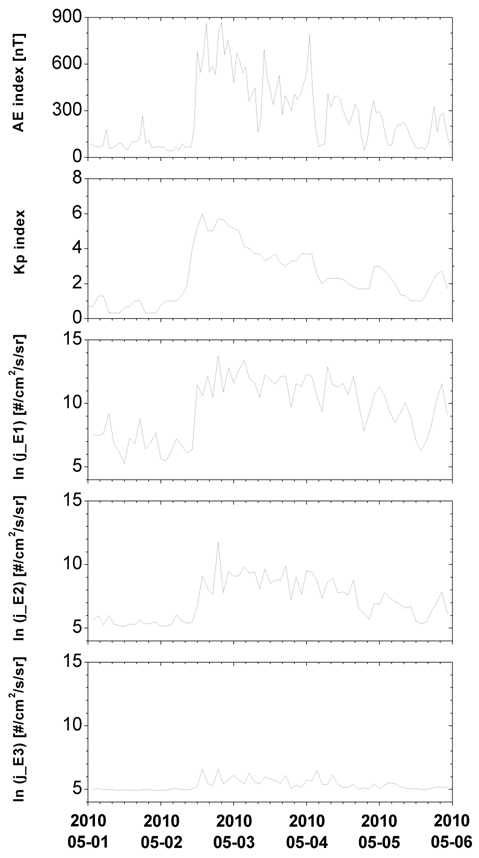
One example is shown in Fig. 1 to demonstrate the observations on the NOAA-POES low-altitude satellites of both the precipitating and trapped electrons as shown in the left and right columns from the second row, respectively. The electron observations are shown for three energies, E1, E2, and E3, from the second row. The top two, equivalent, panels show the Dst and Kp indices for a five day period from 1 May 2010, indicating an occurrence of a magnetic storm with a mild intensity (the minimum = -64 nT) and a corresponding increase of Kp (the maximum = 6).
The trapped electron fluxes in Fig. 1 indicate significant variations. At the energy E3, the well-known flux dropout during the storm main phase can be identified, which is by a factor of ~10 at L> ~5. A similar dropout may be suggestive, but is much less clear for lower energies. The fluxes enhance during the storm recovery phase significantly. For example, the increase at E3 is far more than factor 10 as compared to the prestorm flux level. These are well known features, the explanation of which generally requires acceleration by wave-particle interaction as well as the Dst effect (Kim & Chan 1997).
The precipitating electron fluxes in Fig. 1 indicate that the enhanced atmospheric precipitation occurred throughout the storm period, both the main and recovery phases, while there was some mild precipitation particularly at E1 and E2 even before the storm began, likely due to scattering interaction with plasmaspheric hiss. Our visual inspection tells that the storm time precipitation was most intense near the Dst minimum (equivalently the Kp maximum) point and early time of the storm recovery. Also, the precipitation occurred mostly outside the plasmasphere, the outer boundary, plasmapause, location of which, Lpp, is indicated by the yellow bars at the bottom-left panel. The Lpp was determined by using the plasma density observations on the THEMIS-A satellite (Angelopoulos 2008, Lee et al. 2011, Lee et al. 2013). This implies that the storm time precipitation was due to waves activated or amplified outside the plasmasphere (Horne & Thorne 2003).
Fig. 2 demonstrates more clearly the relation between the electron precipitation and the Kp index for the same interval as in Fig. 1. Along with the Kp index at the top panel, the remaining three panels show the precipitating electron fluxes as averaged over L=2 to 8 for each one full orbit of the NOAA-POES 16 satellite separately for three energies. This simple treatment clearly shows that the precipitation begins approximately when Kp increases. The timescales of the precipitation are likely different for different energies, which we cannot judge unambiguously here, and a more comprehensive work on the subject is under progress as a separate project, and the results will be reported elsewhere. Also, the precipitation effect declines at a less steep rate than does the Kp index after its peak. In other words, the precipitation effect is more persistent than what can be anticipated from the Kp decline. The AE index shown in Fig. 2 declines after its initial peaks but remains above 300 nT for substantial times of the next few days while Kp declines more significantly for the same days. The AE value of ~300 nT is significant, implying substorm injections of source electrons. Based on this, we speculate that there was a continuous supply of source particles that can excite waves responsible for electron scattering for some time even after the Kp decline, which perhaps is not well reflected in the Kp index itself.
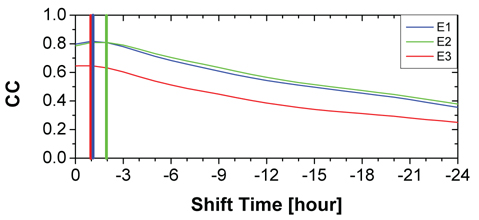
We find that the main features shown in Figs. 1 and 2 are common for all of the 84 storm events that we have studied for a statistical result. Next we tested the correlation of the precipitating electron fluxes with Kp as a function of time delay for the 84 storms. For the sake of convenience, the electron fluxes were orbit-averaged over L=2 to 8, as in Fig. 2, which were done for the period from
A word of caution is necessary here in accepting the result in Fig. 3. We have determined the correlation coefficients by time-shifting backward by an hour step from the measurement time of the averaged electron flux. Since the Kp values are given at 3 hours resolution, the association between the electron flux event and Kp was made by using the Kp value closest to the time shifted from the electron measurement time. In this sense, the hourly resolution in the shift time in Fig. 3 was realized only partially. Nevertheless, based on the overall trend of the correlation curves in Fig. 3, it is not unreasonable to say that the best correlation time delays lie well within roughly 3 hours.
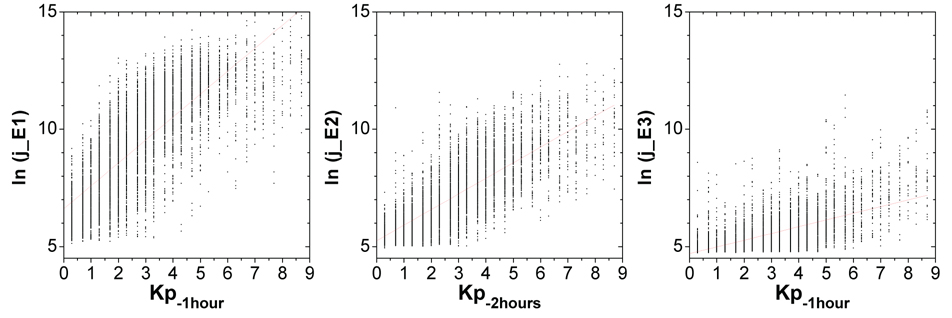
Using the Kp values determined at the delay times of the best correlation, Fig. 4 shows the scatter plot of the precipitating electron fluxes as a function of Kp and the linear fits to the logarithmic fluxes. The fit parameters are summarized in Table 2. Again, the electron flux data points used here are orbit-averaged ones throughout each storm time of the 84 events. The results are quite interesting, indicating that the precipitating electron flux increases with Kp“at a steeper rate” for lower energies than for higher energies. Note that by this statement we do not mean to compare the absolute values of the flux levels among different energies. Also as the present technique is based on each orbit-averaged flux data points, we do not intend to make a comparison between storm times and prestorm times. Rather we pay attention to the sensitivity of the flux level to Kp changes, as revealed by the slopes of the fit curves. This is the main result of this paper. This means that the lower energy electron precipitation is more sensitively responsive to Kp changes. If Kp is a reasonable indicator for excitation of plasma waves, the result in Fig. 4 clearly implies that the interaction of electrons with such a wave (or waves) hidden in Kp is“highly” energy-dependent. Therefore it likely implies that Kp is a limited indicator for plasma wave excitation conditions in the sense that it may reflect only waves of a particular type that is interactive preferably with lower energy electrons. Of course, what we mean by“interaction” here is scattering of electron pitch angle leading to the atmospheric loss cone precipitation, for which we have used here the NOAA POES satellite observations. A use of the same word in a broader sense would lead to a more complex implication of the result in Fig. 4, which we prefer to discuss in a future follow-up work.
[Table 2.] Fit parameters for In (electron flux) = aKp+b.
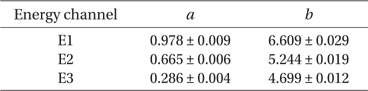
Fit parameters for In (electron flux) = aKp+b.
Here we provide discussion on a few issues related to the results above. First, we have shown that Kp level is clearly associated with the amount of electron precipitation, the association being tighter for lower energy electrons. However our argument about the energy dependence is rather limited by the fact that we have used the electron data for three integrated energy range rather than narrow energy bands. Also, in this paper, we did not attempt to clarify specifically which plasma waves are responsible for the electron precipitation for a given energy. But, based on the fact that the precipitation was dominantly observed outside the plasmasphere, we preclude the possibility of whistler hiss waves. We rather expect that a most likely candidate wave for lower energy is whistler chorus. For higher energy we expect that electromagnetic ion cyclotron (EMIC) waves play a larger role in scattering the electrons into loss cone. These are consistent with the preliminary results of our separate work to identify specific waves associated with electron precipitation.
Since Kp shows a tighter correlation with the lower energy precipitation, this may imply that Kp reflects excitation of whistler chorus to a larger extent than EMIC that may instead be better described by another geomagnetic index. Indeed, it is an interesting question if one can identify a set of geomagnetic indices, each of which is best correlated with a plasma wave of a different type. Our future work will include a test of such an idea using other indices likes Dst and AE. If this conjecture turns out to be correct, then the result will be useful for the purpose of developing a model for radiation belt dynamics where one may use different geomagnetic indices depending on specific types of plasma waves.
In conclusion, we find that the atmospheric precipitation of electrons observed at low altitudes is Kp-dependent, the degree of which is in turn highly energy-dependent. This imposes a range of usefulness of Kp in reflecting waves responsible for scattering of the magnetospheric electrons in various energy levels.