The electron density irregularities in the ionosphere cause diffraction of the radio waves that can be responsible for scintillation, fading, and disruption of the propagating signals. For this practical importance, significant efforts have been made to establish information on the occurrence climatology of such irregularities, to understand the onset conditions of such irregularities, and to predict or avoid the impact of these irregularities on the society. While the irregularities occur in all latitudes, less attention has been paid to irregularities in the middle latitudes. This may be because irregularities in the middle latitudes are not as severe as those in other latitude regions. However, the middle latitudes are also the place where various forms of irregularities cause radio scintillations.
During the last five decades, coherent backscatter radars have been widely used to probe electron density irregularities in the equatorial region (e.g., Ragharavao et al. 2002, and references therein), in middle latitudes (e.g., Yamamoto et al. 2005, and references therein), and in the auroral region (e.g., Haldoupis et al. 1993, and references therein). A mono-static coherent scatter radars detect the radio waves that are scattered by the medium under observation. These backscattered signals correspond to the Bragg wavelength component of the fluctuations in the refractive index of the medium caused by the ionospheric electron density irregularities. In a mono-static radar, the Bragg wavelength is half of the radar wavelength. The properties of the irregularities are assessed according to the strength, Doppler velocity, and spectral width of the echoes. Anisotropic motions of plasmas associated with magnetic field cause the elongation of the irregularities along the magnetic field lines. For this reason, ionospheric electron density irregularities are often called Field-Aligned-Irregularities (FAIs). Very High Frequency (VHF) radars have been used to detect meter-scale FAIs in the E and F regions.
In middle latitudes, radar probing of FAIs started with the observation of sporadic E (Es) at an altitude of ~105 km with a portable 50-MHz radar on the island of Guadeloupe in French West Indies (Ecklund et al. 1981). Our understanding of the middle-latitude irregularity phenomenon was enriched by the observations of the Middle and Upper atmosphere (MU) radar at Shigaraki (34.89°N, 136.10°E, 29.3°N dip latitude) in Japan (Fukao et al. 1985a,b). From MU radar observations, Yamamoto et al. (1991) identified the existence of two types of echoes in the middle-latitude E region: “quasi-periodic (QP)” and “continuous” echoes. QP echoes occur intermittently with periods of 5–10 min above 100 km altitude in the post-sunset period. Continuous echoes indicate continuous echoes in time and appear in the altitude interval of 90–100 km in the post-sunrise period. The occurrence rate of QP echoes shows a distinct seasonal variation, with a maximum during the northern summer months. Normally, the occurrence rate of QP echoes increases abruptly after sunset and decreases after midnight (Yamamoto et al. 1992).
Woodman et al. (1991) suggested that E-region QP echoes can be created by the modulation of the Es layer by atmospheric gravity waves. Tsunoda et al. (1994) extended the theory of Woodman et al. (1991) and suggested that polarized electric fields produced by spatial modulation of the Es layer by gravity waves are responsible for the QP echoes. The Sporadic-E Experiment over Kyushu (SEEK) (e.g., Fukao et al. 1998, Yamamoto et al. 1998) and SEEK-2 (e.g., Saito et al. 2005, Yamamoto et al. 2005) were conducted at Kyushu in Japan to investigate the relationship between QP echoes and Es layers. The campaign results showed that polarization electric fields and QP echoes were induced in association with the Es layer. In addition, the whole set of E-region structures were seen to be controlled by polarization electric fields mapped upward along geomagnetic field lines. Otsuka et al. (2007) reported that the electric fields associated with the F-region medium-scale traveling ionospheric disturbances (MSTIDs) could be closely coupled to the electric fields associated with QP echoes in the E region.
Several studies have investigated F-region irregularities in middle latitudes using radars in Japan (Fukao et al. 1988, 1991, Otsuka et al. 2009, Saito et al. 1998, 2002, 2008) and Puerto Rico (Swartz et al. 2000). Because the investigation of the F-region FAIs has been done as an event or on a campaign basis, the characteristics and distribution of the F-region FAIs have not yet been established. QP-type variation of the echo intensity has also been observed in the F region (Fukao et al. 1988), but we do not know yet how frequently QP-type echoes occur in the F region. Perkins instability is suggested as the source of the FAIs in the middle-latitude F region (Behnke 1979, Perkins 1973). However, Kelley & Fukao (1991) argued that the growth rate of the Perkins instability is too small to explain the observed FAI strength and suggested that seeding by gravity waves is necessary. From the observations of FAIs and the 630 nm airglow intensity over Arecibo in Puerto Rico, Miller et al. (1997) identified the development of F-region FAIs in association with gravity wave seeding. Fukao et al. (1991) noticed the occurrence of F-region FAIs accompanied by MSTIDs whose wavelength was of several hundred kilometers. Both MSTIDs and FAIs frequently occur over Japan at nighttime during summer (Saito et al. 2002). Otsuka et al. (2009) reported simultaneous observations of MSTIDs and FAIs in the F region using an all-sky imager and MU radar. Spatial modulation of plasma density by MSTIDs induces polarization electric fields, by which plasmas drift vertically and develop FAIs (Otsuka et al. 2009).
MU radar is the major data source of the FAIs in middle latitude, but the radar has been operated on a campaign basis. Intermittent radar observations are not sufficient for the investigation of the characteristics, occurrence climatology, and driving mechanisms of middle-latitude FAIs. A 40.8 MHz VHF radar was built at Daejeon (36.18°N, 127.14°E, 26.7°N dip latitude) in South Korea aiming at continuous monitoring of middle-latitude FAIs in the Far East Asian sector. The radar has been continuously operated since December 2009. For the purpose of introducing the Daejeon VHF radar and its capability to the community, we report initial results obtained between 29 December 2009 and 28 June 2010. This period corresponds to the period of the solar minimum. We present various forms of echoes in the E and F regions observed by the Daejeon radar and discuss the similarities and differences between the E- and F-region FAIs observed by the Daejeon and MU radars.
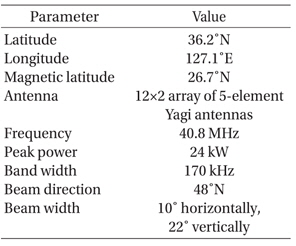
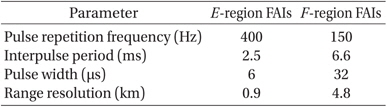
The Daejeon VHF radar is operated at a frequency of 40.8 MHz and with a peak transmitting power of 24 kW. The basic parameters and the technical specifications of the radar are listed in Table 1. The antenna system, occupying an area of 85 × 40 m, is a phased array of 12 × 2 five-element Yagi antennas. To detect the coherent backscatter from the E- and F-region irregularities, the radar beam is oriented at a 48° zenith angle due magnetic north, which satisfies the field perpendicularity condition at the E- and F-region heights. Half-power full beam widths in azimuth and zenith directions are 10° and 22°, respectively. Table 2 lists the observational modes for the E- and F-region FAIs. The radar has been operating on a routine basis, sampling the E and F regions for one minute. The inter-pulse periods for the Eand F-region experiments are 2.5 and 6.6 ms, respectively, and the pulse widths are 6 and 32 μs, respectively. The range resolutions of the VHF radar measurements for the E and F regions are 900 m and 4.8 km, respectively. The E- and F-region FAIs detected by the 40.8 MHz radar correspond to a scale size of 3.68 m (half wavelength of the transmitted pulse).
Our VHF radar consists of a transmitter, transceiver, and two-computers for analysis and acquisition. Raw data is acquired at 14 bit sampling resolution and ±2V input range. The complex time series of the decoded and integrated raw data signal samples are subjected to the process of fast Fourier transform for on-line computation of the Doppler power spectra for each range bin of the selected range window. The processing of these Doppler power spectra involves the removal of DC, the estimation of the average noise levels, the removal of interference, incoherent integration, and the computation of the three low-order moments. As a method of post-analysis for the raw data, Ionospheric Doppler Beam Steering (IDBS) analysis provides estimates of the Doppler velocity, spectral width, signal-to-noise ratio (SNR), and power for a number of transmitted beam directions. IDBS analyzed data are written to a Solid State Drive disk in a binary format. During continuous data acquisition, each analyzed data file begins at 00:00 universal time (UT).
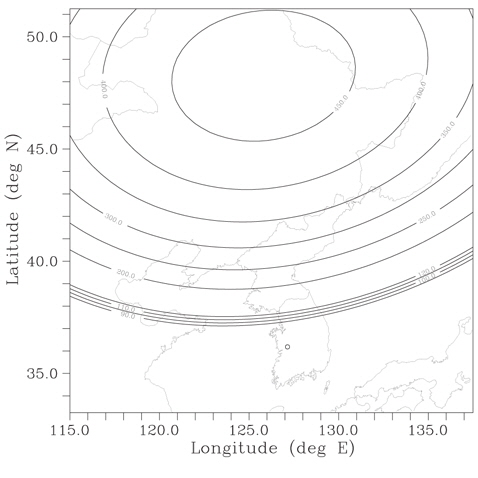
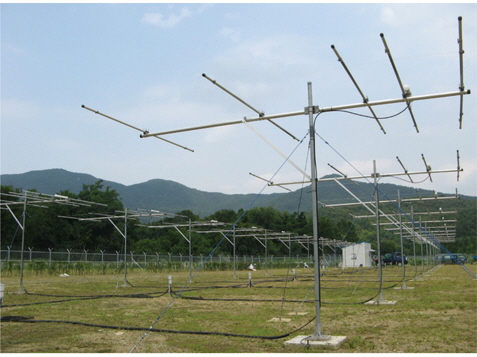
Fig. 1 shows the view of the radar site. Fig. 2 illustrates the geometry of the radar experiment. The location of the radar is marked with a small circle. The horizontal curves with vertical height information show the loci where the radar ray paths are perpendicular to the geomagnetic field at various E- and F-region altitudes, assuming straight-line ray propagation paths.
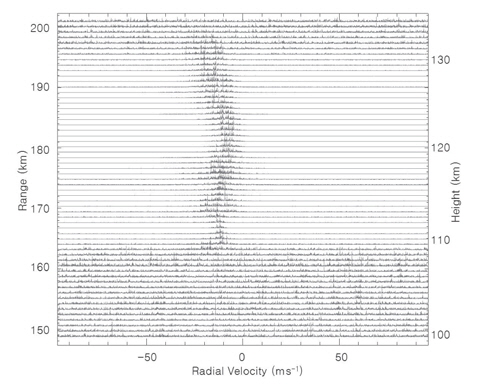
Using During the initial observations from 29 December 2009 to 28 June 2010, intense echoes frequently occurred between 17:00 and 24:00 local time (LT) above 105 km height (155 km range). Fig. 3 shows the power spectra of the Doppler velocity in the E region at 19:00 LT on 24 February 2010. Positive (negative) velocity corresponds to motion away from (towards) the radar or upward (downward) motion. Strong echoes appear at the 165 - 195 km range (110 - 130 km in height). The mean Doppler velocity is well below the ion acoustic velocity (350 - 400 ms-1). Type II spectra, which are often observed in the middle latitudes, are characterized by broad Doppler spectral width (300 - 800 ms-1) and small mean Doppler velocity (Schlegel 1996). Owing to the narrow Doppler spectral width of the echoes, most of the echoes observed at Daejeon are categorized as narrow Type II spectra.
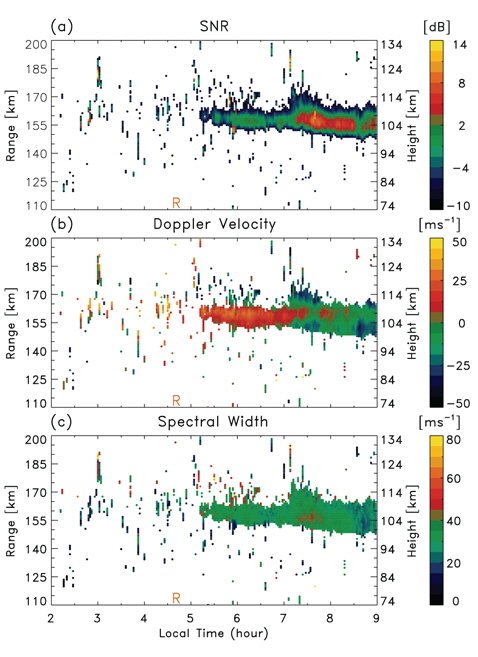
Fig. 4 presents sample observations of the (a) signal-tonoise ratio (SNR), (b) Doppler velocity, and (c) spectral width between 16:00 and 23:00 LT on 24 February 2010. The plots are presented in the range-time-intensity (RTI) format with height on the right side. Strong echoes appear at an altitude interval of 115 - 130 km just after sunset (18:40 LT) and persist until midnight at an altitude interval of 105 - 120 km. The heights of the E-region QP echoes observed by the Daejeon radar are higher by about 5 km than those observed by the MU radar (e.g., Yamamoto et al. 1991, 1992). From Fig. 4a, one may notice the quasi-periodic variation of the echo intensity as a function of time, with a period of 10 - 20 min. This sample observation may explain why those echoes are named QP echoes. The other interesting features are the descent of the echo height with time and the vertical striation of the echoes. These are also the characteristics of middle-latitude E-region QP echoes. The descending rate of the echo altitude is ~3 km per hour. The gradual descent of the QP echo altitude in the E region is seen to be a common behavior in the low and middle latitudes. This phenomenon is observed in the middle latitudes by the MU radar (e.g., Ogawa et al. 1995, Yamamoto et al. 1992), near the equatorial ionization anomaly region by VHF radar at Chung-Li (24.91°N, 121.24°E, 13.3°N dip latitude) in Taiwan (Pan et al. 1994), and near the magnetic equator by the MST Radar at Gadanki (13.45°N, 79.17°E, 6.4°N dip latitude) in India (Choudary et al. 1996). The striation of the echoes is similar to the observations by the MU radar (Fukao et al. 1998, Yamamoto et al.1991) and to those of the radar at Tanegashima (30.75°N, 131.03°E, 43.2°N dip latitude) (Tsunoda et al. 1998). One of the characteristics of the striations in the middle latitudes is the negative slope of the striations in the frame of time and height. That is, the echoes move downward as time progresses. However, the striations in the lower latitudes, as observed at Chung-Li (Pan & Tsunoda 1998) and Gadanki (Patra et al. 2002), show a positive slope. The reason for the opposite behavior of the striations in different latitudes has not yet been clearly understood. The Doppler velocities shown in Fig. 4b verify the downward motion of the E-region QP echoes. A positive (negative) value of Doppler velocity indicates motion away from (toward) the radar or upward (downward) velocity. Since the Doppler velocity of the FAI echoes is the phase velocity of the plasma irregularities, the Doppler velocities above 100 km altitude correspond to a line-of-sight component of the E × B plasma drift (Tanaka & Venkateswaran 1982). The Doppler velocities for the QP echoes above 105 km are mostly more than 30 ms-1 and their signs are mostly negative, indicating the movement of the FAIs toward the radar (or the downward motion of the FAIs). The negative Doppler velocities of the QP echoes are consistent with the decrease of the echo height with time and with the negative slopes of the striations observed in Fig. 4a. The full spectral width of the Doppler velocity shown in Fig. 4c represents the level of turbulence in the medium. The spectral width ranges between 20 ms-1 and 100 ms-1 and varies with time and spatial. In comparison with the Doppler velocity shown in Fig. 4b, the spectral widths near the regions of positive/upward velocities are greater than those near the regions of negative/downward velocities. However, the behavior of the spectral width is variable day to day and the observation in Fig. 4c is not a general feature.
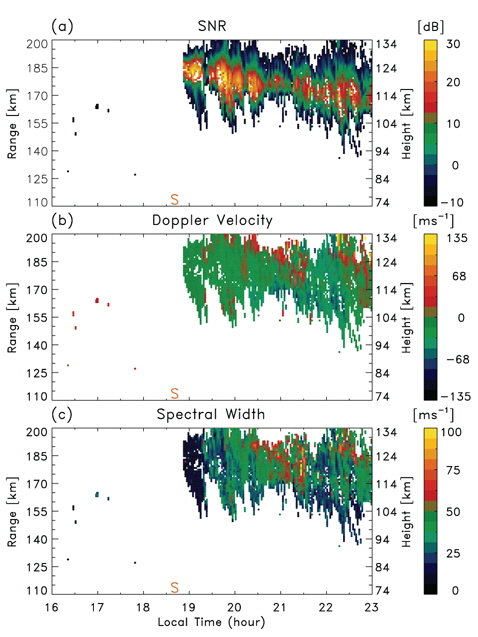
The characteristics of the E-region echoes observed in the post-sunrise period are quite different from those of the QP echoes. In the post-sunrise period, the weak echoes (SNR ≤ 15 dB) that show a quasi-stable behavior occur frequently at an altitude interval of 100 - 110 km. These echoes are of the continuous type in nature in both space and time. Fig. 5 presents an example of continuous echoes observed on 2 June 2010. The format is the same as that used in Fig. 4. In Fig. 5a, continuous echoes start to appear with sunrise (05:10 LT) around an altitude of 105 km and the echoes are seen to persistent for several hours. The SNR of the echo is less than 15 dB, which is smaller than the SNR of the QP echoes shown in Fig. 4a. Fig. 5b shows the line-of-sight Doppler velocities for the same time period. The mean Doppler velocities around 105 km altitude are mostly less than 30 ms-1. The Doppler velocity is positive between 05:10 and 07:00 LT, indicating that FAIs are moving away from the radar (or upward velocities). Observations of both the positive and negative Doppler velocities after 07:00 LT may indicate a merger of two different FAI layers. Fig. 5c shows the full Doppler spectral width. The full spectral widths are less than 50 ms-1. Formation of a narrow spectral width (< 100 ms-1) is explained by the gradient drift instability (Ogawa et al. 1995). For MU radar observations, continuous echoes (Yamamoto et al. 1991, 1992, 1994, Ogawa et al. 1995, 2002) appear around a height of 90 - 100 km, about 5 km lower than the height shown in Fig. 5. Because the echo height is variable day to day, comparison of the simultaneous observations at Daejeon and Shigaraki and values from statistical analysis are necessary in order to verify the existence of any latitudinal and longitudinal variations of the echo height. Ogawa et al. (2002) suggested that continuous echoes have no relation with Es activity, but the driving mechanism of the continuous echoes remains a widely open question.
F-region FAIs appear after sunset and disappear just before sunrise. Following the seasonal variation of the sunset and sunrise times, the occurrence LT of the FAIs also varies with season. The majority of FAIs in the F region appear like sparsely distributed patches. Infrequently, FAIs are persistent throughout the night. Here we present examples of those two types.
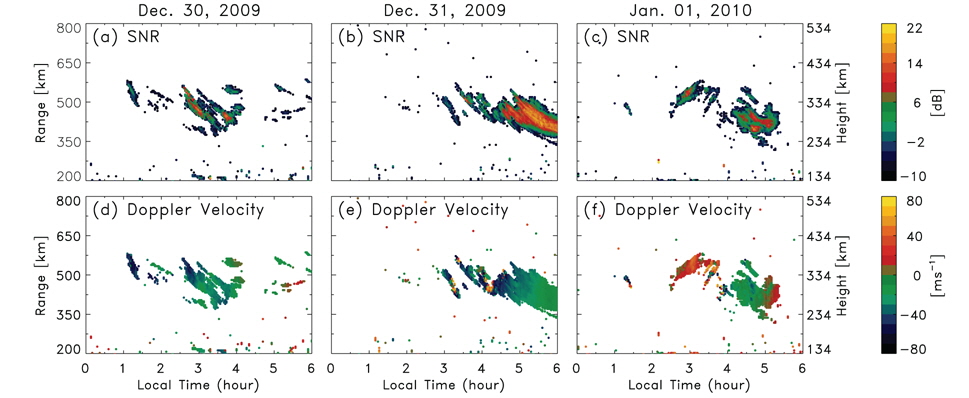
Patch type FAIs were observed at early morning for three consecutive days. Fig. 6 shows the RTI plots of (a-c) SNR and (d-f) Doppler velocity during the period 30 December 2009–1 January 2010. Figs. 6a-c show the existence of a mixture of week (~ -10 dB) and strong (~20 dB) echoes during those three days. The echoes appear between the heights of 230 and 430 km. The echo height shows a tendency to decrease with time. The strong echoes in Figs. 6a and 6b show negative height rate, i.e., decrease of the echo height with time. On the other hand, the strong echoes in Fig. 6c show upward movement between 02:00 and 03:00 LT, reaching to a height of 330 km altitude and then exhibiting downward movement after 04:00 LT. The Doppler velocities shown in Figs. 6d-f are consistent with the movement of echoes shown in Figs. 6a-c. The Doppler velocities during the three days are mostly negative, with a maximum velocity of 66 ms-1. At the locations of the echoes that show positive height rates (the echoes between 02:00 and 03:00 LT in Fig. 6c), the Doppler velocity is about 50 ms-1. The striations of the negative height rates (the slope of the striation on the time and height frame) show negative Doppler velocities (moving toward the radar or downward velocities) and the striations of positive height rates show positive Doppler velocities (moving away from the radar or upward velocities). The striation of the F-region echoes and the variation of the observed Doppler velocities, depending on the height rate of the striation, were similar to those observed by the MU radar in Japan (Fukao et al. 1991, Saito et al. 2008).
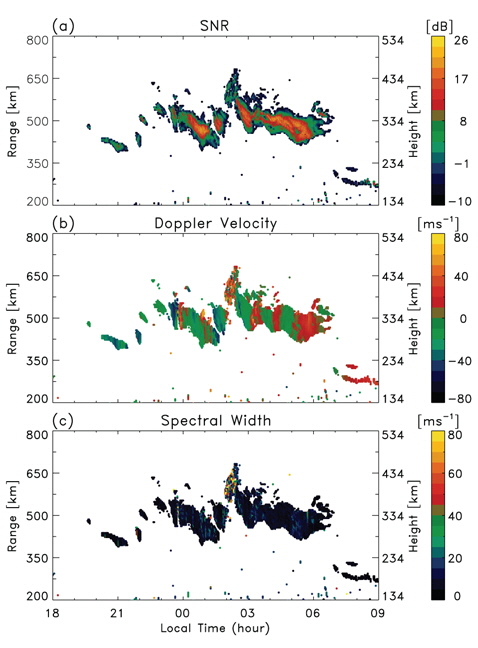
Fig. 7 shows an example of persistent F-region FAIs observed on the night of 23-24 February 2010. In Fig. 7a, strong echoes appear around 290 km height at about 20:00 LT, move upward to around 380 km height at about 23:00 LT, and echoes then descend until 01:30 LT. Abrupt upward movements of the echoes are observed between 01:30 and 02:00 LT and the peak height of the echoes reaches 450 km. Then, strong echoes gradually descend and persist until 07:00 LT. After 07:00 LT, the echo height abruptly drops from 280 km to below 230 km. The echoes observed at 07:00 LT persist until 09:00 LT. The persistence of the F-region FAIs throughout the night rarely happens in middle latitude, and the F-region FAIs after sunrise have not yet been reported in previous studies. The F-region echoes show striations whose slope on the time and altitude frame varies with time. The slope is negative at 20:00 - 23:30 LT, positive at 23:30 - 00:00 LT, negative at 00:00 - 02:00 LT, etc. The property of the striation is more clearly visible by looking at the Doppler velocity shown in Fig. 7b. Striations with negative height rates have negative Doppler velocities (moving toward the radar or downward velocities) and those with positive slopes have positive Doppler velocities (moving away from the radar or upward velocities). The Doppler velocity is negative in the pre-midnight period, whereas the direction of the Doppler velocity varies quasi-periodically after midnight. At the locations of the FAIs after sunrise, the Doppler velocity is positive. The quasi-periodic variation of the striation (or Doppler velocity) was also identified from persistent echoes observed during other days. The spectral widths of the Doppler velocity shown in Fig. 7c are mostly less than 15 ms-1, which is smaller by about a factor of 2 compared with those of the E-region FAIs. We leave further specification of the F-region echoes and investigation of their association with MSTIDs to future studies.
In this paper, we introduce initial observations of E- and F-region FAIs during the solar minimum (2009-2010) using the 40.8 MHz coherent backscatter radar at Daejeon (36.18°N, 127.14°E, 26.7°N dip latitude) in South Korea. In the E region, QP-type echoes appear in the post-sunset period above an altitude of 105 km and continuous-type echoes appear in post-sunrise period around an altitude of 105 km. The QP echoes occur intermittently with a quasiperiod of 10-20 min and descend to lower altitudes as time progresses. The striations in the QP echoes show negative slopes on the time and altitude frame. While most of the characteristics of the E-region QP and continuous echoes observed at Daejeon are consistent with those observed by the MU radar in Japan, the height of the E-region QP and continuous echoes observed by the Daejeon radar is seen to be higher by about 5 km than that observed by the MU radar.
In the F region, FAIs appear mostly at night in the altitude range of 250 - 450 km. Most of these echoes look like patches that last for a few hours. In general, the height of the FAIs increases during pre-midnight and decreases during post-midnight. The duration of the F-region FAIs is typically a few hours at night, although, in rare cases, FAIs persist throughout the night. The F-region FAIs after sunrise are a new finding by the Daejeon radar. Striation and periodic variation of the striation direction of the FAIs are observed in the F region. The striations of negative and positive slopes on the time-height frame are consistent with observations of negative and positive Doppler velocities, respectively. The striation of the F-region echoes and the periodic variation of the Doppler velocity, depending on the direction of the striation, were also identified by the MU radar in Japan.
The Daejeon radar has been operated continuously since December 2009. Initially (December 2009 -January 2010), the operation time intervals of the E- and F-region modes were 00:00 - 24:00 LT and 18:00 - 06:00 LT, respectively. For the period of February 2010 - January 2011, the operation time interval of the F-region mode was changed to18:00 - 09:00 LT. Since February 2011, the E- and F-region modes have been operated for 24 hours. Other observational facilities such as an all-sky imager, ionosonde, global positioning system, scintillation monitor, total electron content meter, and magnetometer are available near the Daejeon radar observatory. Combining those observations, the continuous and long-term observations of the Daejeon radar are expected to enrich our understanding of the characteristics, climatology, and driving mechanisms of middle-latitude irregularities.
The Daejeon radar has been operated continuously since December 2009. Initially (December 2009 -January 2010), the operation time intervals of the E- and F-region modes were 00:00 - 24:00 LT and 18:00 - 06:00 LT, respectively. For the period of February 2010 - January 2011, the operation time interval of the F-region mode was changed to18:00 - 09:00 LT. Since February 2011, the E- and F-region modes have been operated for 24 hours. Other observational facilities such as an all-sky imager, ionosonde, global positioning system, scintillation monitor, total electron content meter, and magnetometer are available near the Daejeon radar observatory. Combining those observations, the continuous and long-term observations of the Daejeon radar are expected to enrich our understanding of the characteristics, climatology, and driving mechanisms of middle-latitude irregularities.