All lives on the Earth, including humans, are directly and indirectly exposed to radiation emitted from the variety of sources. The ionized particles enter the Earth from the space to appear in a cosmic ray. Because most of space radiation is shielded by the Earth's atmosphere, the effect of the radiation on humans at the surface might be almost negligible. However, it has been shown that space radiation levels of aircrew and passengers under the specific environment, such as the high-altitude flight (above 10 km) or the polar route flight are much higher than those of medical and industrial occupations dealing with radiation routinely (Bartlett 1999, Dyer et al. 2003). The exposed space radiations of aircrew and passengers vary according to the solar activities and the conditions like the flight altitude and latitude. According to the results of former experimental measurements, the space radiation is generally maximized when the intensity of the solar activity is minimum, and vice versa. The level of the space radiation along the latitude of the flight route increases proportionally below the latitude of 50°, but is almost constant above that latitude. According to the characteristics of the high-altitudes, the intensity of the space radiation becomes stronger as the altitude rises. The intensity of space radiation is maximized around the altitude of 20 km, however, the change of intensity is relatively minor over that altitude. Due to these characteristics of the high-altitude and long-range route flights at around 40,000 ft (12 km), the annual space radiation doses for aircrew boarding a commercial airlines could be over 10 mSv (Dyer et al. 2007). Recently, various risks of exposure to space radiation have been recognized newly. Particularly, the long-term aviation personnel engaged in the business has a high probability of skin cancer, genetic mutations, as well as potential risks for the fetus. Thus, the International Commission for Radiological Protection and the Federal Aviation Administration (FAA) are beginning to pay attention to this. Especially, many researches to analyze the space radiation exposure limitation for aircrew have been carried out (Van Dijk 2007). The results of the researches were used for the satellite sensors and ground equipment to observe qualitatively the space radiation exposure characteristics owing to the changes of the solar activity. And they have actively conducted the experiments measuring space radiation doses of aviation aircrew directly with an equipment loaded onto the aircraft according to the flight altitude and time (Spurny & Dachev 2001) as well as developing the program to calculate the dose indirectly (Lantos & Fuller 2003).
In the late 2000s, the commercial airline companies and the relevant government departments of Korea have performed a research to measure directly and analyze the space radiation doses for flight passengers and aircrew traveling the Polar route (Hwang et al. 2010). And the measurement and analysis of the space radiation doses for those aircrew performing the reconnaissance mission at a high altitude in Korea Air Force were attempted using the badge which measures the exposed dose quantitatively (Lim & Seo 2012).
This study includes the more qualitative analysis of the space radiation for the aircrew at a high-altitude reconnaissance mission flight in Korea Air Force.
The space radiations were measured with the Precision Measurement loaded onto the reconnaissance aircraft. The doses measured directly were verified by comparing them with the doses calculated indirectly from the program commonly used by the commercial airlines. Based on the results of these experimental measurements, the space radiation doses of the high-altitude reconnaissance aircrew are being used to verify the compliance of the general criteria of the domestic and international regulations.
2. MEASUREMENT OF THE EXPOSED SPACE RADIATIONS
An experiment was performed to measure the space radiations of flight aircrew of Korea Air Force during the reconnaissance mission flights. The space radiations were measured at the altitude of over 10 km with a precision radiation spectrometer (Liulin-6K) fabricated by the Solar-Terrestrial Influences Laboratory-Bulgarian Academy of Sciences. The spectrometer continuously measures the energy spectra of the space radiations and the exposed doses during the flights. This instrument has the certification of the Electro Magnetic Compatibility and it has no electric interference with the aviation electronic equipment of the aircrafts. In addition, it is capable of operating for 10 ~ 100 days continuously depending on the exposure time of the spectrometer with low power consumption. The measuring procedure of the space radiations is shown as the following Eq. (1). First, it measures the energy loss of the inner sensor by the space radiation. And this can be calculated into the absorbed dose (D) [Gy, grey].

where, MD is the weight of the measurement sensor, ELi is the energy loss in channel i, K is a constant. And absorbed doses are converted into the effective doses [Sv, Sivert] by applying a priori model obtained from the long-term space flight experiments (Dachev 2009).
This study uses the data from total of 20 experiments which measured the space radiations from October 5 to December 4 in 2012. Two cases were excluded due to the change in flight altitude out of the total experiments. And the remaining 15 cases in the high-altitude reconnaissance flights and 3 cases in the normal flights were analyzed. All the high-altitude reconnaissance flights were conducted on the same route over the middle area of the Korean Peninsula, and the experiments were performed with the high-altitude flights of 10.2 km (34,000 ft) and of 11.4 km (38,000 ft). For comparison with these results, the experiments were performed to measure the exposed doses for aircrew of the normal mission along the same route of flight at the altitude below 4 km in the Korean peninsula.
Experiments to measure the space radiations for the missions (reconnaissance, normal) were directly executed by the aircrew carrying the precision spectrometer loaded onto the cockpit, and the variation of the space radiations throughout the entire flight time were recorded for a more detailed analysis. The exposure time of the spectrometer was set to 30 seconds. In addition, this study compared the measured data by the spectrometer with the calculated data from the CARI-6M space radiation to understand the unique characteristics of the spectrometer measuring the space radiations and to check the validity of the results in accordance with the international standard for the exposed dose limits. The CARI-6M developed by FAA is widely utilized for calculating the space radiation doses to evaluate the exposed doses of aircrew of the commercial airliners. In order to calculate the space radiation doses in CARI-6M, it is necessary to input the flight data such as dates and the information on take-off, landing and route (time, altitude, latitude and longitude) during the entire flight. And another form of space radiation, neutron counts observed from the Delaware University of Neutron Monitor Program were compared with the measured space radiation doses from the spectrometer quantitatively.
3. ANALYSIS OF THE EXPERIMENTAL RESULTS
As shown in Tables 1 and 2, the exposure characteristics of the space radiations measured at the high or normal altitude over the Korean Peninsula are analyzed. The total exposed doses and hourly dose rates are reviewed during the flight missions for all 15 cases of high-altitude reconnaissance flights and for 3 cases of normal cargo flights.
[Table 1.] Results of the dose measurements for the high-altitude flights.

Results of the dose measurements for the high-altitude flights.
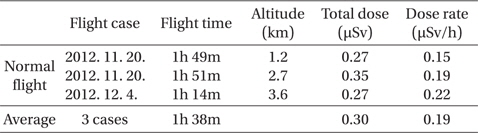
[Table 2.] Results of the dose measurements for the normal altitude flights.

Results of the dose measurements for the normal altitude flights.
The average flight time of 15 cases in the high-altitude reconnaissance flights is 4 hours 44 minutes. Compared with the flight time of the high-altitude reconnaissance missions, the average flight time of the cargo flights is 1 hour 38 minutes, which is relatively shorter than that of the high-altitude flights. Among the high-altitude flight experiments, 7 cases were measured at the altitude of 10.2 km and 8 cases were measured at the altitude of 11.4 km. All 3 cases for the normal cargo flights were at the altitude of below 4km. Total exposed doses are in the range of 11 - 18 μSv during the entire high-altitude flights. On the other hand, the exposed doses of all 3 normal flight cases are measured as 0.27 ~ 0.35 μSv. The variations of the exposed dose depend significantly on the flight altitude. The maximum exposed dose measured is 17.88 μSv with total flight time of 4 hours 45 minutes on October 12 and the smallest is 11.51 μSv with flight time of 4 hours 31 minutes on December 3. The average exposed doses for the high-altitude flights and the normal flights are 15.27 μSv and 0.30 μSv, respectively. Based on these results, the hourly exposed dose rates for high-altitude and the normal flights are calculated to, be 3.24 μSv/h and 0.19 μSv/h, respectively. The dose rates of the high-altitude flights is almost 20 times as high as that of the normal flights. The exposed dose rates change drastically as the altitude increases. It is shown that the diurnal change of the space radiations can be inferred through the exposed dose rates for each flight type.
In regard to monthly exposed doses, October shows the highest value of 16.3 μSv over total experimental periods, November and December shows 14.02 μSv and 13.29μSv, respectively. According to the experiments at the altitudes of 11.4 km and 10.2 km, the average exposed doses at those altitudes are 15.89 μSv and 14.56 μSv, respectively. The means of hourly exposed dose rates at each altitude are calculated to be 3.41 μSv/h and 3.05 μSv/h at 11.4 km and 10.2 km respectively. It is shown that both doses and dose rates are closely correlated with the altitude. However, it has a limitation to analyze the characteristics of the exposed doses with a temporal variation such as diurnal cycle in each measured cases because the statistical significance is challenged by the small number of the experimental cases.
Based on these results, it is inferred that the rate of change of the exposed dose is most sensitive to the flight altitude in comparison with the other factors such as the flight date and latitude over the same area of the Korean peninsula.
Considering the measured data for the exposed dose rates and the individual average flight times of 300 ~ 400 hours per year for the high-altitude reconnaissance aircrew, the effective doses of the aircrew are calculated to be in the range of 0.97 ~ 1.30 mSv annually. The effective doses calculated satisfy the annual exposed dose limits of domestic and international standards (6 ~ 20 mSv annually) for aviation person, but exceed the annual exposed dose limit for the general public, 1 mSv. These results are three to four times as high as the annual exposed doses for reconnaissance aircrew reported in the previous study (Lim & Seo 2012).
Fig. 1 shows the distribution of the total doses measured at the flight altitude of 10.2 km and 11.4 km. Although it has a limitation in statistical analysis due to the lack of the number of the measurements, both the flight times and the exposed doses seem to be closely correlated with the flight altitudes. The exposed doses at each flight altitude (7 cases at 10.2 km and 8 cases at 11.4 km) show a strong correlation with the flight times. Except one case, the data reveals that flight times are more closely correlated with the exposed doses for the cases of 11.4 km altitude than for the cases of 10.2 km. And the variations of the exposed doses according to the flight time at the altitude of 11.4 km is relatively small. However, these results have the weakness from the standpoint of statistics, the lack of the number of the experimental measurements. For the more quantitative analysis of the exposed doses, it is necessary to have more of the experimental measurements for the high-altitude reconnaissance flights in the future study.
In order to validate the results of the exposed doses of aforementioned 18 cases, those were compared with the data from CARI-6M. CARI-6M is utilized for calculating the exposed doses for the commercial aircrew. The exposed doses of all experimental measurements were reproduced by entering the flight informations during the flight phases (takeoff, cruise, landing) into the program. It is noted that the calculated results of the exposed doses from CARI-6M are completely same for the same flight informations of total flight time, path and altitude in the same month, even if the dates are different. It is because that the HCP (HelioCentric Potential) affects the process for calculating the exposed dose and it is updated on a monthly basis.
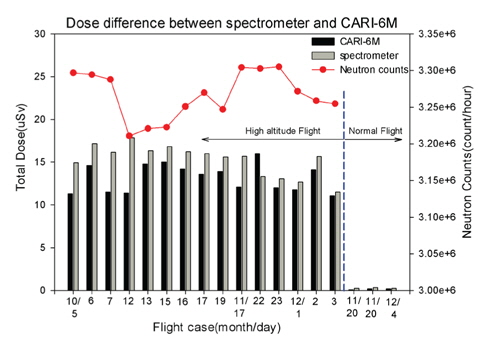
As shown in Fig. 2, the measured doses using the precision spectrometer are compared with the calculated doses from CARI-6M, and the neutron counts of a monitor station in the neutron monitor program of the University of Delaware are analyzed for the similar position (mid-latitudes) and for the same date and time.
The differences (inconsistency, uncertainty) between the results of the total exposed doses are 2.5 μSv and 0.12 μSv on average for the high-altitude flights and the normal flights, respectively. The difference for the high-altitude flights is larger than the normal flights. However, the relative fraction of the differences are 15.6% for the high-altitude flights and 42.9% for the normal flights unlike the absolute difference. Considering the measuring range of the dose rates with Liulin-6K, the difference for the normal flights is rather large. It is because that the observation sensitivity of spectrometer is relatively minor compared to the measured dose rates. However, for the high-altitude flights, the difference of the exposed doses between the measured and the calculated is less than 25%, to be consistent with the former research (Lindborg et al. 2004). It is shown that the relative difference between the measured and the calculated doses for the high-altitude flights is less than that of the previous studies. It could be inferred that this small difference is the result of the difference in the spatial distances covered in these experiments and the existing researches. Previous researches were performed for a relatively large spatial distance of long-range flight. Due to the characteristics of CARI-6M, the calculated doses cannot reflect the daily change of the space radiation. It is because that HCP is the key parameter of calculating the space radiation of CARI-6M, which is updated on a monthly basis when compared with 18 measurement results.
In addition, the analysis is carried out with regard to the exposed doses and the neutron counts for the high-altitude flights. The measured neutron count data is another form of space radiations. The neutron data utilized is obtained from the monitor station at Newark of United States, where the latitude is similar to the central region of the Korean peninsula. According to the analysis, the hourly average neutron counts are in the range of 3.21×10⁶ ~ 3.305×10⁶ for the high-altitude flights. It is difficult to find the relationship between the exposed doses (the measured or the calculated) and the neutron counts. In the analysis, the spatial distributions of the space radiations are different if the space radiations are measured at other location of similar latitudinal coordination. Also there is a limitation in estimating the exposed doses for the high-altitude flights using the neutron counts on a ground basis. Thus, in order to analyze the space radiation doses for a flight aircrew, it is needed to observe the experimental measurements of flight directly.
In order to analyze the changes in space radiation in more detail for each of the experimental measurements above, the analysis of the space radiations is performed for the selected high-altitude flight cases and the normal flight cases according to the flight height during the total flight time (take-off to landing).
Fig. 3 illustrates the distribution of the time series for the dose rates of a high-altitude flight. The total flight time is 4 hours 45 minutes counted from the take-off at October 5, 2012 0800 KST (October 4 2300 UTC) to the landing at1245 KST (October 5 0345 UTC). The dose rates during take-off and climb phase to reach the cruise altitude (10.2 km) at 0822 KST (2322 UTC) increases rapidly after a ground take off. During the cruise phase after reaching the cruising altitude, the dose rate tendency shows a small variation until the descending phase starts at 1222 KST (0322 UTC) for the landing. As shown in Fig. 3, the dose rate tendency decreases sharply during the landing phase, as opposite to the take-off phase. Another interesting characteristic is that the higher the dose rates are, the bigger the variations of dose rates are. This feature can be found from the standard deviation for each phase.
Fig. 4 shows the time series of the dose rates for the high-altitude (11.4 km) from the take-off at October 6, 2012 0800 KST (October 5 2300 UTC) to the landing at 1243 KST (October 6 0343 UTC). The total flight time recorded is 4 hours 43 minutes.
In this case, it is obvious that the dose rates increase dramatically until 0821 KST (2321 UTC) to reach the cruise altitude (11.4 km) during the take-off phase. Although the flight time of the cruise phase with the cruise altitude is the longest among the whole flight phases before the descent at 1222 KST (0322 UTC), but the change of dose rate tendency is even smaller than other phases. Increase of the measured dose rates in accordance with the exposed dose amounts can be seen through the change of the standard deviation (Standard Deviation, SD) for each flight phase. The large deviation results from the accumulation of the exposed doses for the exposure time setting with 30 seconds in the precision spectrometer during the calculation process. For each phase of the selected cases among the high-altitude flights, the average tendencies of the measured dose rates consistent with those of the calculated dose rates. It is also shown that the tendency between the measured dose rates and the calculated dose rates using the program has a high consistency as the previous examples in all flight phases.
Fig. 5 shows the time series of the measured and calculated dose rates of a normal flight. The total flight time is1 hour 49 minutes counted from the take-off at November 20, 2012 1320 KST (November 20 0420 UTC) to the landing at 1509 KST (November 200609 UTC).
The distribution of dose rates is quite different from the distributions of the previous two cases with high altitude. The dose rates increase only slightly after take-off at 1325 KST (0425 UTC) to reach the cruising altitude of 1.2 km. While in the cruise phase with the cruise altitude, there is almost no change of the dose rates until the landing phase. These characteristics of the dose rate distribution are completely distinct from two former high-altitude flight cases. In this case, the increasing feature of the dose rates and the change of the standard deviations is not shown unlike the previous two cases due to the low dose rates compared with the high-altitude flight cases. However, it appears that there is a close correspondence between the tendencies of the measured dose rates and the calculated dose rates for all flight phases.
In the analysis of the measured and modeled doses above, it is shown that the measured results of the space radiation have dependency on the flight time, altitude and the latitude. Also, there is a strong correlation between the measured doses and the calculated ones for all flight types (the high-altitude and the normal). It is found that the exposed doses of high-altitude reconnaissance flight aircrew could exceed the dose limits for the general public on the surface depending on the flight condition (time, altitude etc.).
This study analyzes both the measurement data of the space radiations using the precision Liulin-6K spectrometer and the modeled data using the CARI-6M program for the high-altitude reconnaissance flights operated by the ROK Air Force over the Korean Peninsula.
According to the results of experimental measurements, the average exposed doses for the 15 high-altitude reconnaissance flights was 15.27 μSv and it was 0.30 μSv for three cases of normal flights. The average exposed dose rate of the high-altitude flights was 3.24 μSv/h. The analysis for each flight phase (take-off, cruise, landing) of the high-altitude missions shows that the space radiation doses and dose rates are closely correlated with the flight altitude. The tendency of the exposed doses and the dose rates are nearly constant during the cruise phase with the fixed altitude, although both the doses and the dose rates show a significant deviation depending on the exposure time setting of the precision spectrometer. These measured results show that the exposed doses of the high-altitude reconnaissance mission aircrew of Air Force considering the annual flight time could exceed the annual dose limit (1 mSv) for the general public. In order to validate the results of the precision spectrometer, those were compared with the calculated data from CARI-6M. It is found that the relative difference is less than that of the previous study. The reason is that these experiments have been carried out over a small area, but those of previous study had been performed over a large area separated spatially.
The experiments have limitations in deriving more explicit results because of the short time span of experiments and the lack of the number of measurements. For further study, it is considered that a long-term experiment of the exposed doses according to the characteristics of space radiation should be performed in order to highlight radiation effects for high-altitude flight aircrew.