Mesodinium rubrum is a globally distributed ciliate (Lindholm 1985, Crawford 1989, Williams 1996, Gibson et al. 1997) that sometimes causes red tides in coastal waters (Johnson et al. 2004, Yih et al. 2004, Hansen and Fenchel 2006, Hansen et al. 2013, Johnson et al. 2013, Kang et al. 2013). M. rubrum is capable of both photosynthesis and prey ingestion (Gustafson et al. 2000, Yih et al. 2004, 2013). In addition, this species is an important prey for some dinoflagellate predators (i.e., Amylax triacantha, Alexandrium pseudogonyaulax, Dinophysis spp., Neoceratium furca, and Oxyphysis oxytoxoides) and an effective grazer of cryptophytes (Yih et al. 2004, Park et al. 2006, 2011, 2013b, Blossom et al. 2012, Hansen et al. 2013, Johnson et al. 2013).
The predation of M. rubrum by heterotrophic protists is one of the critical factors that affect the population dynamics of red tide species. Heterotrophic protists play an important role in marine food webs, as they connect phototrophic plankton to higher trophic levels (Stoecker and Capuzzo 1990, Sherr and Sherr 2002, Myung et al. 2011, Garzio and Steinberg 2013). However, there have been few studies on the feeding patterns of common heterotrophic protists that frequently co-occur with M. rubrum. O. oxytoxoides is the only heterotrophic dinoflagellate that is known to feed on M. rubrum (Park et al. 2011). However, the growth and ingestion rates and / or the impact of heterotrophic protist grazing on M. rubrum have not been reported.
Gyrodiniellum shiwhaense, Gyrodinium dominans, Gyrodinium spirale, Luciella masanensis, Oblea rotunda, Oxyrrhis marina, Pfiesteria piscicida, Polykrikos kofoidii, Protoperidinium bipes, and Stoeckeria algicida, and naked ciliates having sizes of 30-50 μm have been reported to be present in many waters (Strom and Buskey 1993, Jeong et al. 2004, 2005, 2006, 2007, 2011a, 2011b, Kim and Jeong 2004, Yoo et al. 2010, 2013a, Seuthe et al. 2011, Kang et al. 2013). Furthermore, they often co-occur with M. rubrum (Hansen et al. 1995, Bouley and Kimmerer 2006, Kang et al. 2013). Thus it is worthwhile to explore interactions between M. rubrum and these heterotrophic protists.
The results of the present study would provide a basis for understanding the interactions between M. rubrum and heterotrophic protists.
M. rubrum (MR-MAL01) was isolated from water samples collected from Gomso Bay, Korea (35˚40′ N, 126˚40′ E) in May 2001 at a water temperature and salinity of 18℃ and 31.5, respectively. A clonal culture of M. rubrum was established as in Yih et al. (2004). The culture was maintained with Teleaulax sp. (previously described as a cryptophyte) in 500-mL bottles on a shelf at 20℃ under an illumination of 20 µE m-2 s-1 of cool white fluorescent light on a 14 h : 10 h light-dark cycle (Yih et al. 2004).
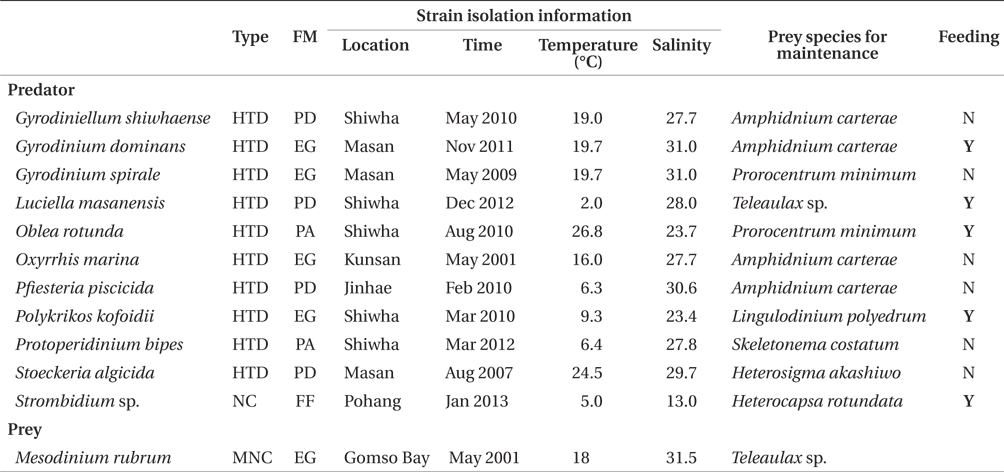
For the isolation and culture of the heterotrophic dinoflagellates G. shiwhaense, G. dominans, G. spirale, L. masanensis, O. rotunda, O. marina, P. piscicida, P. kofoidii, P. bipes, S. algicida, and the naked ciliate Strombidium sp. plankton samples were collected from the waters of coastal area in Korea in 2001-2013, and a clonal culture of each species was established by two serial single-cell isolations (Table 1).
The carbon contents for M. rubrum (0.43 ng C cell-1, n= 40), the heterotrophic dinoflagellates, and the ciliates were estimated from cell volume according to Menden-Deuer and Lessard (2000). The cell volume of the preserved predators after each feeding experiment was conducted was estimated using the methods of Kim and Jeong (2004) for G. dominans and G. spirale, the protocol of Jeong et al. (2008) for O. marina, and the methods of Jeong et al. (2001) for P. kofoidii. The cell volume of O. rotunda was calculated with an assumption that its geometry is an ellipsoid.
Experiment 1 was designed to test whether G. shiwhaense, G. dominans, G. spirale, L. masanensis, O. rotunda, O. marina, P. piscicida, P. kofoidii, P. bipes, and S. algicida, and the naked ciliate Strombidium sp. were able to feed on M. rubrum (Table 1).
Approximately 10,000 M. rubrum cells were added to each of the two 42-mL polycarbonate (PC) bottles containing each of the heterotrophic dinoflagellates (2,000-10,000 cells) and the ciliates (10-80 cells) (final M. rubrum prey concentration = ca. 1,000-5,000 cells mL-1). One control bottle (without prey) was set up for each experiment. The bottles were placed on a plankton wheel rotating at 0.9 rpm and incubated at 20℃ under an illumination of 20 μE m-2 s-1 on a 14 h : 10 h light-dark cycle.
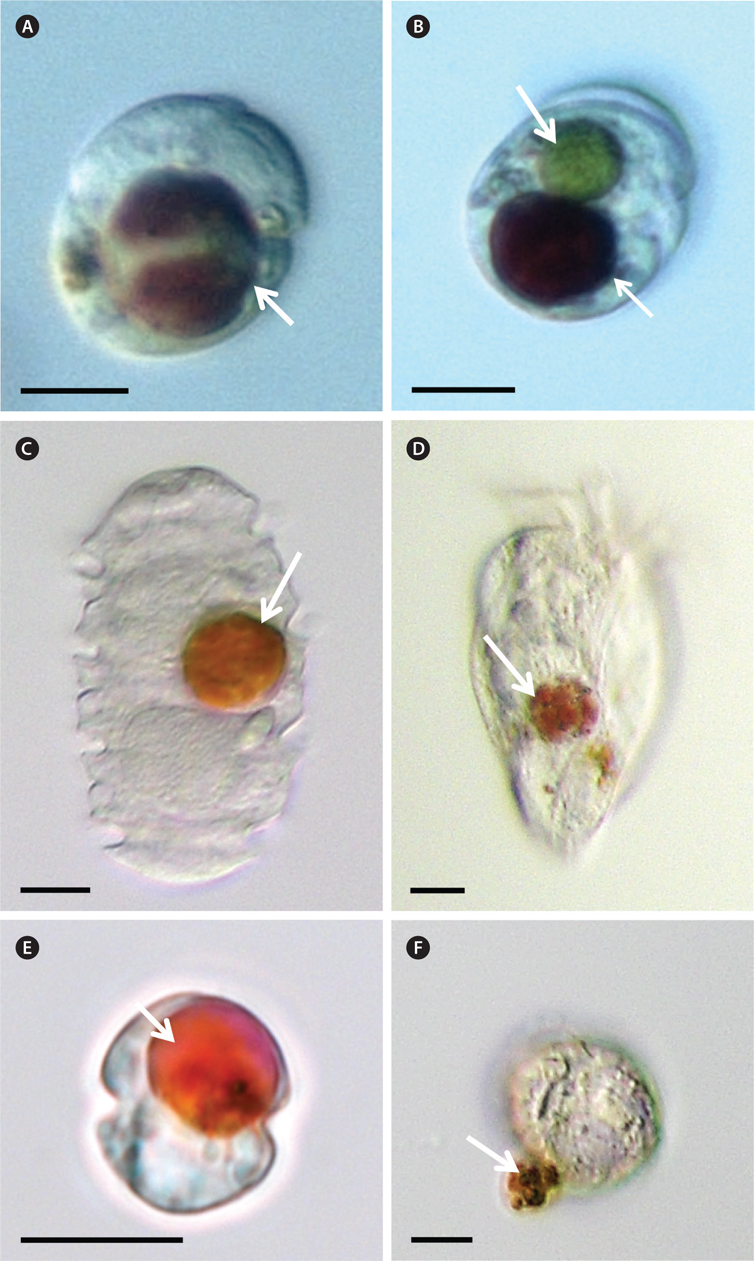
Five milliliter aliquots were removed from each bottle after 1, 2, 6, and 24 h incubation and then transferred into 6-well plate. Approximately 200 cells in the plate chamber were observed under a dissecting microscope at a magnification of 10-63× (SZX10; Olympus, Tokyo, Japan) to determine whether the predators were able to feed on M. rubrum. Predator cells containing prey cells were transferred onto glass slides and then their photographs were taken at a magnification of 400-1,000× with a camera mounted on an inverted microscope (Zeiss-Axiovert 200M; Carl Zeiss Ltd., Gottingen, Germany).
Experiment 2 was designed to measure the growth and ingestion rates of G. dominans as a function of M. rubrum concentration.
Dense cultures of G. dominans growing on the algal prey listed in Table 1 were transferred to 500-mL PC bottles containing filtered seawater. The bottles were filled to capacity with freshly filtered seawater, capped, and placed on plankton wheels rotating at 0.9 rpm and incubated at 20℃ under an illumination of 20 μE m-2 s-1 on a 14 h : 10 h light-dark cycle. To monitor the conditions and interaction between the predator and prey species, the cultures were periodically removed from the rotating wheels, examined through the surface of the capped bottles using a dissecting microscope, and then returned to the rotating wheels. At timepoints at which prey cells were no longer present in ambient water, they were still observed inside the protoplasm of the predators. We therefore decided to starve the predators for 1 day in order to minimize possible residual growth resulting from the ingestion of prey during batch culture. After this incubation period, cell concentrations of G. dominans were determined in three 1-mL aliquots from each bottle using a light microscope, and the cultures were then used to conduct experiments.
For each experiment, the initial concentrations of G. dominans and M. rubrum were established using an autopipette to deliver predetermined volumes of known cell concentrations to the bottles. Triplicate 42-mL PC experiment bottles (mixtures of predator and prey) and triplicate control bottles (prey only) were set up at each predator-prey combination. Triplicate control bottles containing only G. dominans were also established at one predator concentration. To obtain similar water conditions, the water of predator cultures was filtered through a 0.7-μm GF/F filter and then added to the prey control bottles in the same amount as the predator culture for each predator-prey combination. All bottles were then filled to capacity with freshly filtered seawater and capped. To determine the actual predator and prey densities at the beginning of the experiment, a 5-mL aliquot was removed from each bottle, fixed with 5% Lugol’s solution, and examined using a light microscope to enumerate the cells in three 1-mL Sedgwick-Rafter chambers (SRCs). The bottles were refilled to capacity with freshly filtered seawater, capped, and placed on rotating wheels under the conditions described above. Dilution of the cultures associated with refilling the bottles was considered when calculating growth and ingestion rates. A 10-mL aliquot was taken from each bottle after 48-h incubation and fixed with 5% Lugol’s solution, and the abundance of G. dominans and prey were determined by counting all or >300 cells in three 1-mL SRCs. Before taking the subsamples, the conditions of G. dominans and their prey were assessed using a dissecting microscope as described above.
The specific growth rate of G. dominans, μ (d-1), was calculated as:
, where P0 and Pt = the concentration of G. dominans at 0 d and 2 d, respectively.
Data for G. dominans growth rates were fitted to a Michaelis-Menten equation:
, where μmax = the maximum growth rate (d-1); x = prey concentration (cells mL-1 or ng C mL-1), x’ = threshold prey concentration (the prey concentration where μ = 0), KGR = the prey concentration sustaining 1/2 μmax. Data were iteratively fitted to the model using DeltaGraph (Delta Point).
Ingestion and clearance rates were calculated using the equations of Frost (1972) and Heinbokel (1978). The incubation time for calculating ingestion and clearance rates was the same as that for estimating the growth rate. Ingestion rate data for G. dominans were also fitted to a Michaelis-Menten equation:
, where Imax = the maximum ingestion rate (cells predator-1 d-1 or ng C predator-1 d-1); x = prey concentration (cells mL-1 or ng C mL-1), and KIR = the prey concentration sustaining 1/2 Imax.
Additionally, the growth and ingestion rates of L. masanensis, O. rotunda, and Strombidium sp. on M. rubrum prey at a single prey concentration at which both growth and ingestion rates of G. dominans on M. rubrum were saturated were measured as described above.
After the 2-d incubation, the cell length and maximum width of G. dominans preserved in 5% acid Lugol’s solution (n = 20-30 for each prey concentration) were measured using an image analysis system on images collected with an inverted microscope (AxioVision 4.5; Carl Zeiss Ltd.). The shape of G. dominans was estimated to 2 cones joined at the cell equator (= maximum width of the cell). The carbon content was estimated from cell volume according to Menden-Deuer and Lessard (2000).
We estimated grazing coefficients attributable to small heterotrophic Gyrodinium spp. (25-35 μm in cell length) on Mesodinium by combining field data on abundances of small Gyrodinium spp. and prey with ingestion rates of the predators on the prey obtained in the present study. We assumed that the ingestion rates of the other small heterotrophic Gyrodinium spp. on M. rubrum are the same as that of G. dominans. The data on the abundances of M. rubrum and co-occurring small heterotrophic Gyrodinium spp. used in this estimation were obtained from water samples collected in 2004-2005 from Masan Bay and in 2008-2009 from Shiwha Bay.
The grazing coefficients (g, h-1) were calculated as:
, where CR is the clearance rate (mL predator-1 h-1) of a predator on M. rubrum at a given prey concentration and GC is the predator concentration (cells mL-1). CR’s were calculated as:
, where IR (h) is the ingestion rate (cells eaten predator-1 h-1) of the predator on the prey and x is the prey concentration (cells mL-1). CR’s were corrected using Q10 = 2.8 (Hansen et al. 1997) because in situ water temperatures and the temperature used in the laboratory for this experiment (20℃) were sometimes different.
Among the predators tested in the present study, G. dominans, L. masanensis, O. rotunda, P. kofoidii, and Strombidium sp. preyed on M. rubrum (Table 1, Fig. 1). However, G. shiwhaense, G. spirale, O. marina, P. piscicida, P. bipes, and S. algicida did not attempt to attack, even when it encountered M. rubrum.
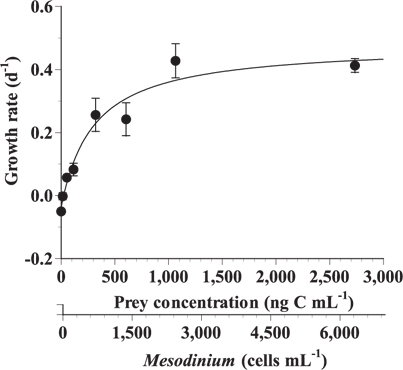
The specific growth rates of G. dominans on M. rubrum increased rapidly with increasing mean prey concentration up to ca. 321 ng C mL-1 (746 cells mL-1), but slowly at higher concentrations (Fig. 2). When the data were fitted to Eq. (2), the maximum specific growth rate (μmax) of G. dominans on M. rubrum was 0.48 d-1. The feeding threshold prey concentration for the growth of G. dominans (i.e., no growth) was 23.3 ng C mL-1 (54 cells mL-1).
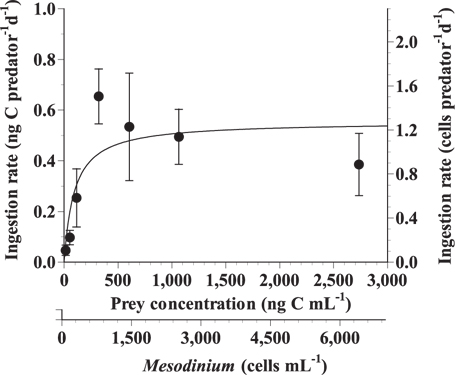
The ingestion rates of G. dominans on M. rubrum increased rapidly with increasing mean prey concentration up to ca. 321 ng C mL-1 (746 cells mL-1), but became saturated at higher concentrations (Fig. 3). When the data were fitted to Eq. (3), the maximum ingestion rate (Imax) of G. dominans on M. rubrum was 0.55 ng C predator-1 d-1 (1.3 cells predator-1 d-1). The maximum clearance rate of G. dominans on M. rubrum was 0.14 μL predator-1 h-1.
The growth rates of L. masanensis, O. rotunda, and Strombidium sp. on M. rubrum prey at single prey concentrations (995-1,130 ng C mL-1) at which both growth and ingestion rates of G. dominans on M. rubrum were saturated were negative.
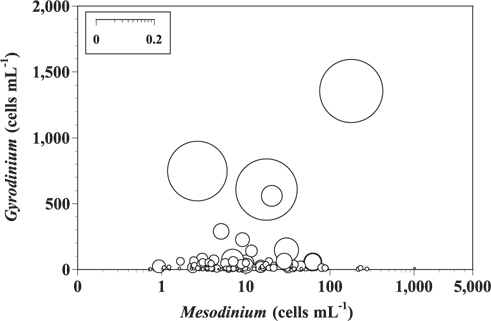
When the abundances of M. rubrum and small heterotrophic Gyrodinium spp. (25-35 μm in cell length) in Masan Bay in 2004-2005 and Shiwha Bay in 2008-2009 (n = 121) were 1-1,014 cells mL-1 and 1-1,356 cells mL-1, respectively, grazing coefficients attributable to small heterotrophic Gyrodinium spp. on co-occurring M. rubrum were up to 0.236 h-1 (Fig. 4).
Among the heterotrophic dinoflagellates and a ciliate investigated in this study, G. dominans, L. masanensis, O. rotunda, P. kofoidii, and Strombidium sp. prey on M. rubrum. With respect to feeding mechanisms, G. dominans, P. kofoidii, and Strombidium sp. feed on prey by direct engulfment, but L. masanensis by a peduncle, and O. rotunda by a pallium (Strom and Buskey 1993, Kim and Jeong 2004, Jeong et al. 2007, Yoo et al. 2010). Since organisms with different feeding modalities were able to graze on M. rubrum, we conclude that feeding mechanisms do not generally determine the ability of heterotrophic protists to feed on M. rubrum. In addition, the size range of the predators that can feed on M. rubrum is also wide, and thus this factor is also not a critical determinant of protist feeding on M. rubrum. G. shiwhaense, G. spirale, O. marina, P. piscicida, P. bipes, and S. algicida did not even attack M. rubrum when they encountered the ciliate. Thus, G. dominans, L. masanensis, O. rotunda, P. kofoidii, and Strombidium sp. may have an ability to detect M. rubrum cells by physical and / or chemical cues, while the other organisms may lack this feature.
M. rubrum usually stay motionless for a second, but swim or jump quickly. When it jumps, the maximum swimming speeds of M. rubrum are 2,217-12,000 μm s-1, which are comparable to or greater than that of G. dominans, O. rotunda, P. kofoidii, and Strombidium sp. (2,533, 420, 1,182, and 4,000 μm s-1, respectively) (Lee, unpublished data) (Barber and Smith 1981 cited by Smayda 2002, Crawford 1992, Buskey et al. 1993, Crawford and Lindholm 1997, Kim and Jeong 2004, Fenchel and Hansen 2006). Therefore, G. dominans, O. rotunda, P. kofoidii, and Strombidium sp. are likely to capture M. rubrum when they are motionless or when M. rubrum may bump into them and then stun them.
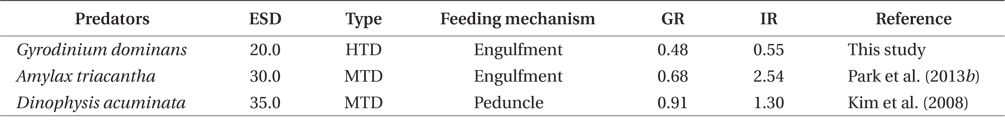
G. dominans was the only predator whose growth actually increased when grazing on M. rubrum in this study, even though L. masanensis, O. rotunda, P. kofoidii, and Strombidium sp. also fed on M. rubrum. In addition, the mixotrophic dinoflagellates Amylax triacantha and Dinophysis acuminata are known to grow on M. rubrum (Park et al. 2006, 2013b, Kim et al. 2008). Therefore, during red tides dominated by M. rubrum, G. dominans, A. triacantha, and D. acuminata are expected to be present. In contrast, L. masanensis, O. rotunda, P. kofoidii, and Strombidium sp. may be absent due to a lack of co-occurring alternative optimal prey species. The maximum growth rate of G. dominans on M. rubrum (0.48 d-1) is lower than the mixotrophic growth rates of A. triacantha and D. acuminata on the same prey (0.68 and 0.91 d-1, respectively) (Table 2). A lower ingestion rate of G. dominans on M. rubrum (0.55 ng C predator-1 d-1) when compared with A. triacantha (2.54 ng C predator-1 d-1) and D. acuminata (1.30 ng C predator-1 d-1) may be partially responsible for this lower growth rate. During M. rubrum red tides, G. dominans may be less abundant than A. triacantha and D. acuminata. However, G. dominans can grow on diverse algal prey species, while A. triacantha and D. acuminata can only grow on M. rubrum (Nakamura et al. 1992, 1995, Kim and Jeong 2004, Park et al. 2006, 2013b, Kim et al. 2008, Yoo et al. 2010, 2013b, Jeong et al. 2011a, 2014). Thus, the abundance of G. dominans in the period of red tides that are not associated with M. rubrum may be greater than those of A. triacantha and D. acuminata. We suggest that future studies should compare the relative abundances of these three predators, and their grazing impact on prey populations, during M. rubrum-associated red tides.
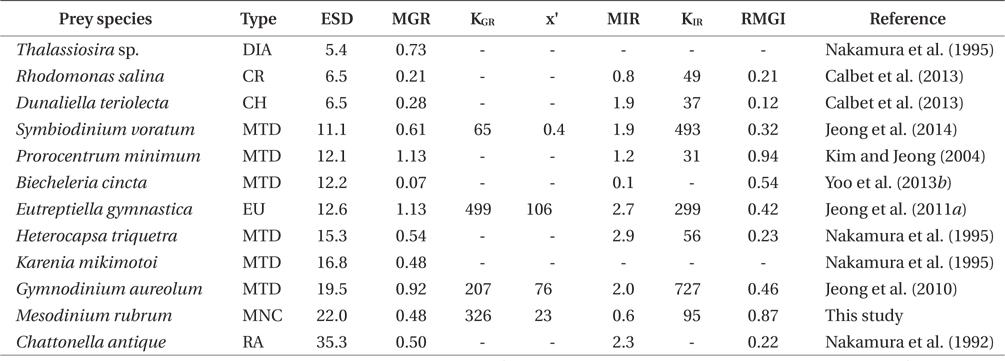
The maximum growth rate (μmax) of G. dominans on M. rubrum (0.48 d-1) is comparable to that on the mixotrophic dinoflagellates Heterocapsa triquetra and Karenia mikimotoi, and the raphidophyte Chattonella antique, but higher than that on the mixotrophic dinoflagellate Biecheleria cincta, the cryptophyte Rhodomonas salina, and the chlorophyte Dunaliella teriolecta (Table 3). However, the μmax of G. dominans on M. rubrum is lower than that observed with the mixotrophic dinoflagellates Gymnodinium aureolum, Prorocentrum minimum, and Symbiodinium voratum, the euglenophyte Eutreptiella gymnastica, and the diatom Thalassiosira sp. (Table 3). M. rubrum, these mixotrophic dinoflagellates, and the raphidophyte cause red tides in the waters of many countries (Crawford 1989, Heil et al. 2005, Jeong et al. 2011a, 2013, Park et al. 2013a, Yih et al. 2013). G. dominans is likely to be more abundant during M. rubrum red tides than during B. cincta, R. salina, or D. teriolecta red tides, but less abundant during E. gymnastica, G. aureolum, or P. minimum red tides.
The maximum rate at which G. dominans can ingest M. rubrum is one of the lowest among the algal prey species, with the exception of B. cincta and comparable to that on R. salina (Table 3). Interestingly, M. rubrum and Rhodomonas spp. exhibit jumping behaviors (Fenchel and Hansen 2006, Berge et al. 2008). These jumping behaviors of M. rubrum may act as an anti-predation behavior. However, the ratio of the maximum growth rate relative to the maximum ingestion rate of G. dominans on M. rubrum is greater than that on any other algal prey, with the exception of P. minimum. Therefore, M. rubrum is likely to be the most nutritious algal prey for G. dominans, P. minimum notwithstanding.
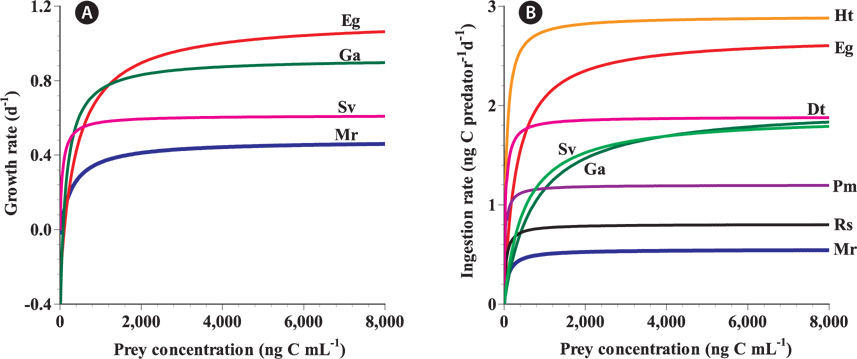
In the numerical response of G. dominans to four algal prey species, the feeding threshold prey concentration for growth of G. dominans on M. rubrum is lower than that of E. gymnastica or G. aureolum, but higher than that of S. voratum (Table 3, Fig. 5A). Therefore, G. dominans may preferentially grow on M. rubrum rather than on E. gymnastica or G. aureolum at low prey concentrations. The KGR (the prey concentration sustaining 1/2 μmax) of G. dominans on M. rubrum is greater than that on G. aureolum, and S. voratum, but lower than that on E. gymnastica. Therefore, the growth of G. dominans on M. rubrum is more sensitive to a change in prey concentration than the same parameter in E. gymnastica, but less sensitive than G. aureolum, and S. voratum. The functional response of G. dominans feeding on diverse algal prey species follows a Holling type II pattern (Holling 1959). With respect to the functional response of G. dominans to eight algal prey species, the KIR (the prey concentration sustaining 1/2 Imax) when grown on M. rubrum is greater than that obtained with R. salina, P. minimum, D. teriolecta, and H. triquetra, but lower than that obtained with E. gymnastica, G. aureolum, and S. voratum (Fig. 5B). Therefore, the ingestion of G. dominans on M. rubrum is more sensitive to a change in prey concentration than E. gymnastica, G. aureolum, and S. voratum, but less sensitive than R. salina, P. minimum, D. teriolecta, and H. triquetra.
[Fig. 5.] A comparison of the numerical (A) and functional (B) responses of the heterotrophic dinoflagellate Gyrodinium dominans feeding on diverse prey related to prey concentration. Rates are corrected to 20℃ using Q10 = 2.8 (Hansen et al. 1997). Eg, Eutreptiella gymnastica, euglenophyte; Ga, Gymnodinium aureolum, mixotrophic dinoflagellate; Sv, Symbiodinium voratum, mixotrophic dinoflagellate; Mr, Mesodinium rubrum, mixotrophic ciliate; Ht, Heterocapsa triquetra, mixotrophic dinoflagellate; Dt, Dunaliella tertiolecta, chlorophyte; Pm, Prorocentrum minimum, mixotrophic dinoflagellate; Rs, Rhodomonas salina, cryptophyte. All responses in (A) were fitted to Eq. 2, whereas those in (B) were fitted to Eq. 3.
To our knowledge, prior to this study, there had been no reports on the impact of protist grazing on Mesodinium populations. Grazing coefficients derived from studies in Masan Bay in 2004-2005 and Shiwha Bay in 2008-2009 show that up to 21% of M. rubrum populations can be removed by small Gyrodinium populations in approximately 1 d. Therefore, small heterotrophic Gyrodinium spp. can have a considerable grazing impact on populations of M. rubrum under suitable conditions. G. dominans is one of the few protistan grazers that are able to feed on M. rubrum, and is the only protistan grazer with a documented grazing impact on M. rubrum abundance. This finding should be taken into consideration when developing models to explain the red tide dynamics of M. rubrum.


![Specific growth rate of the heterotrophic dinoflagellate Gyrodinium dominans on Mesodinium rubrum as a function of mean prey concentration (x). Symbols represent treatment means ± 1 standard error. The curves are fitted by the Michaelis-Menten equation [Eq. (2)] using all treatments in the experiment. Growth rate (d-1) = 0.48 [(x - 23.3) / (325.7 + [x - 23.3])], r2 = 0.881.](http://oak.go.kr/repository/journal/13602/JORHBK_2014_v29n2_153_f002.jpg)
![Specific ingestion rates of the heterotrophic dinoflagellate Gyrodinium dominans on Mesodinium rubrum as a function of mean prey concentration (x). Symbols represent treatment means ± 1 standard error. The curves are fitted by the Michaelis-Menten equation [Eq. (3)] using all treatments in the experiment. Ingestion rate (ng C predator-1 d-1 = 0.55 [x / (94.6 + x)], r2 = 0.453.](http://oak.go.kr/repository/journal/13602/JORHBK_2014_v29n2_153_f003.jpg)