The development of novel polymer nanocomposites (PNCs) through the judicious combination of carbonaceous nanofillers with electrically conducting polymers for the conservation and storage of electrochemical energy has recently drawn great interest [1-3]. Carbonaceous nanofillers with outstanding electrical conductivity, good chemical stability, large surface area, high specific capacitance (Cs) and cycling stability improve the electrochemical performance of PNCs by giving them a long cycle life [2]. The supercapacitors derived from such PNCs are expected to provide a positive answer to the current demand for high-power energy storage systems with a reduced overpotential at high discharge rates [3]. Recently, a variety of PNCs based on graphene and its derivatives have been developed in combination with polyaniline [4,5] and polypyrrole (PPY) [4,6-8] in an effort to explore the next generation of electrochemical supercapacitors for electrochemical energy storage. In this context, PNCs derived from PPY in combination with graphene and graphene oxide (GO) in various proportions have recently been studied for the development of electrochemical energy storage devices [6,9-11]. In the preparation of such materials, the temperature plays a crucial role in their electronic conductivity. Recent studies have revealed that polymerization at a low temperature liberates PPY nanoparticles [12] with improved specific and electrochemical conductivities [13-19].
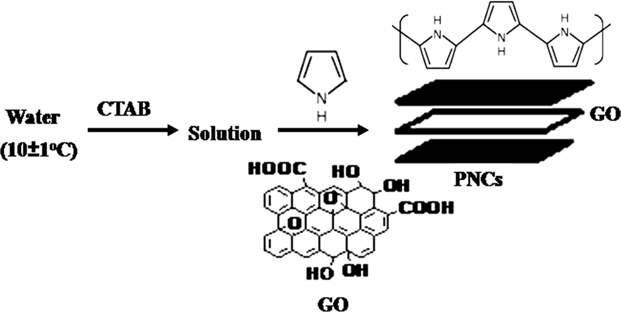
The present paper deals with an investigation of the effect of the preparation temperature on the electrocapacitive performance and power density of PPY/GO nanocomposites (PNCs). For this purpose, a series of PPY-GO nanocomposites (PNCs) was prepared at 30 ± 1℃ and 10 ± 1℃, through the cetyltrimethylammonium bromide (CTAB) assisted dilute-solution polymerization of pyrrole in the presence of different concentrations of GO (wt%) ranging from 1.0 to 4.0 with ferric chloride as an oxidant. The investigation demonstrates that PNCs prepared in the presence of a low percentage of GO at temperatures of 10 ± 1℃ rendered a dramatic enhancement in their specific capacitance over those prepared at 30 ± 1℃ [20-23]. The prepared PPY and respective PNCs were characterized through Fourier-transform infrared (FT-IR) spectrography, their X-ray diffraction (XRD) spectra, scanning electron microscopy (SEM) and simultaneous thermogravimetry-differential scanning calorimetry (TG-DSC). Their supercapacitance was investigated through cyclic voltammetry in potassium hydroxide (KOH, 1.0 M). The investigation reveals that PNCs prepared at 10 ± 1℃ display better electrochemical performance and may serve as high-power cathode materials with stable supercapacitance up to 500 cycles at a scan rate of 0.1 V/s over those prepared at 30 ± 1℃.
Polysulfone (PU, Mn; 16 × 103), pyrrole (>99%), CTAB (>99%) and chlorosulfonic acid (>99%) were procured from Sigma Aldrich. The graphite flakes used had an average particle size of 500 μm. Other chemicals and solvents were procured from S.D. Fine Chemicals, India. Sulfonated polysulphone (SPS) was prepared through the chlorosulfonation of PU and served as binder for the electrode materials [23]. GO was prepared through a modified Hummers method [24]. In this procedure, graphite flakes (5 mg) were digested into sulphuric acid (120 mL, d = 1.84 g/cc) for 10 min at -5℃ and were subsequently oxidized in the presence of potassium permanganate (15 g) for 30 min. The contents were diluted with deionized water (200 mL) at 35 ± 1℃, further oxidized with hydrogen peroxide (30%, 50 mL) and re-diluted with warm deionized water (450 mL). This has afforded a slurry that was subsequently treated with hydrochloric acid (5%, 50 mL), where the grey-black GO was separated. The GO was isolated through filtration and successively washed with deionized water to remove the salt impurity contaminants. The purified GO was dried at 45 ± 1℃ for 48 h.
A pair from a series of PPY-GO nanocomposites (PNCs) was separately prepared at ambient (30 ± 1℃) and reduced temperatures (10 ± 1℃) in a thermostatically controlled three-necked glass reactor equipped with a mechanical stirrer, a thermometer and a dropping funnel [25]. The reactor was charged with an aqueous suspension consisting of pyrrole (0.28 M, 30 mL), requisite concentration (wt%) of GO ranging from 1.0 to 4.0, and CTAB (1.145 g) as a stabilizer. The dropping funnel was charged with a solution of FeCl3 (30 mL, 1.85 × 10⁻² mol/dL). The polymerization of pyrrole was initiated through the addition of a solution of FeCl3 @ 1 mL/min to the suspension under constant stirring @ 600 rpm for 24 h. PNCs were isolated through centrifugation of the suspension at 6000 rpm for 10 min, followed by filtration, successive washing with deionized water, and drying at 50 ± 1℃/400 mmHg for 8 h. PPY was also prepared under identical reaction conditions.
2.3. Preparation of the electrodes
A commercially available 316-SS sheet was cut into a 1 cm2 area and finished with emery paper (mesh size 320600). It was then de-greased with acetone and subjected to surface oxidation at 50 ± 1℃ for 1 h. An electroactive material (65 mg) along with graphite (10 mg) was mixed with a solution of SPS (5 g/ dL) in N-methyl pyrrolidone. The contents were ultrasonicated for 15 min and applied (50 μL) over a SS substrate. The treated substrate was dried at room temperature for 2 h and then at 100℃/400 mmHg for 48 h. This afforded cathodes with a mass thickness of electroactive materials by 5 ± 1 mg over the 316-SS substrate [25].
The FT-IR spectra were recorded on a Thermo Nicolet FTIR spectrophotometer using KBr pellets. XRD patterns of powdered samples were recorded at room temperature by a Rigaku-Geigerflex X-ray diffractometer using Cu-Kα radiation. SEM images of the gold-coated samples were imaged over JEOL (JSM-6610 LV) with a beam voltage 5 KV at 2.7 KX at 5 μm. The average particle size was estimated using the Debye-Scherrer formula:
Here, ‘λ’ is wavelength of X-ray (0.1541 nm), ‘
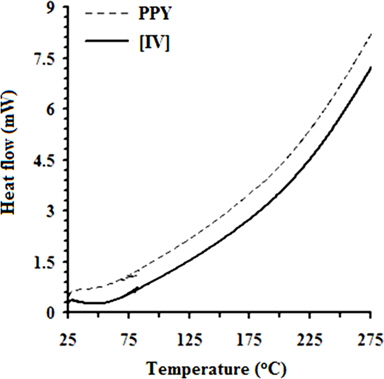
TG data were recorded over thermogravimetric analysis (TGA)-50H with a sample weight ranging from 2.16 to 6.64 mg under N2 at a rate of 30 mL/min from ~20℃ to 600℃. DSC data were recorded on a DSC-60 device with a flow rate of 30 mL/ min from ~25℃ to 275℃.
The electrochemical characteristics of the samples were investigated using an IVIUM potentiostat-galvanostat Netherlands BV using a three-electrode cell assembly with reference to an Ag/AgCl electrode, a Pt foil with a 1 cm2 area as counter electrode, and a commercially available 316-SS electrode as a working electrode. The cyclic voltammograms (CVs) were recorded at voltages ranging from -0.1 to -0.6 V at scan rates (V/s) of 0.001-0.20 at 10 mA in KOH (1 M). The specific capacitance (Cs) of the active materials was calculated from the voltammetric charges by the CV curve with the equation
where “qa” and “qc” are the voltammetric charges on the anodic and cathodic scans, respectively, in the capacitive potential region (ΔV), and “m” is the mass of the active material. The energy density (E) and power density (P) for PPY and PNCs were estimated, respectively, through the following equations:
Here, “Cs” is the specific capacitance, ΔV is the applied initial voltage and “t” is the corresponding discharge time in hours.
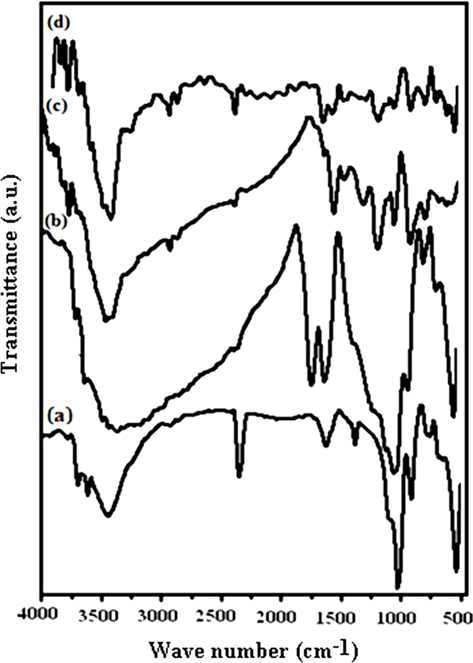
The formation of PPY, GO and respective the PNCs was clearly reflected through the FT-IR spectra (Fig. 2). Graphite shows wave numbers (cm-1) corresponding to the valence vibration of -OH (3750), vO-H due to the adsorbed moisture (3447), δO-H merged with vC=C (1628), the adsorbed carbon dioxide (2354) flexural vibration peak of CH2 (1467), and aromatic structures (880 to 750) [26,27]. GO indicates characteristic absorptions at ~3333 cm-1 (vO-H), 1723 (v COOH), 1613 (remaining sp2 character), 1378 (v C-O-C), 1221 (C-O for oxirane) and 1033 (vC-OH) (Fig. 2b) [26]. PPY shows characteristic FT-IR absorptions corresponding to νN-H (3450) [28], νC-H (2925), νsym C=C (1,652), νC-C (1465), νC-N (1550) [29], νC=C (1564) representing the formation of 2,5-substituted PPY [28,30], νC-H in-plane deformation (1397) [28] and νC-H out-of-plane deformation (672.4) [31]. The peak at 1050 is attributed to C-H deformation. The broadband at 1300 corresponds to the inplane deformation of C-H and C-N. The peaks near 1190 and 922 represent the doping state of PPY with Fe3+ [32] (Fig. 2c). PNCs prepared at 10 ± 1℃ show absorptions at 3330 (vO-H), 3430 (vN-H), 1615 (sp2 character), 1376 (vC-O-C), 1215 (vC-O oxirane), 1545 (vasC-N ring), 1185,916 (vC-N) corresponding to the doping state of PPY with Fe3+, 1460 (vC-C ring), and 1300 (δC-H in-plane) [32] (Fig. 2d). It is important to note that all the major peaks corresponding to PPY were shifted towards a lower wave number in the PNCs prepared at 10 ± 1℃. This may be related to the constrained growth and restricted modes of the vibrations in the PPY in the presence of GO due to the л-л stacking between the GO layers and the aromatic PPY rings [6].
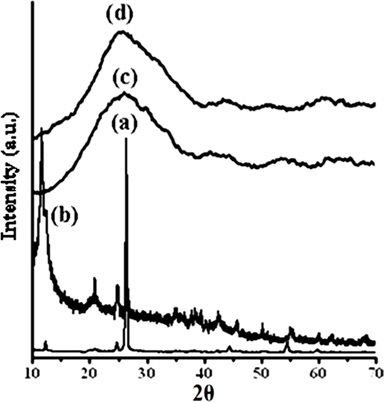
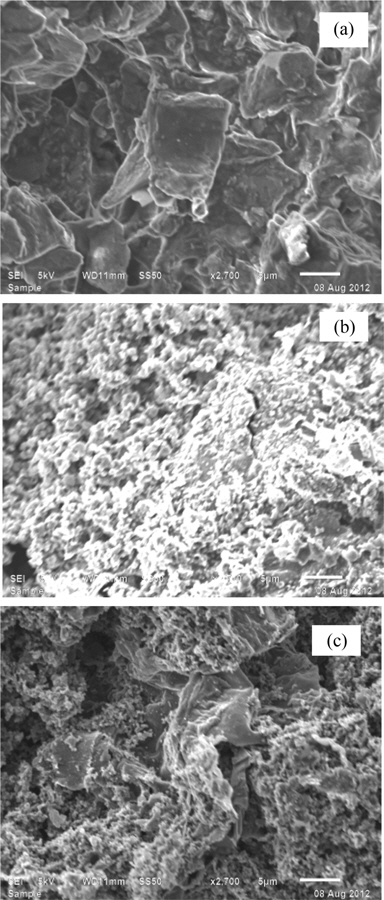
Fig. 3 shows the XRD patterns of graphite (a), GO (b), PPY (c) and [IV] (d). Graphite shows an XRD pattern of 2θ = 27.04°, corresponding to its highly organized layer structure with an interlayer distance of 0.33 nm along the (002) orientation. In addition, 2θ = 44.8 and 55°, representing the (100) and (004) planes of graphite [33] (Fig. 3a) were noted. After chemical oxidation, the (002) peak of graphite was shifted to a lower angle at 2θ = 10.80°, indicating an increase in the d-spacing from 0.33 nm to 0.82 nm (Fig. 3b). Such an increased interlayer distance between the adjacent carbon basal planes is attributed to the intercalation of oxygen functional groups into the carbon layer structure of GO. Thus, from the XRD pattern, the original graphite structure was almost completely oxidized into GO [34,35]. PPY shows a broad characteristic peak at 2θ = 27.26° (d = 0.33 nm), implying an amorphous structure [36]. With the concentration of GO, a regular increase in the gallery spacing of the PPY in the PNCs prepared at 10 ± 1℃ was observed, ranging from 0.33 to 0.34 with a shift in 2θ = 27.05° to 26.43° (Table 1). Such an increase in the gallery spacing of PPY in the respective GO is attributed to their lamination over the graphitic surface of GO [34,35]. The broad peak which appeared at 2θ = 26.43° is attributed to the amorphous characteristic of the PNCs [36]. Fig. 4a shows a SEM image of GO which reveals a crumpled and rippled structure which was the result of deformation upon the exfoliation and restacking during the processes of the oxidation of graphite [37,38]. Clear phase separation is observed in the case of PPY, and the deposited surface indicates specific porous gaps and pores as well as spheroid grain-like structures (Fig. 4b). Such a spherical morphology accounts for the satisfactory electrochemical activity of PPY [39]. The stark contrast between the respective images clearly shows that new PNCs were materialized through the intercalation of PPY in the gallery spacing of GO [21] (Fig. 4c).
[Table 1.] Effect of the composition of pncs on the grain size of PNCs prepared at 10 ± 1℃
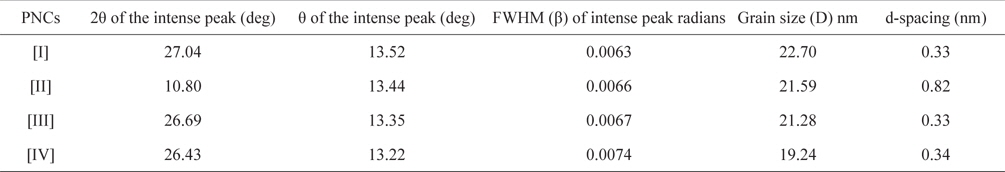
Effect of the composition of pncs on the grain size of PNCs prepared at 10 ± 1℃
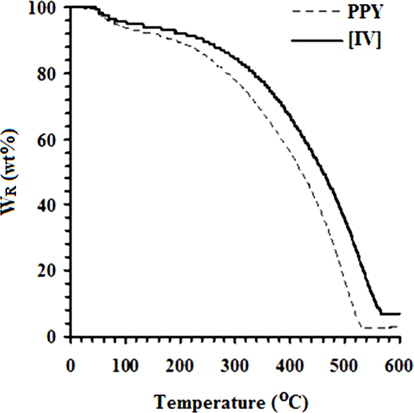
Fig. 5 shows the TGA curves of PPY and [IV] prepared at 10 ± 1℃. This figure demonstrates that the thermal stability of [IV] is significantly higher than that of PPY in the range of 40 to 600℃. Owing to its hygroscopic nature, the WL (wt%) of 6.67 at 100℃ is attributed to the moisture content associated with PPY due to the evaporation of residual water. Intercalation of various concentrations (wt%) of GO ranging from 1.0 to 4.0 into PPY afforded PNCs with a marginal moisture content ranging from 5.60 from 5.05. With an increase in the temperature, the weight loss in PYY was appeared at a TG onset (℃) of 288.87, leaving a Wr (wt%) of 93.33 [40]. The TG onset of PNCs was gradually increased in the range of 299.45 to 352.84 with the concentration of GO. The decomposition of PPY was ended with the TG endset (℃) at 525.34 with complete volatilization. The steady increase in the Wr (wt%) of PNCs in the temperature range between 100 to 250℃ is attributed to the removal of oxygenated functional groups viz., CO and CO2. Decomposition of 50% of the PNCs occurs around ~450℃ with a sudden weight loss in the range of 400 to 550℃ due to decomposition of PPY and oxygen-bearing functionalities over GO. Such a sudden weight loss in PNCs was terminated at the TG endset (℃) ranging from 532.21 to 571.54 and leaving char residue (wt%) ranging from 2.79 to 10.10. The DSC curves in Fig. 6 reveal a remarkable increase in the Tg (℃) of PNCs ranging from 26.14 to 69.08 with the concentration of GO. The weak interaction and more ordered arrangement in the matrix of the polymer and the oxide (GO) cause a regular increment in the Tg of PNCs with the concentration of GO, as compared to the PPY. The exothermic peaks in the DSC curves of PPY and PNCs were absent, indicating their thermally stable nature. Such thermal stability associated with PNCs is attributed to the orderliness of the GO intercalates into the macromolecules of PPY, as supported by XRD and SEM analyses. The deflagration of GO occurs at high temperature; therefore, the compact and ordered arrangements of GO in the molecular chains of the electroactive polymer function as a barrier to heat transport in the PNCs, thus preventing the deflagration of the polymer and pronounced thermal stability in the PNCs [25].
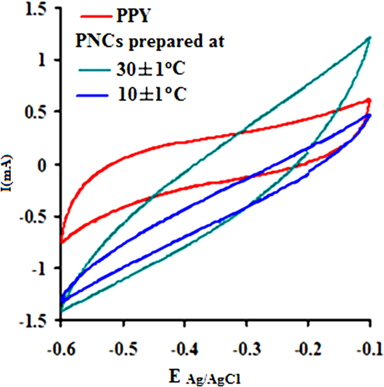
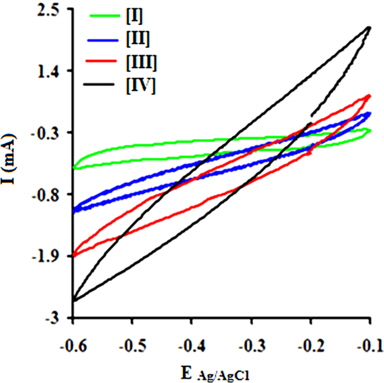
The electrochemical behavior of PPY and the respective nanocomposites was clearly indicated through cyclic voltammetry, which shows quasi-rectangular scans. The cyclic voltammogram reveals the proportionality of the peak current densities with the scan rates, indicating their high electroactive nature and reversible redox behavior. Their anodic and cathodic peak potentials were nearly independent of the scan rates. The voltammogram indicates the cycleability of both materials between the conducting (oxidized) and insulating (neutral) states with insignificant decomposition due to their high electrochemical stability. The peak potential shift in the CV may be responsible for the slow ion diffusion or interfacial charge transfer processes due to the slow heterogeneous electron transfer, the effects of local rearrangements of the polymer chains, and the slow mutual transformations of various electronic species [41]. Fig. 7a shows the CV of PPY and [IV] prepared in the presence of GO (4.0 wt%) at 30 ± 1 and 10 ± 1℃ at a scan rate (V/s) of 0.1 in a potential window of -0.1 to -0.6 V. The CV shows continuous increase in the peak current in the order of PPY followed by PNCs prepared at 30 ± 1 and 10 ± 1℃, respectively [41].
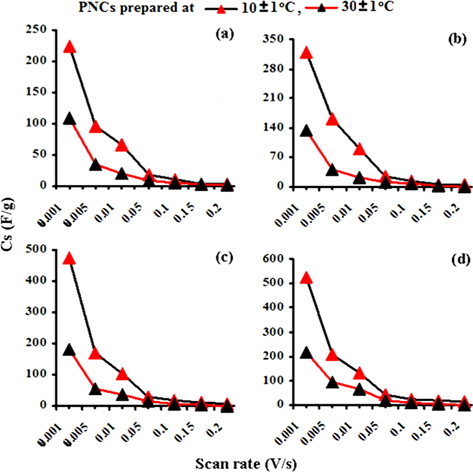
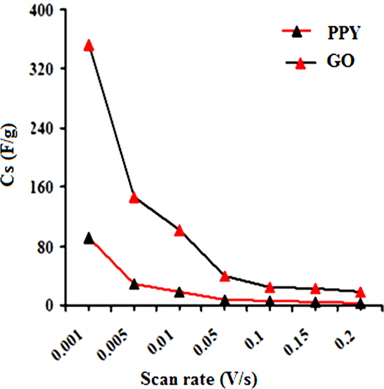
A regular increase in the peak currents for PPY and PNCs was observed in the potential range from -0.6 to -0.1 with the scan rate. Such an increase in the peak current was more pronounced for PNCs prepared at 10 ± 1℃ over those prepared at 30 ± 1℃ [13-19] (Fig. 7a). The effects of the concentration of GO contributed to the peak current of the PNCs prepared at 10 ± 1℃ at a constant scan rate (Fig. 7b). Fig. 7c represents a comparison of the specific capacitance of PPY (8.35-109.33 F/g) with GO (17.68-352.32 F/g), which was judged to be higher later at all scan rates (0.001-0.2 V/s). With an increase in the concentration of GO, a regular increase in the cathodic and anodic currents was observed. This contributed to a corresponding increase in the Cs of the PNCs prepared at 30 ± 1℃ and 10 ± 1℃. A comparative study of the effect of the temperature along with the scan rate reveals that all of the PNCs prepared at 10 ± 1℃ show a remarkable increase in the specific capacitance (223.73-526.43 F/g) over those prepared at 30 ± 1℃ (109.02-217.69 F/g) (Fig. 7d). With an increase in the concentration of GO, a regular increase in the Cs (F/g) of PNCs was observed at all individual scan rates, which gradually declined with a regular increase in the scan rate. The decrease in Cs at an increasing scan rate in CV is attributed to the restricted diffusion of the charge, which induces a reduction in Cs and a high power density of PNCs. The energy (Wh/Kg) and power densities (W/Kg) rendered by PPY were 3.79 and 136.44, respectively. The energy density of the [IV] prepared at 30 ± 1 and 10 ± 1℃ were on the order of 7.56 and 18.28, and 279.43 and 731.19, respectively.
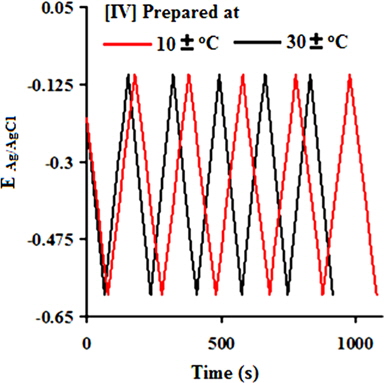
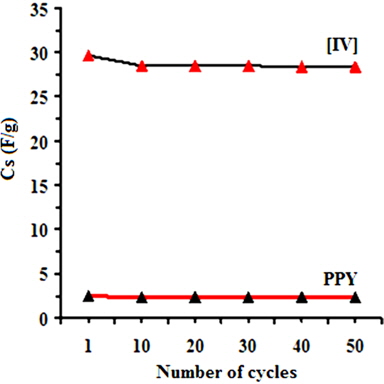
Fig. 7e shows charging-discharging curves of [IV] prepared at 30 ± 1 and 10 ± 1℃ recorded in the voltage range from -0.6 V to -0.1 V at an applied current density of 10 mA/cm. The charge/discharge curves exhibit reversible characteristics without an apparent deviation in each cycle. The charge/discharge curves are nearly linear along the total range of potential with constant slopes, showing perfect capacitive behavior. This suggests better electrochemical stability of the electrodes derived from PNCs which were prepared at 10 ± 1℃. The capacitive decrease of ~4% during the first 500 cycles at a 0.1 V/s (Fig. 7f) indicates the excellent cyclic stability of the PNCs for supercapacitor applications. Thus, the introduction of GO at a low temperature of 10 ± 1℃ had afforded PNCs with improved specific conductivity and power density, making them suitable for supercapacitor applications.
CTAB-assisted dilute-solution polymerization of pyrrole at various temperatures in the presence of varying concentrations of GO (wt%) ranging from 1.0 to 4.0 with FeCl3 as an oxidant afforded a series of PPY/GO nanocomposites (PNCs). Fourier-transform infrared spectrography reveals the formation of PNCs. This study, based on the X-ray diffraction spectra and scanning electron microscopy, indicates the intercalation of GO into a PPY matrix. The electrocapacitive performance of PNCs prepared at various temperatures was investigated through cyclic voltammetry at scan rates (V/s) ranging from 0.2 to 0.001 in KOH (1.0 M). With an increase in the concentration of GO, the PNCs prepared at 10 ± 1℃ show a regular increase in their thermal stability, electrochemical supercapacitance (Cs), and power densities compared to PPY and PNCs prepared at 30 ± 1℃. With an increase in the scan rate, a proportionate increase in the peak current densities of PNCs with cycleability of the redox behavior without significant decomposition was observed. Their anodic and cathodic peak potentials were nearly independent of the scan rates. PPY and GO showed respective Cs (F/g) values in the ranges of 109.33-8.35 and 352.32–17.68, respectively. The highest Cs of 526.33 at 0.001 V/s was shown by [IV] prepared at 10 ± 1℃, with stability up to 500 cycles. The energy density (Wh/Kg) and power density (W/Kg) of [IV] were 18.28 and 731.19, respectively, which were much higher than the corresponding nanocomposite prepared at 30 ± 1℃.

![Fourier-transform infrared spectra of (a), graphite (b), graphene oxide (c), polypyrrole and (d) [IV].](http://oak.go.kr/repository/journal/13521/HGTSB6_2014_v15n3_171_f002.jpg)
![X-ray diffraction spectra of (a) graphite, (b) graphene oxide, (c) polypyrrole and (d) [IV].](http://oak.go.kr/repository/journal/13521/HGTSB6_2014_v15n3_171_f003.jpg)
![Scanning electron microscopy images of (a) graphene oxide, (b) polypyrrole and (c) [IV] at 5 μm, 2.7 KX.](http://oak.go.kr/repository/journal/13521/HGTSB6_2014_v15n3_171_f004.jpg)

![Thermogravimetric analysis curve of polypyrrole (PPY) and [IV] prepared at 10 ± 1℃.](http://oak.go.kr/repository/journal/13521/HGTSB6_2014_v15n3_171_f005.jpg)
![Differential scanning calorimetry scans of polypyrrole (PPY) and [IV] prepared at 10 ± 1℃.](http://oak.go.kr/repository/journal/13521/HGTSB6_2014_v15n3_171_f006.jpg)


![Effect of the scan rate on the specific conductance values of (a) [I], (b) [II], (c) [III] and (d) [IV]. PNC: polymer nanocomposites.](http://oak.go.kr/repository/journal/13521/HGTSB6_2014_v15n3_171_f010.jpg)
![Charge-discharge curves at 10 mA/cm of [IV].](http://oak.go.kr/repository/journal/13521/HGTSB6_2014_v15n3_171_f011.jpg)
![Effect of the number of cycles on the Cs values ofpolypyrrole (PPY) and [IV] prepared at 10 ± 1℃.](http://oak.go.kr/repository/journal/13521/HGTSB6_2014_v15n3_171_f012.jpg)