Advanced technologies have played a greater role in the progress of business firms in enhancing their profitability, but much less attention has been paid to addressing environmental concerns. Environmental pollution is one of the greatest concerns of the 21st century. Among the many environmental issues, water pollution is of great concern since water is the prime necessity of life and extremely vital for the survival of all living organisms. Despite various awareness programs and campaigns, water pollution is on the rise owing to continually increasing amounts of industrial wastage and waste from domestic sewage.
The textile industry uses huge quantities of water in all processing operations. Almost all dyes, specialty chemicals, and finishing chemicals are applied to textiles in water baths. Most of the fabric preparation steps, including desizing, scouring, bleaching, and mercerizing, use water. Furthermore, each of these steps involves thorough washing of the fabric to remove all chemicals used [1]. The water used in the processing is usually returned to the environment without proper treatment. The textile industry releases huge amounts of colored effluent daily. Wastewater released by these industries pollutes the fresh water of streams, ponds, and rivers, as well as underground water bodies. Dyes are used widely in many industries such as textile production, dyestuff manufacturing, leather tanning, food preparation, paper production, and printing in order to give color to their products.
Every year tons of dyes are produced worldwide and significant amounts of the total production are lost in wastewater during synthesis and processing. This release of high colored effluents into natural water has become a serious environmental problem. Specifically, highly colored effluents into natural water bodies obstruct light penetration, disturbing biological processes within them [2]. In addition, many dyes are toxic to various organisms, causing direct damage to aquatic species in particular. Some dyes can cause allergic dermatitis, skin irritation, cancer, and mutation in humans also [2,3]. Dealing with these types of pollution is therefore very important, especially in developing countries.
Adsorption is one of the effective methods for the removal of dyes from waste effluent. The process of adsorption is advantageous over other methods because it is sludge-free, offers clean operation, and the dyes are completely removed, even from diluted solutions. Activated carbon (powdered or granular) is the most widely used adsorbent because it has excellent adsorption efficiency for organic compounds. However, commercially available activated carbons are expensive. This has recently prompted many studies on production of low cost alternatives adsorbents. A number of agricultural waste types and byproducts of cellulosic source have been studied for their capacity to remove dyes from aqueous solutions. Soil nano-clays [1], bagasse (waste material from sugar cane) [2], waste wood pallets [4], raw bagasse, and tartaric acid-modified bagasse [5], tamarind fruit shell [6], rice husk, cotton, bark, hair and coal [7], raw pummelo peel [8], ghassoul, natural clay [9],
In the present study the adsorbent used was LGA. Lemon grass waste was collected from a lemongrass oil distilled subunit in Trashi Gang, Bhutan. The adsorbent was washed thoroughly with normal water and with distilled water to remove dust and other impurities. The washed adsorbent was dried in a hot air oven at 60℃ to remove the moisture content. The dried lemon grass waste was made from ash in a muffle furnace at 500℃ for 2 h and was stored in an air tight plastic container for further use. The adsorbent was sieved through an I.S.70 mesh screen (70 μm) prior to its use.
2.2. Adsorbent Surface Characterization
The characteristics of the adsorbents were examined using a scanning electron microscopic (SEM) analysis, energy dispersive X-ray spectroscopy (EDX), and Fourier transform infra-red (FT-IR) spectroscopy. In order to obtain a clear picture of the particle size and the external surface of the material images of the adsorbent were taken with a SEM (model: ZEISS EVO-40 series SEM: Carl Zeiss SMT Ltd., Cambridge, England) at different magnifications. The images were taken for a pure adsorbent as well as after interaction with the dye. The chemical compositions were analyzed by EDX. For this EDX with an X-Flash Silicon Drift Detector-4010, 10 mm2, type 1106 Bruker AXS, Germany was used. FT-IR spectra of LGA were obtained using a Fourier transform infrared spectrophotometer (Shimadzu- 8400s) to elucidate the functional groups present in LGA. For measuring IR spectra, the powdered LGA was encapsulated in a KBr pellet and spectra were obtained in a range of 400 to 4000 cm−1.
Stock solutions of methylene blue and crystal violet were prepared by dissolving 1 g of the respective dye in 1 L of the double distilled water (1000 mg/L). The solutions were used to make desired concentrations using double distilled water. The pH adjustments were made using hydrochloric acid and sodium hydroxide.
Batch mode experimental studies were carried out with a known weight of the adsorbent in 50 mL of working solution of different concentrations (100-600 mg/L) in a 100 mL conical flask with a stopper. These flasks were kept in a thermostatic shaker maintained at a temperature of 25℃ and 150 ± 10 rpm for sufficient time to achieve equilibrium. After equilibration, the adsorbent was separated by centrifugation at 1800 ± 100 rpm for 10 min and the aqueous phase concentration of the dyes was analyzed using a UV-VIS spectrophotometer (Shimadzu-1800) by observing optical density at 662 nm. This process was repeated to determine the effects of different adsorption parameters such as adsorbent dose (0.1-0.55 g/50 mL), pH (3-10), an contact time by keeping all other parameters at fixed values.
Adsorption isotherms can be use to determine the feasibility of using an adsorbent for a particular application. They are described by a plot between the amount of adsorbate adsorbed per unit weight of adsorbent (Qe) versus the equilibrium concentration of the adsorbate (Ce).
The sorption equilibrium (Qe) uptake capacity in mg/g for each sample is calculated according to mass balance and is expressed as
where Co and Ce are the initial and equilibrium concentrations of dyes, respectively, m is the mass of adsorbent, and V is the volume of solution in liters [20].
Langmuir and Freundlich isotherms are the most frequently used isotherms. Langmuir isotherms describe the adsorption of adsorbate onto the surface of the adsorbent with the following assumptions [19]:
1) The surface of the adsorbent is in contact with a solution containing an adsorbate that is strongly attracted to the surface.2) The surface has a specific number of sites where the solute molecules can be adsorbed.3) The adsorption involves the attachment of only one layer of molecules to the surface, i. e. monolayer adsorption.
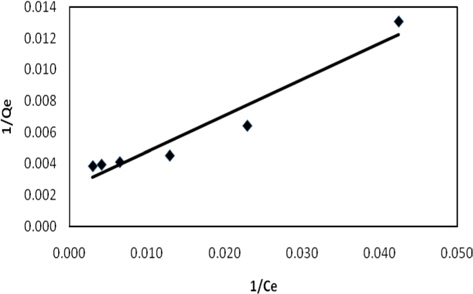
The linear form of the Langmuir model is represented as follows:
The constant Q signifies the adsorption capacity (mg/g) and b is the energy of adsorption (L/gm). The plot of 1/Qe verses 1/Ce gives a straight line of the slope 1/bQ and intercepts 1/Q.
Langmuir adsorption is also expressed in terms of a dimensionless separation factor RL [21] and is defined as
where Co is the highest initial dye concentration (mg/L) and b is the Langmuir constant. The parameter RL indicates the isotherm shape according to the adsorption characteristics: RL > 1, the process is unfavorableRL = 1, the process corresponds to linear relationship0 < RL > 1, the process is favorableRL = 0, an irreversible process
The Freundlich adsorption isotherm is an adsorption isotherm, which is a curve relating the concentration of a solute on the surface of an adsorbent to the concentration of the solute in the liquid with which it is in contact [19]. The Freundlich adsorption isotherm in linear form is expressed as:
where KF is an indicator of adsorption capacity: the higher the maximum capacity, the higher the KF.
1/n is a measure of intensity of adsorption. A higher 1/n value indicates more favorable adsorption.
The linear forms of Lagergren pseudo-first order and pseudosecond order adsorption kinetic models were tested with the data obtained in the study for the effect of variation in contact time.
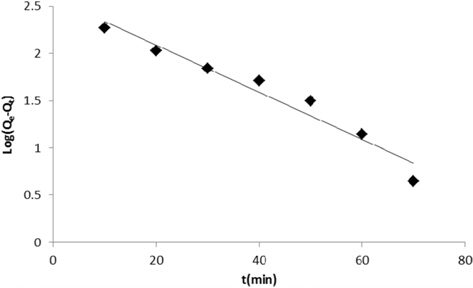
The linearized form of the pseudo-first order Lagergren equation can be presented as
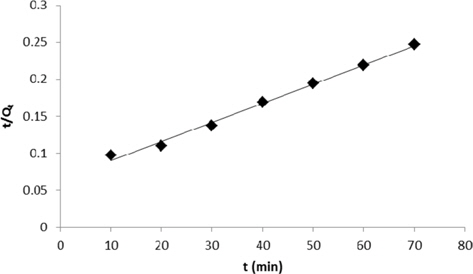
and the linearized form of the pseudo-second order Lagergren equation is expressed as
where Qe is the mass of dye adsorbed at equilibrium (mg/g), Qt is the mass of dye adsorbed at time t (mg/g), k1,ads is the pseudo first-order reaction rate of adsorption (per minute), h is k2 Qe 2, and k2 is the pseudo-second-order rate constant of adsorption mg/g/min [22].
3.1. Characterization of adsorbents
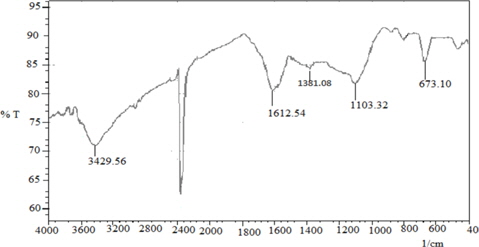
3.1.1. FT-IR
FT-IR spectra are shown in Fig. 1. The absorption peak at 3429.56 corresponds to -OH stretching vibrations, the peaks at 1612.54 cm−1 and 1381.08 cm−1 correspond to C=C stretching and CH3 bending vibration, and the peak at 1103.32 is C-O stretching vibrations, respectively. As methylene blue is a cationic dye, the –OH functional group on the surface of LGA may increase the interaction between the adsorbent and the adsorbate, which contributes to the adsorption of methylene blue.
3.1.2. Surface characterization of adsorbent (LGA)
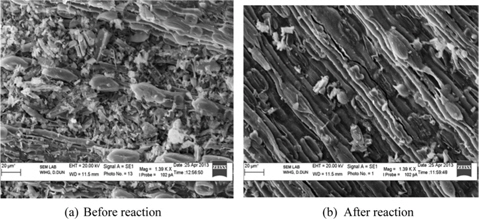
Surface morphology of LGA was analyzed by SEM and is represented in Figs. 2a and b. Fig. 2a clearly indicates that before the reaction LGA has a fibrous irregular structure and is in a pellet form. The length of the fiber ranges from 37 μm to 230 μm and the width is 6.8 μm; the range of pellet size is between 4.9 μm and 14.9 μm. Space between these fibers and pellets may serve as adsorption sites. These size ranges were analyzed on three different SEM images taken at various magnifications. After the reaction (Fig. 2b) the irregular structure was observed to be a regular fibrous structure, which indicates that the dye uniformly adsorbed on the surface of the adsorbent.
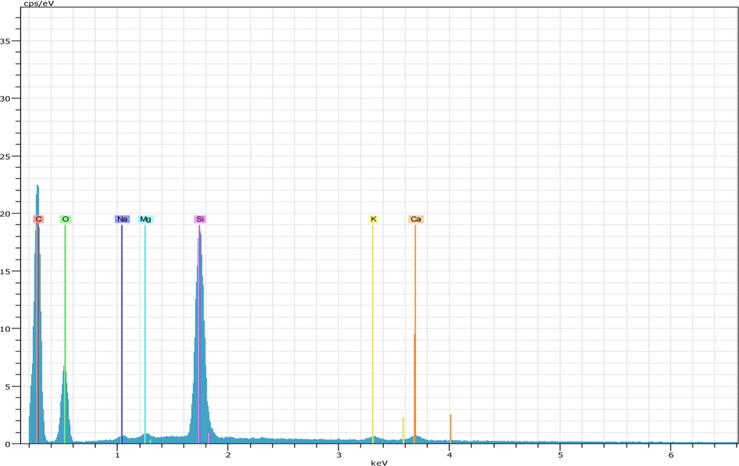
3.1.3. EDX
Elemental analyses of the adsorbent were carried out using EDX and the results are listed in Table 1. The oxygen content is high (41.44%), which indicates that adsorption is favorable.
[Table 1.] Chemical composition obtained from energy dispersive X-ray spectroscopy analysis
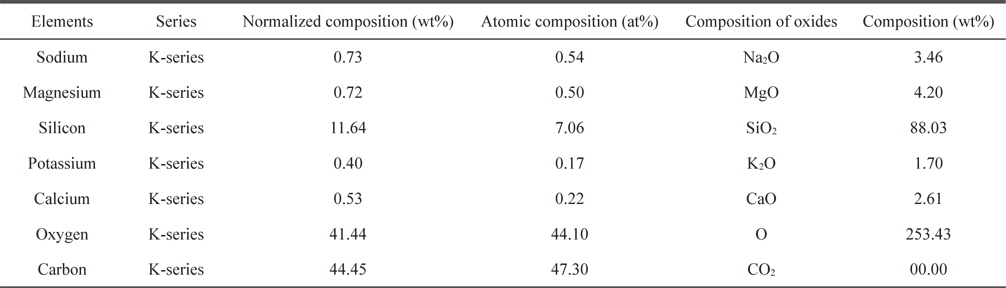
Chemical composition obtained from energy dispersive X-ray spectroscopy analysis
3.2. Effect of contact time on adsorption
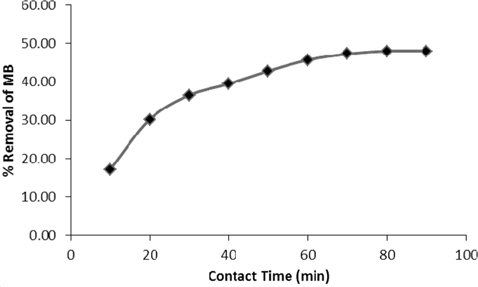
The effect of initial dye concentration with contact time on the adsorption of methylene blue is represented in Fig. 4. The percentage removal is rapid in the first 10 to 20 min and then becomes slow. Percentage removal increased from 17.2% to 48.05% in 80 min and the amount of dye adsorbed per gram of adsorbent (Qe in mg/g) also increased, from 103.78 to 288.302. After 80 min, very little change in the equilibrium concentration was noted. This may be due to the availability of a greater number of vacant adsorption sites at the initial stage. For further batch studies, the equilibrium time was set to 90 min.
3.3. Analysis of effect of pH on adsorption
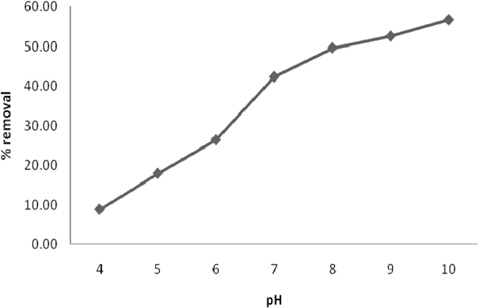
The sorption of methylene blue onto the adsorbent surface is influenced by the surface charges on the adsorbent and the initial pH of the solution [23]. Fig. 5 shows that the uptake of dye increases consistently with an increase in pH of the dye solution. Percentage removal of dye was increased from 8.82% at pH 1 to 56.72% at pH 10. As the pH of the solution increases (pH 4-10), the surface charge density decreases and the electrostatic repulsions between the adsorbent and the positively charged basic dyes also decrease, thereby increasing the extent of adsorption. Thus there exists an electrostatic attraction between the positively charged cationic methylene blue molecules and negatively charged surface of the adsorbent, which favors adsorption of the methylene blue [24]. Similar results have been reported elsewhere [19].
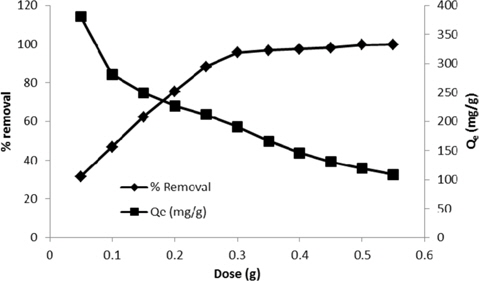
3.4. Effect of adsorbent dose on initial concentration
The adsorption of methylene blue studied by varying the adsorbent dosage is represented in Fig. 6. The results indicate that there is an increase of the percentage removal (31.7% at 0.05 g/100 mL to 99.81 at 0.55 g/100 mL) with an increase of the adsorbent dose. This could be due to increased availability of surface active sites resulting from the increased dose and conglomeration of the adsorbent [21]. On the other hand, the value of Qe also decreased from 380 to 108.2 mg/g at 0.05 and 0.55 g/100 mL respectively. The decrease in the amount of dye adsorbed per gram of the adsorbent (Qe) with an increase of the adsorbent dose is mainly due to unsaturation of adsorption sites through the adsorption process [25].
3.5. Effect of initial concentration of dye
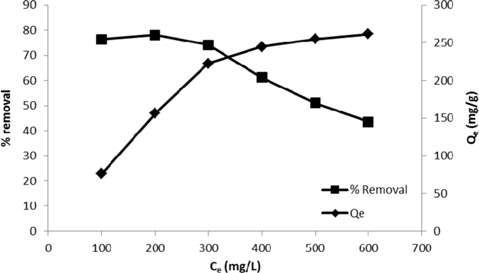
The effect of the initial concentration of the dye was observed by varying the initial dye concentration from 100 to 600 mg/L and keeping all other conditions constant. It was observed that the percentage removal decreased (76.4 to 43.6%). This reveals that there is a reduction of immediate solute adsorption due to the lack of available active sites required for high initial concentration of the dye. Initially, dye molecules rapidly reach the boundary layer by mass transfer; they then slowly diffuse from the boundary layer onto the adsorbent because many of the available sites have been occupied, and they diffuse into the porous structure of the adsorbent. In contrast, the amount of dye adsorbed per gram of the adsorbent (Qe) increased (76.4 to 261.4 mg/g) with an increase in the initial concentration of the dye. An increase in the initial concentration of the dye contributes to the driving force to overcome mass transfer resistance of ions between the adsorbent and bulk fluid phases, which in turn increases the uptake of dye molecules. Moreover, the number of collisions between dye molecules and the adsorbent also increases, resulting in an increase of the adsorption [19].
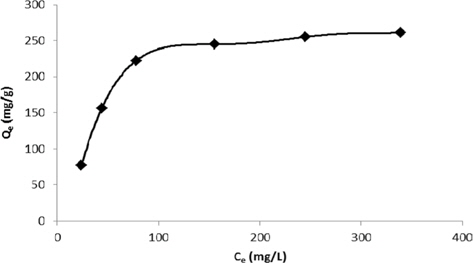
The adsorption data are usually described and modeled using standard adsorption isotherms. They relate the amount of dye adsorbed per unit weight of the adsorbent to the equilibrium concentration of the bulk phase. Fig. 8 presents the adsorption isotherms, which are similar to a type I adsorption isotherm. This indicates that the adsorbent pore size was approximately equal to the molecule size of the adsorbate.
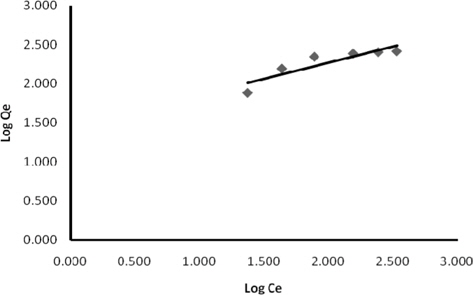
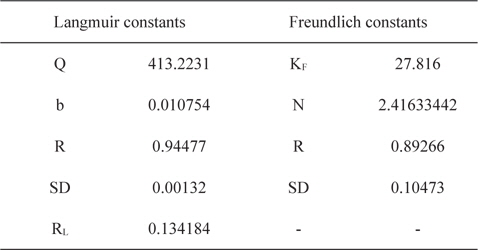
Experimental data for batch adsorption studies were applied to the Langmuir (Fig. 9) and Freundlich models (Fig. 10). The results obtained from the Langmuir and Freundlich isotherms indicated strong adsorption capacity of lemon grass ash for methylene blue. Adsorption constants for the Langmuir (b and Q) and Freundlich isotherms (KF and n) were calculated from the slope and intercept and are given in Table 2. The data fitted the Langmuir isotherm better than the Freundlich isotherm, as indicated by the ‘R’ values in Table 2. A special parameter ‘RL’ was also calculated and its value for methylene blue was found to be 0.134; the value is between 0 and 1, and thus indicates that the adsorption process was favorable.
[Table 2.] Langmuir and Freundlich constants for methylene blue using lemon grass waste ash

Langmuir and Freundlich constants for methylene blue using lemon grass waste ash
Values of Langmuir adsorption capacities (Q) were compared with the values already reported for methylene blue obtained using various low cost materials [19] and it was found that LGA has either comparable or better adsorption capacities than many previously reported low cost materials.
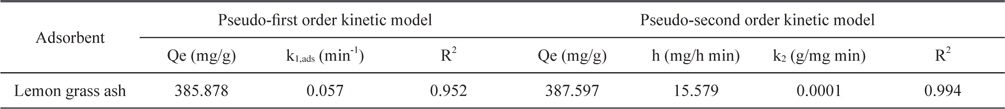
Adsorption data obtained from the variation in contact time were fitted to the Lagergren pseudo-first order and pseudosecond order adsorption kinetic models and the results are presented in Figs. 11 and 12. Correlation coefficients (R2) for the Lagergren pseudo-first order and pseudo-second order kinetic plots were found to be 0.952 and 0.994, respectively. From these linear plots, values of Qe and rate constants were calculated and are presented in Table 3. From the values of R2, it is clear that the pseudo second order model fits better than the first order kinetic model.

Constants for Lagergren pseudo-first order and pseudo-second order adsorption kinetic model
In this study, the “removal of color from wastewater using a low cost adsorbent” was performed by using lemon grass ash. The results of the study reveal that the adsorption process using LGA is a very effective process for the decolorization of methylene blue from wastewater, and it was observed that within 90 min LGA removed 50% of methylene blue relative to the initial concentration. The results also indicated that the adsorption process was also enhanced by varying the parameters. The parameters used to investigate the adsorption process were adsorbent dose, contact time of adsorbent with dye solution, initial dye concentration on adsorbent, and pH. The test results for these parameters revealed that lemon grass ash strongly influences the adsorption process. The test results are summarized as given below: 1) The results showed that the removal capacity of the adsorbent to remove dye increased with an increase of its dose.2) The effect of contact time between the adsorbent and the adsorbate showed that with greater duration of contact, the removal of dye from the solution was increased. Equilibrium was achieved at 80 min.3) The amount of dye adsorption increases with an increase in the concentration and the percentage removal decreases exponentially with an increase in the concentration.4) The result of pH study shows that the adsorption process is effective at higher pH.5) Langmuir and Freundlich isotherm parameters (R2 ≈ 0.94, n > 2, RL = 0.1348) confirmed that the adsorption of methylene blue on LGA was favorable.6) Adsorption kinetics of Lagergen pseudo second order model was found to be best fitting kinetic models.
Therefore, the use of lemon grass ash as an adsorbent for the removal of methylene blue from aqueous solutions is recommended as it is not only economical but also an effective alternative to conventional methods.