Today, humans spend a lot of time in their automobiles. Volatile organic compounds (VOCs), which are generated from the interior materials of an automobile, have a significant impact on human health; thus, the need to prevent them from penetrating into the human body has increased. The main VOCs emitted from the interior materials of new automobiles include formaldehyde, toluene, benzene, styrene, xylene, ethylene, and acetaldehyde. Kim and Lee [1] reported that toluene among the indoor air pollutants of newly delivered automobiles was approximately 285 mg/m3 on average; thereby causing fatigue, headaches, eye irritation, agitation, insomnia, and a loss of appetite, walking difficulty, nausea and death at high concentrations. Kouichi and Shinichi [2] removed a sheet made out of vinyl chloride within one week from a newly delivered Japanese automobile and measured the emission amounts of VOCs. He reported that various types of chemicals were detected from luxury automobiles, with toluene on average at 2429 μg/m3 and the total amount of VOCs was 9850 μg/m3 . Lee
Activated carbon fiber (ACF) is a new type of adsorbent. All of the pores developed on the ACF are micropores and are mutually connected from the surface to the internal side; thus, the specific surface area of this type of fiber is very large and the mass transfer resistance is very low. Its adsorption speed of VOCs is known to be 100 times or more than that of AC [5]. Furthermore, the shape is either woven or non-woven; thus, it would be appropriate to apply it as a face filter. Son
Therefore, the purpose of this study is to investigate the adsorption of VOCs using ACF filters in newly produced automobiles. To this end, first, an ACF non-woven filter and two other commercial air clarifier filters were put into a batch gas bag to compare the adsorption capacity of VOCs, and second, the toluene adsorption behaviors of ACF were investigated under a continuous flow of toluene vapor containing air through an ACF packed bed under several conditions.
Non-woven ACF (MD-1100, Sutong Co., China, and KF-1500, Toyobo, Japan) filters were prepared. Two types of non-woven filters (PP, PP+AC) commercially used in automobiles were also prepared. ACF filters were placed in a desiccator after being dried for 24 h in an oven and were maintained at 200℃. The pore size distributions of the as-received ACFs were measured by Brunauer-Emmett-Teller (BET) specific-surface-area measuring equipment (BELSORP-max, Japan). The formaldehyde, benzene, and toluene used in this study were reagent-grade materials (Aldrich Co., >99.5%).
The adsorption capacities of VOCs for the three types of filters were measured by a tube-type gas detector in a batch gas bag following the KSI method [11]. The three types of filters (76 g ACF filter, 40 g PP filter, and 127 g PP+AC) were put into a batch gas bag and were maintained at a constant temperature. Formaldehyde, toluene, and benzene were injected into the 5 L gas bag at initial concentrations of 15, 20, and 20 ppm, respectively. Two hours later, each concentration was detected and the adsorption rate was calculated by the following Eq. (A):
Cb : Blank, concentration of experimental gas that remained ∈ the experimental gas bag after 2 hoursCs: Specimen, concentration of experimental gas that remained ∈ the experimental gas bag after 2 hours
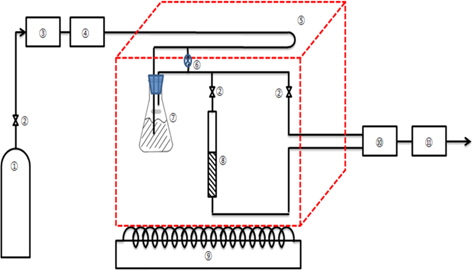
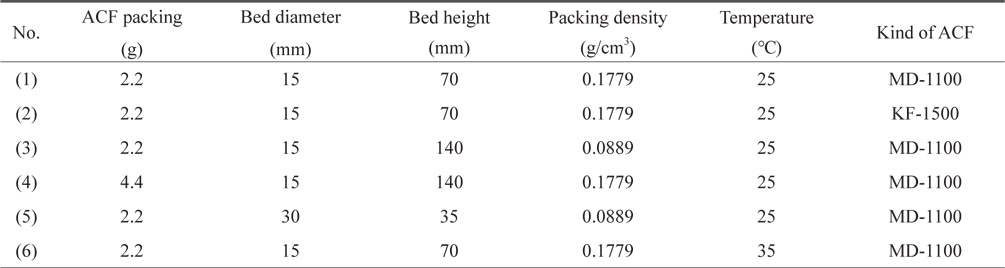
The continuous adsorption behaviors of toluene through the ACF packed bed were assessed with the experimental apparatus shown in Fig. 1. The main parts of the apparatus contained a mass flow controller (MFC, ④) of air, a toluene vapor generator ⑦ and the ACF packed bed ⑧ in a constant-temperature chamber ⑤, as well as analysis units ⑩ ⑪ for the toluene vapor in effluent. A flask was completely filled with liquid toluene ⑦ and vapor was generated by dry air. A glass tube adsorption bed (15 and 30 mm in diameter and 200 mm in length) was packed with ACF. Dried air was supplied at 2 L/min by a MFC. This air circulated for a long time in the temperature-controlled chamber, and some proportion of the air was directly injected into the toluene-generating container while another part of the air was separated by a flow meter ⑥ and mixed with the air containing the toluene vapor, such that the concentration of toluene in the air could be controlled before entering the ACF packed bed. The chamber was maintained at 25℃ or 35℃. When the air flow rate to the toluene-containing flask was maintained at 1 L/min., the initial concentrations (Co) of toluene to be inserted into the ACF packed bed were approximately 195-205 ppm (25℃) and 390-405 ppm (35℃). Therefore, the initial concentrations were fixed at 200 ppm (821.4 mg/m3) and 400 ppm, respectively, by controlling the separated air flow with a flow meter ⑥. For the connections of each device, a quarter-inch Teflon tube was utilized and glass wool with a thickness of 3-mm was inserted above the bottom of the ACF packing bed. The experimental conditions for the continuous adsorption behaviors are summarized in Table 1.
The toluene concentration in the effluent was measured by a VOC concentration measurement device (Indoor Air Quality Monitor, IAQRAE, USA, 0.01-500 ppm), as shown in Fig. 1, and was plotted by breakthrough curves. The break point (tb) was selected at 5% of the initial toluene concentration. The break point time, the maximal adsorption capacity (We), and the valid adsorption rate at the break point were obtained from breakthrough curves under several experimental conditions. The adsorption capacity was analyzed in relation to the pore size distribution of the ACFs. The adsorption mechanism of toluene by the ACF was analyzed by inserting the adsorption behaviors and data into the well-known Yoon and Nelson equation [12].
[Table 1.] Experimental condition
Experimental condition
3.1. VOCs adsorption of various filters in a gas bag
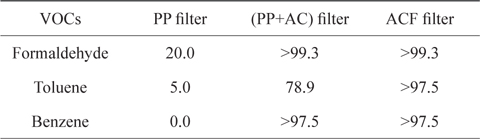
The adsorption capacities of VOCs by three non-woven filters in a batch gas bag were measured by a gas detecting tube [11], as summarized in Table 2. The PP non-woven filter could only remove 20% of the initial amount of formaldehyde, whereas it was not able to remove any of the toluene or benzene. For the (PP+AC) non-woven filter, the removal rates of formaldehyde and benzene we re good; however, the removal rate of toluene was not as good, as it left 78.9% of the initial concentration. On the other hand, the ACF non-woven filter removed more than 97.5% of all VOCs used in the experiment. From a previous report [10], the ACF filter shows relatively good removal capacity of microparticles (PM2.5) and carbon dioxide in automobiles. Therefore, ACF can be used as a promising adsorbent for the removal of contaminants in automobiles. However, the quantitative removal capacities of the VOCs are needed in accordance with time and other variables. Thus, follow-up experiments were performed to investigate the removal capacity of toluene from an air flow containing toluene vapor through an ACF packed bed. measured by FITI Testing & Research Institute [11].
[Table 2.] Removal efficiency of VOCs by three types of filters (%)

Removal efficiency of VOCs by three types of filters (%)
3.2. Toluene adsorption capacity of different types of ACFs
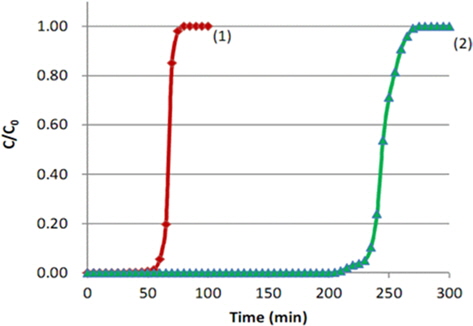
Fig. 2 shows the breakthrough curves of toluene on the ACF bed. Both ① the MD-1100 ACF and ② the KF-1500 ACF show rapidly increasing curves after the break point; indicating that toluene adsorption progresses in a narrow mass-transfer zone [13] as most of the pores which developed on the surface of ACF are micropores. For this reason, toluene adsorption occurred very rapidly according to the micropore filling theory of Dubinin [14]. When setting 5% of the initial concentration as the break point (tb), break point times of the two ACFs were 61 min and 230 min. The break point of KF-1500 was 3.76 times longer than that of MD-1100, because the specific surface area of KF-1500 was larger than that of MD-1100. In general, the KF-1500 on the market has a specific surface area of 1500 m2/g, whereas MD-1100 has a specific surface area of 1100 m2/g. It appears that the specific surface area of KF-1500 was 1.36 times greater than that of MD- 1100. However, the break point time of KF-1500 was far longer than that of MD-1100, which suggested a need to review the micropore size distribution more thoroughly. Therefore, the adsorption isotherms of two ACFs were reanalyzed.
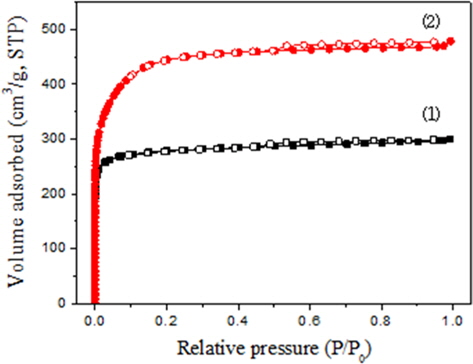
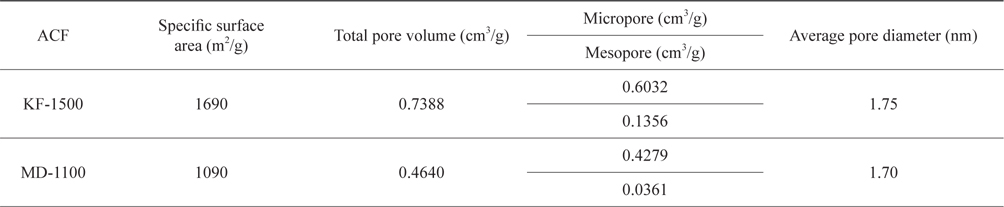
Fig. 3 shows the nitrogen adsorption isotherms of two ACFs at 77 K, and Table 3 is the BET characteristics of the two ACFs. Both ACFs show rapid nitrogen adsorptions in a low range of the relative pressure (P/Po), reaching a plateau and showing typical Type 1 isotherm characteristics. In other words, the pores developed on the surface are mostly micropores. The total amounts of nitrogen adsorption at the plateau were about 300 cm3/g and 470 cm3/g, respectively. Therefore, the specific surface areas of the two ACFs were 1690 m2/g and 1090 m2/g, respectively. The specific surface area of KF-1500 was 1.55 times larger than that of MD-1100, which is coincident with the total pore volume ratio.
[Table 3.] Adsorption characteristics of KF-1500 and MD-1100

Adsorption characteristics of KF-1500 and MD-1100
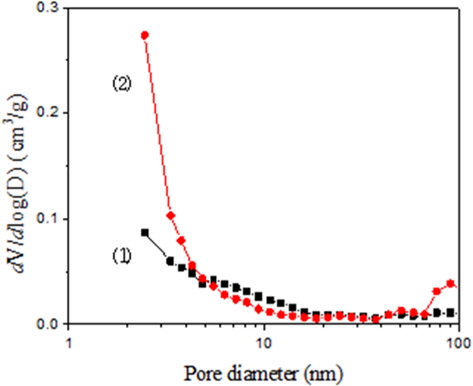
The micropore volume of KF-1500 was 1.41 times larger. However, it is important to note that the mesopore volume of KF-1500 was 3.76 times larger than that of MD-1100. The ratio of these mesopores was equivalent to the ratio of the adsorption capacity at the break point time. Therefore, the adsorption of toluene depends on the number of mesopores. On the other hand, the pore size distributions of ACFs should be more carefully studied. Fig. 4 shows the distribution of mesopores obtained from the Barret-Joyner-Halenda (BJH) equation. The mean pore diameter of KF-1500 is 1.75 nm, which is similar to MD-1100 at 1.70 nm; however, the pore size of MD-110 was widely distributed from 1.0 nm to 20 nm and the number of pores between 2.0 nm and 5.0 nm was relatively low. Whereas for KF-1500, the number of pores between 2.0 nm and 5.0 was very large, resulting in large mesopore volume, which contributed to extended the break point time for the adsorption of toluene. The adsorption of toluene appeared to be affected largely by the capillarity condensation phenomenon by mesopores in addition to the micropore filling. In fact, there is slight hysteresis on the adsorption isotherm of KF-1500, providing evidence of the existence of mesopores.
The breakthrough curves of both ACFs in Fig. 2 show drastic “S” shapes due to the break points and became equivalent to the initial concentration soon after. As mentioned above, this is due to the capillary condensation and micropore filling of toluene with a narrow mass transfer zone. This drastic “S” shape indicates that the adsorption has progressed very rapidly, thereby reaching the theoretical adsorption capacity of the adsorbents. In such a case, the maximum adsorption capacity (We) can be obtained from the adsorption amount of C/Co = 0.5. In Fig. 2, the adsorption times at C/Co = 0.5 were 72 min and 243 min, respectively. Thus, when the initial concentration of toluene was 200 ppm and the air flow rate was maintained at 2 L/min, the adsorption amount of toluene by MD-1100 ACF at the break point (61 min) was 45.55 mg/g-acf and the maximum adsorption capacity at C/Co = 0.5 was 53.77 mg/g-acf. However, those of KF-1500 ACF were 171.8 mg/g-acf and 181.5 mg/g-acf, respectively. Therefore, the adsorption capacity of toluene by MD-1100 at the break point was 84.7% of the maximal adsorption capacity, whereas the adsorption capacity by KF-1500 at the break point was 94.7% of the maximal adsorption capacity. Thus, the adsorption efficiencies of the two ACFs were very high. On the other hand, the initial toluene concentration of 200 ppm in air is converted into 821.43 mg/m3 by the following Eq. (B):
Baek
3.3. Toluene adsorption capacity with a different packing density
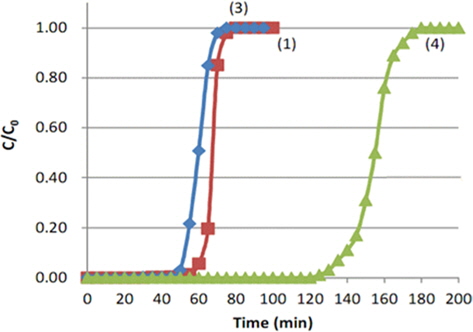
Fig. 5 shows the breakthrough curves of toluene with different packing densities of MD-1100 ACFs. From Table 1, experiment (1) was performed at a packing density of 0.1779 g/m3 by filled up 2.2 g MD-1100 to the height of 70 mm of a 15-mm internal diameter bed, experiment (3) was performed at a density of 0.0889 g/m3 by filling up to 2.2 g while increasing the height of 140 mm, and experiment (4) filled up to 4.4 g with a height of 140 mm and adjusted the packing density until it was equal to that in experiment (1).
All breakthrough curves show an “S” shape after the break point and all quickly reach the initial concentration. Comparing the result of (3) with that of (1), the break point time decreased to 53 min from 61 min as the packing height increased. The maximum toluene adsorption capacity (We) corresponding to C/Co = 0.5, was 62 min, which was 0.86 times that of experiment (1). It is believed that an increase in the packing height with same amount of packing gives rise to a channeling effect due to the insufficient contact between adsorbents and adsorptives. Therefore, it is recommen at an appropriate packing density of adsorbents is determined through different packing density experiments. Comparing the result of (4) with that of (1), the break point time increased to 128 min. In particular, the maximum toluene adsorption capacity (We) corresponding to C/Co = 0.5, was 154 min, which was 2.14 times larger than that of experiment (1). Therefore, the break point time and the maximum adsorption capacity can be increased by increasing the packing height with the same packing density. This increased capacity is due to the reduced ratio of the length of the unused bed (LUB), resulting in the increase of the actual length of the adsorption bed height. The LUB can be calculated by the following Eq. (C):
Here,
3.4. Toluene adsorption capacity with a different bed diameter
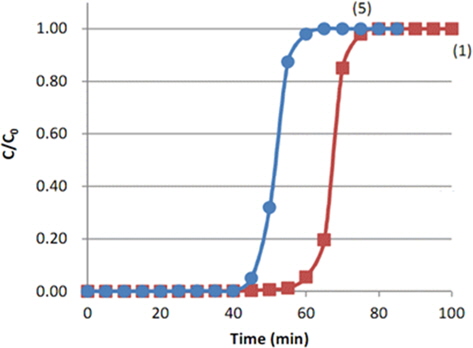
Fig. 6 shows the breakthrough curves of toluene adsorption through the MD-1100 ACF packing bed with different diameters. From Table 1, the experiment (1) was performed at a packing density of 0.1779 g/m3 by filling up to 2.2 g MD-1100 with a height of 70 mm of a 15-mm internal diameter bed, and experiment (5) was performed at the packing density of 0.0889 g/m3 by filling to 2.2 g with the height of 35 mm of a 30-mm internal diameter bed. Both breakthrough curves also show an “S” shape after the break point, quickly reaching the initial concentration, as in the other conditions. Comparing the result of (5) with (1), the break point time decreased to 45 min from 61 min as the bed diameter increased. This means that the adsorption efficiency can be decreased by increasing the bed diameter. There may be a channeling flow of air which gives rise to insufficient contact between the ACF surface and toluene as in the case of an extended bed height with a low density. The maximum toluene adsorption capacity (We) corresponding to C/Co = 0.5 was 52 min, which was 72.2% of that of experiment (1). If the packing density equals 0.1779 g/m3 by filling the 30 mm bed diameter to 2.2 g, the height would be 17.5 mm. In this case, the ratio of the used bed height to the unused bed height will decrease compared to experiment (1), and the adsorption efficiency can be decreased. Therefore, for the efficient adsorption of toluene through the ACF packing bed, the bed diameter can be small and the packing height can be high by increased the packing density.
3.5. Toluene adsorption capability of different bed temperatures
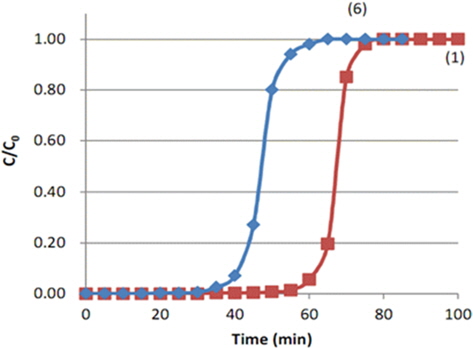
Fig. 7 shows the breakthrough curves of toluene adsorption on ACF at different bed temperatures. When the control chamber temperature is changed, the toluene vapor concentration also changes. Experiment (1) was performed at 25℃, and the toluene concentration which can be supplied to the packing bed was controlled at 200 ppm. Experiment (6) was performed at 35℃ while being controlled to 400 ppm. 400 ppm toluene in vapor measured 1642.86 mg/m3 according to Eq. (C). The break point time in experiment (6) was 39 min, which was far reduced from 61 min in experiment (1) with an increase in the toluene concentration. The toluene adsorption capacity (Wb) at this time was 58.25 mg/g-acf. The break point time corresponding to C/Co = 0.5 was 48 min. Thus, the maximum adsorption capacity (We) at this point was 71.69 mg/g-acf. This value was greater than that (53.77 mg/g-acf) of experiment (1) due to nearly doubled initial concentration. However, the maximum adsorption capacity increased by only 23% when doubling the supplying concentration. It is believed that the adsorption mechanism can be determined by the Langmuir equation and that the toluene adsorption by ACF can be effective particularly at a low concentration. If the concentration of VOCs in a newly delivered automobile is maintained less than 200 ppm, they can be removed in a relatively short period of time with an ACF filter. Kouichi and Shinichi [2] reported that the VOC concentration in an automobile increases exponentially with an increase in the indoor temperature. The toluene concentrations were 150, 720 and 2670 μg/m3 at indoor temperatures of 20, 40 and 60℃, respectively. Therefore, reducing the indoor temperature is also recommended by frequently recycling the indoor air with fresh air while driving an automobile in addition to the use of an ACF filter.
3.6. Adsorption behaviors in an ACF packed bed
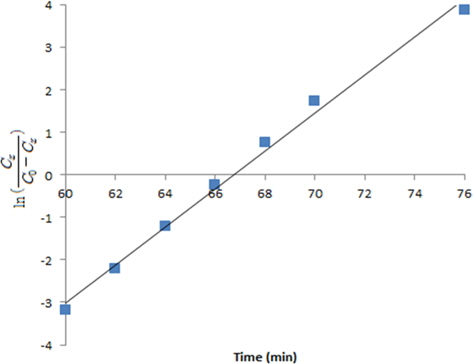
There are many different methods to predict the VOC adsorption behaviors of an AC packed bed. However, there are few reports related to the adsorption behaviors of an ACF packed bed. In this study, Yoon and Nelson's Eq. (D), which has been very frequently applied among several equations related to an AC adsorption bed, was applied to predict the breakthrough curve and adsorption behaviors of an ACF packed bed.
Here, the inlet toluene concentration Co is 821.43 mg/m3 (200 ppm), ACF packing density ρB is 0.1779 g/cm3, the packing length L is 70 mm, and the superficial velocity VL is 18.875 cm/sec (2 L/min φ=15 mm). We is the dynamic (maximum) adsorption capacity and kv is the velocity constant. In Fig. 8, the straight line shows the relationship between
In a batch experiment, an ACF non-woven filter shows far better adsorption capacities for VOCs (formaldehyde, toluene and benzene, all of which are generated from the interior materials of automobiles) in comparison with those of a PP non-woven filter and a PP+AC combination filter currently used in automobiles. Unde a continuous flow of toluene vapor through an ACF packed bed, all of the breakthrough curves show a rapid “S” shape after a long extended break point in spite of the different experimental conditions due to the narrow mass transfer zone and short unused bed length. In particular, the ACF prepared with a pore size of 2-5 nm shows excellent adsorption capacity by micro-filling of micropores plus the capillary condensation mechanism of the mesopores. The Yoon and Nelson equation, which was derived from AC and which is frequently used for predictions of dynamic adsorption behaviors, was also applied to investigate the adsorption behaviors of an ACF packed bed. Therefore, ACF prepared with a pore size distribution of 2-5 nm can be a promising filter for the removal of VOCs in newly delivered automobiles.