Carbon nanospheres (CNS) are circular carbons bearing concentric graphitic layers within the surface. Nanoscale carbon spheres are typically 10-50 nm in diameter and have high specific surface area [1]. CNS are a material that is now being explored for its novel chemical, physical, and biological applications. CNS are produced as an impurity in many processes like flame synthesis, arc discharge, laser ablation, and chemical vapor deposition [2-6]. Recently, combustion-generated particles have gained significant interest due to their direct health and environmental effects [7,8]. In recent years, researchers have focused their attention on fine and ultrafine particles with sizes down to a few nanometers; such particles are most likely to cause the observed effects [7,9]. Broadly speaking, fine and ultrafine particles comprise two main classes of compounds: nanospheres of organic carbon (NOC), characterized by a size range of 1-10 nm, and soot particles, with sizes in the range 10-100 nm. NOCs usually precede and accompany soot formation but have also been found in flames operated in rich conditions well below the soot limit [10]. As discussed, these nanospheres are now being tested for their toxicity effects on life forms and their catalytic activity in metallurgy, as drug delivery systems and energy devices, and for potential uses in many other areas. The present paper briefly discusses the synthesis and the quality of these nanospheres produced by solution combustion process and assesses their potential for use in catalysis and energy storage sectors.
All the materials procured were of analytical grade and were utilized without any purification throughout the study. Citric acid, ethanol, and nitric acid were purchased from Sigma-Aldrich and from Merck, India. Camphor was purchased from the local Indian market.
According to the reaction, the stoichiometric amount of citric acid, nitric acid, and a solution of dissolved camphor in ethanol were mixed. The mixture was then kept in a furnace pre-maintained at 350°C. The complete reaction continued for 20 min with the evolution of white fumes followed by brownish nitrous oxide fumes. On further heating, a slurry was formed that auto ignited; this finally resulted in the formation of a black powder. The obtained powder was then heated further for 1 h at a temperature of 400°C in a nitrogen environment to yield pure spherical nanoparticles of carbon. The powder was then analyzed to determine its crystallinity, morphology, quality, thermal stability, surface area, and electrochemical property using scanning electron microscopy (SEM), transmission electron microscopy (TEM), X-ray diffraction (XRD), Raman, thermal gravimetric analysis (TGA), Brunauer-Emmett-Teller (BET), and cyclic voltammetry (CV).
The samples were analyzed using a field emission (FE)-SEM (LEO SUPRA 55; Carl Zeiss, Germany). The FE-SEM (Fig. 1) shows a cluster of densely populated amorphous soot at a higher magnification as spherical particles. The average diameter of each particle is around 50 nm.
A high-resolution (HR) TEM (FE-HRTEM JEM2100F) operated at 200 kV was used for the TEM analysis. Figs. 2 and 3 show the TEM and HRTEM images, respectively, of the agglomerated CNS with sizes varying between 40-50 nm. In the higher resolution image, it can be seen that the spheres are made of several layers of graphitic rings that are heavily distorted and compact. Similar results for CNS have been reported by several researchers [3,11,12]. Technically, for the soot structure and shape to be in the nanophase range of 10-50 nm depends on the fuel type, temperature, combustion kinetics, and chemistry [13]. Vander Wal et al. [14,15] sampled soot particles produced from an engine and other units directly on TEM grids. These particles are similar in morphology and size, exhibit an amorphous nature, and are predominantly composed of turbostatic and fullerenic carbon.
The XRD and crystal data studies were done using a Bruker AXS-D-8 Discover X-ray Diffractometer. The XRD image (Fig. 4) shows no strong crystalline structures, but has a vivid amorphous broadening in the peak at a 2θ angle of 25.2°. A total of two peaks were identified, of which the first peak at a 2θ angle of 25.2° matches with the presence of the C60 lattice oriented along the (400) plane of its axis [JCPDF # 79-1715]. A small intensity reflection of the C60 at a 2θ angle of 43.64° with (002) orientation shows a primitive lattice and a hexagonal system [JCPDF # 79-1715].
The nanocarbon sample was analyzed using a Jasco Raman spectrometer equipped with a charge-coupled device detector at a wavelength of 532 nm from 1000 to 2000 cm-1. The spectrum (Fig. 5) is similar to that of a strongly disordered SP2 graphite layer. Since the Raman spectrum of soot has a broad D- band at around 1381 cm-1, a contribution from amorphous carbon cannot be excluded. With this type of broadening in the D band, it can be concluded that the dominant fraction of the soot consists mainly of disordered fullerenic turbostatic carbon. In contrast, the width of the G peak at 1599 cm-1 decreases as the size of the carbon sphere decreases in the sample. The ratio of the intensities of the D and G bands gives an estimation of the quality of the sample. In our case, this ratio was found to be 0.96, which designates the sample as turbostatic, as was observed.
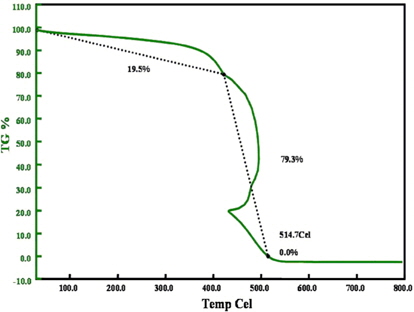
Thermal analysis of the sample was carried out using a thermal analyzer (TGA Q5000 IR/SDT Q600 (TA) at a rate of 10°C/min in the presence of air. From the thermogram (Fig. 6) we can observe the first step (~400-500°C), which corresponds to the combustion of the amorphous carbon or to degenerated graphitic carbons. In the second step the weight loss at higher temperatures (≥500°C) corresponds to combustion of outer layers of the CNS with varying degrees of thickness and graphitization, as can be observed in the HRTEM image [16,17]. The weight trace at ~430°C suddenly shifts backwards on the abscissa and then continues in its normal forward motion, which is generally attributed to the combustion of the individual graphitic layers within the CNS. During this process the spherical particles start burning the outer layers, which process releases a significant amount of heat in a quick manner, which further results in the quick dissipation of heat before the next layer starts degenerating. Hence such kinds of peaks are often found in samples with several layers of carbon or in the presence of a metallic catalyst [18,19].
The surface area of CNS was assessed using a SMART SORB 92 BET surface area analyzer at a regeneration temperature of 200°C for 2 h with N2 purging. The surface area of the CNS was 141.65 m2/g.
Two application modules (Fig. 7) were employed to showcase the use of CNS as an anode material for prospective energy devices and also as an effective catalytic material for the pro-duction of hydrogen via thermo catalytic decomposition (TCD) of methane. The following section deals with the application of CNS in brief.
The anode was fabricated by doctor blade coating. The coating slurry was prepared by mixing synthesized carbon and polyvinylidene difluoride at a weight ratio of 90:10 in N-methyl pyrrolidine. The slurry was poured over copper foil and dried at room temperature for 24 h and at 120°C for 5 h using a hot air oven. Commercially available lithium metal was applied as the cathode. Li ion cells were assembled in a 2032 coin cell by sandwiching the separator between the lithium cathode and the carbon anode along with a 1M LiPF6 electrolyte in ethylene carbonate: diethyl carbonate (1:1, vol%). All cells were assembled in a glove box filled with argon gas.
CV analysis using a Princeton VersaSTAT-3 instrument was carried out between 0.1 V and 3 V on the carbon working electrode, with a counter and reference electrodes of lithium at a scan rate of 2 mV/s. From the CV, the lithiation and delithiation mechanism of the prepared electrode material was observed. The lithiation and delithiation mechanism is highly dependent on the structural characteristics, such as the degree of graphitization, the pore size and shape, and the functional groups, since these factors are responsible for differences in the diffusion rate and reversibility of the lithium ions during the reaction [20]. The graph (Fig. 7a) shows the CV curves of the electrodes made of CNS for 3 scans. It can be observed that there is an increasing cathodic peak range starting from 0.7-2.1 V for cycles 2 and 3, whereas cycle 1 displays a separate and very narrow to broad trend from 1.2 V onwards. The initial trend is common and indicates the insertion of lithium ions in the carbonaceous substances and the formation of a solid electrolyte interface layer [20]. The removal of lithium is observed over a wide potential range of 0.6-2.1 V, displaying a broader and wavy anodic range in the CV. In this high range cycle 1 displays a different CV, exhibiting late insertion of lithium ions and wavy anodic peaks around 1.7 and 2.5 V; also, from the cycle 3 and cycle 2 peak shapes, a similar upward trend at around 1.4 V can be observed, which indicates the existence of a secondary lithium storage reaction. The presence of the large surface area of CNS may be attributed to the exceptional electrochemical performance [20].
The as-prepared CNS were utilized to study the TCD of methane for free hydrogen production as a catalyst (Fig. 7b). The decomposition reactor was fed with 1 g of purified CNS and the reaction was allowed to proceed at 850°C and 1 atmosphere, under which conditions undiluted methane (99.99 mole%) was passed with a flow rate of 54 sccm over the CNS; the rate of decomposition of the methane gas to hydrogen was found to be 0.12 milli mole/min/gram, i.e. the total methane per pass conversion was found to be 6-7 mole% with the product gases in the reactor containing 12-13 mole% of hydrogen. The surface areas of the CNS before and after the reaction were 141.65 m2/g and 85.16 m2/g respectively
Solution combustion as a process has an immense capacity to produce CNS in bulk quantities. Solution combustion technology offers a scalable, dry technology for synthesis of high purity nanoparticles with closely controlled characteristics. Presently, CNS are slowly gaining interest in the fields of drug delivery systems, hydrogen storage, catalysis industrial composites, and electrochemical devices.