Normally, short circuit studies involve calculating a bolted three-phase fault condition, which can be characterized as all three phases 'bolted' together to create a zero impedance connection. This establishes the 'worst case' (highest current) condition that results in maximum three-phase thermal and mechanical stress in the system. From this calculation, other types of fault conditions can be approximated. This “worst case” condition should be used to specify proper interrupting rating requirements, selectively coordinate the system and provide component protection [4].
In a three-phase system, a fault may equally involve all three phases. A bolted fault acts as if the three phases were connected together with links of zero impedance prior to the fault, i.e., the fault impedance itself is zero and the fault is limited by the system and machine impedances only. Such a fault is called a symmetrical three-phase bolted fault, or a solid fault.
Generally, such faults give the maximum short-circuit currents and form the basis of the calculations of short-circuit duties on switching devices. Faults involving one, or more than one, phase and ground are called unsymmetrical faults. Unsymmetrical faults are more common than three-phase faults, but under certain conditions, line-to-ground fault or double line-to-ground fault current values may exceed three-phase symmetrical fault currents. Short-circuit calculations are, thus, the primary study whenever a new power system is designed or an existing system is to be expanded or upgraded [7].
In a distribution system, several variables affect calculated bolted three-phase short-circuit currents. Appropriate variable values must be selected for the specific application analysis. Electrical installations almost always require protection against short-circuits wherever there is an electrical discontinuity. This most often corresponds to points where there is a change in conductor cross-section. The short-circuit current must be calculated at each stage of the installation to determine the characteristics of the equipment required to withstand or break the fault current [4].
Sources of a short-circuit current that are normally considered include utility sources, local sources, synchronous motors, induction motors and alternate power sources [4].
The consequences of short-circuits can vary depending on the type and duration of the fault, the installation point (as in a physical location) where the fault occurred and the short-circuit power. Consequences include:
- At the fault location: the presence of electrical arcs, resulting in damage to insulation, welding of conductors, initiation of fires and endangerment to life.
- On the faulty circuit: electrodynamic forces, resulting in the deformation of the bus-bars, disconnection of cables, and excessive rise in temperature due to an increase in Joule losses, risking damage to insulation.
- On other circuits in the network or in near-by networks: voltage drop during the time required to clear the fault, ranging from a few milliseconds to a few hundred milliseconds.
- Dynamic instability and/or the loss of machine synchronization, etc.
Short-circuit calculations should be done at all critical points in the system. These would include the service entrance, transfer switches, panel boards, load centers, motor control centers, disconnects and motor starters. The various types of short-circuits that can occur during electrical installations are as follows [3]:
- Phase-to-ground (80% of faults).
- Phase-to-phase (15% of faults). This fault often degenerates into a 3-phase fault.
- Three-phase (only 5% of initial faults).
In networks with isolated nodes, or ineffectively earthed, the connection of the phase with the earth dose not called single-phase short-circuit, but qualitatively a ground fault.
In this study, only phase-to-ground and three-phase short-circuits are calculated to investigate short-circuit currents and voltages.
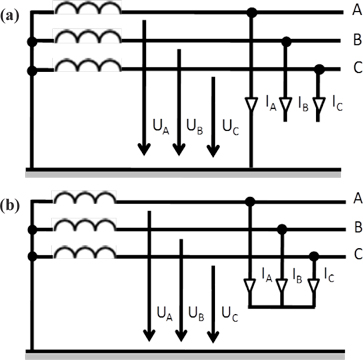
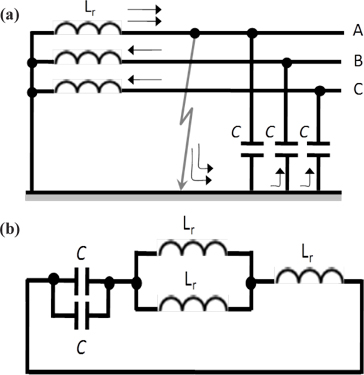
From Figure 1a, the characteristic equations for a single-phase short circuit can be written directly as follows [12]:

In a real single-phase short circuit, the voltage at the damaged phase does not decrease to zero. This type of short circuit can occur only in networks with earthed nodes of transformers or generators. For short-circuits, phase A current can be written as follows:

where
E is the phase voltage.
Z1, Z2 and Z0 are the positive, negative and zero impedances, respectively.
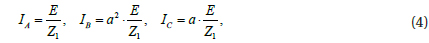
The characteristic equations for a three-phase short circuit is as follows (Fig. 1(b)):

For the phase currents, assuming a symmetrical short:

where
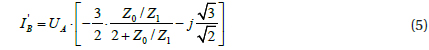
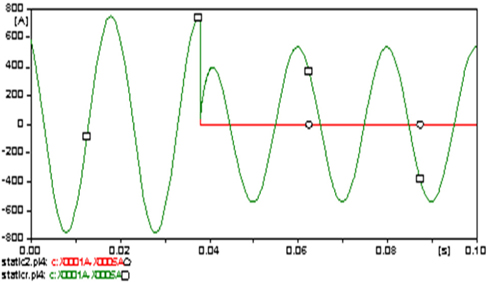
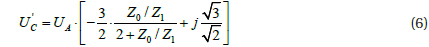
Switching from the state before the fault to the new state is accompanied by a transient. In single-phase short-circuits (Fig. 2(a)), the transient is caused by the balance capacities in phases B and C, where its energy shifts to inductance, which will be transformed into the energy of the coil’s magnetic field and vice versa. This results in an oscillating circuit, whose natural frequency depends on the values of capacities and inductance and oscillates the phase A voltage from the phase value UA to, or near, zero and UB and UC to the values U'B and U'C calculated by equations 5 and 6 below:

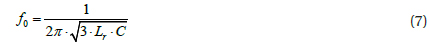
The diagram of Fig. 2(a) can be replaced by Fig. 2(b), and the frequency of the circuit is calculated by equation 7 below:

The results, obtained by ATPDraw [2], which is a graphical, mouse-driven preprocessor to the ATP version of the Electromagnetic Transients Program (EMTP), are drawn by PlotXY program [11].
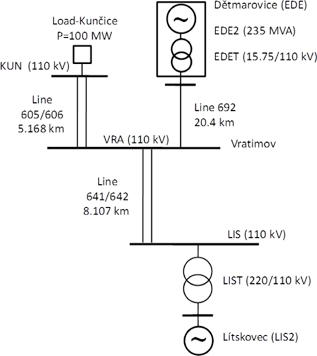
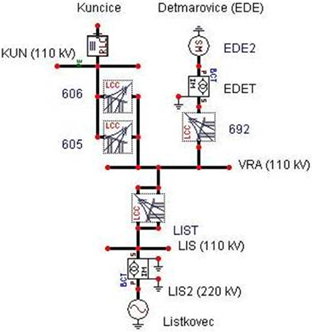
The studied case (Fig. 3) corresponds to a part of a power network around a branch from the Dĕtmarovice power station (EDE) - block No. 2 in Czech Republic. Block No. 2 (EDE2) has a generator with a three-phase volt-ampere rating of about SG=235 MVA and a voltage of about 15.75 kV and it supplies to the power network 110 kV a power of about 160 MW via the block transformer (EDET). A part of this power, about 100 MW, is consumed in the Kunčice substation (KUN), and 60 MW is fed to the supergrid 220 kV of Lístkovec (LIS2) via the distribution transformer (LIST). Both parts of the power are transferred via the Vratimov substation (VRA), considered to be under no load. All the substations are connected by AlFe-110 kV transmission lines. A single line, No. 692 (two conductors in a bundle 2×670 mm2, length 20.4 km), is connected between the Dĕtmarovice power station (EDE) and the Vratimov substation (VRA); a double line No. 605-606 (240 mm2, length 5.168 km) between the Vratimov substation (VRA) and the Kunčice substation (KUN); and a double line No. 641-642 (450 mm2, length 8.107 km) between the Vratimov substation (VRA) and the Lístkovec substation (LIS).
The power system has two supply stations, the block of Dĕtmarovice (EDE), which contains a synchronous generator (EDE2) and a block transformer (EDET), and the supergrid 220 kV of Lístkovec (LIS2), in addition to two transformers, three transmission lines and one load of Kunčice (KUN). ATPDraw has sufficient models to represent this power system, but some components are needed to calculate short-circuit currents and voltages, such as measuring probes and a combination of switches with resistances.
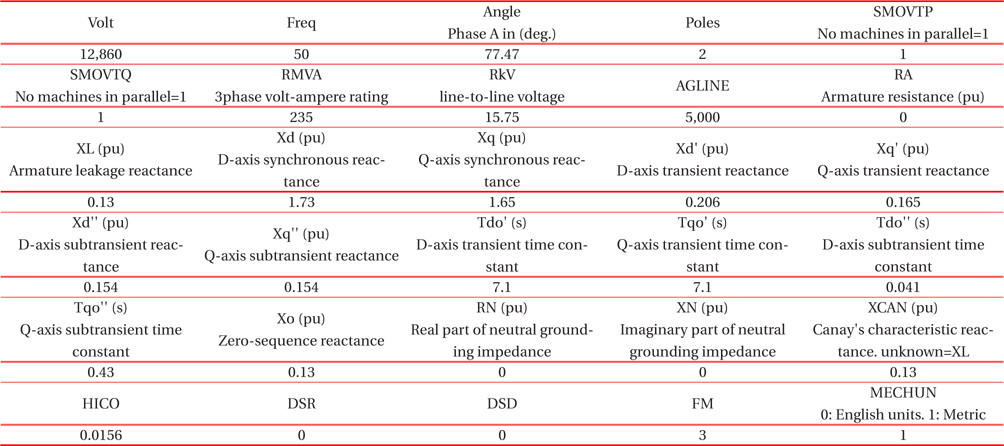
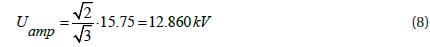
The synchronous generator (SG=235 MVA/15.75 kV) of the Dĕtmarovice supply stations (EDE) is represented by the ATPDraw model SM59. Parameters of the generator are listed in Table 1 below. The voltage magnitude is calculated as in equation 8 [14] and represents the steady-state voltage at the terminals of the machine.
[Table 1.] The parameters of the generator.

The parameters of the generator.

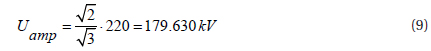
The supergrid 220 kV of Lístkovec (LIS2) is represented as an ideal source of voltage (AC3ph- type 14) with amplitude given by equation 9:
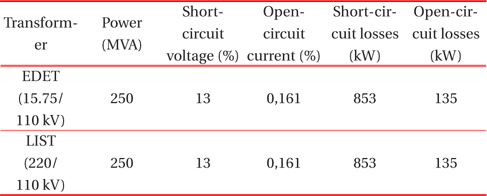
The power system contains two transformers, the block transformer (EDET), type EC 41 M, manufactured by Škoda Plzeň-Czech Republic, and the distribution transformer (LIST), manufactured by Škoda Plzeň. Both transformers are modeled by the ATP-Draw model BCTRAN. Table 2 describes the parameters of the transformers.
[Table. 2.] Parameters of BCTRAN.
Parameters of BCTRAN.
The other values are as follows: three phases, two windings, a 3-legged stacked core, test frequency of 50 Hz and DYn1 connection for EDET and YNyn0 connection for LIST.
The 110 kV transmission lines, made of AlFe, are modeled by the ATP-Draw model Lines/Cables (LCC). The parameters and location of the conductors on the towers for each line are listed below:
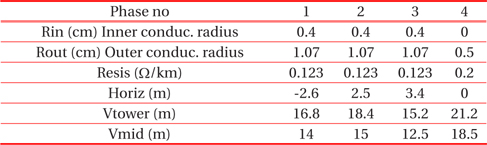
- The single line No. 692 has two conductors in a bundle: cross sectional area of 2×670 mm2, length of 20.4 km, an overhead line, 3-phase, type PI, with skin effect, Rho (ground resistivity) = 120 Ωm, and initial frequency = 50 Hz. The parameters and location of the conductors on the tower are given in Table 3.
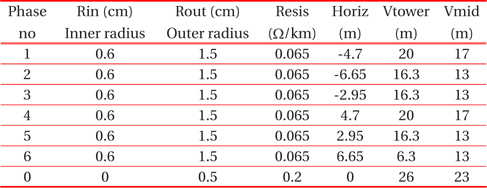
- Double lines No. 605-606 are made of AlFe: cross sectional area of 240 mm2, length 5.168 km, overhead lines 3-phase, type PI, with skin effect, Rho (ground resistivity)=100 Ωm, and initial frequency = 50 Hz. The parameters and the locations of the conductors on the tower are given in Table 4.
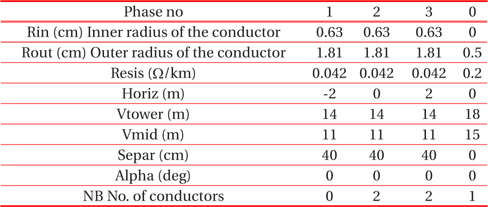
- Double lines No. 641-642 are made of AlFe: cross sectional area of 450 mm2, length 8.107 km, overhead line, 6-phase, type PI, with skin effect, Rho (ground resistivity)=100 Ωm, and initial frequency = 50 Hz. The parameters and the location of the conductors on the tower are given in Table 5.
[Table 3.] The parameters of the transmission line No. 692.
The parameters of the transmission line No. 692.
[Table. 4.] The parameters of transmission line No. 605-606.

The parameters of transmission line No. 605-606.
[Table 5.] The cable input data.
The cable input data.
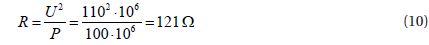
The load in the Kunčice substation (KUN) can be easily modeled by a standard component RLC3 as a resistive load, connected to a star with a grounded node. Load consumed is about 100 MW, with 110 kV. The resistance value will be [14]:

Finally, the scheme of the Dĕtmarovice power station - block No. 2 shown in Fig. 3, will be modeled by ATPDraw as shown in Fig. 4 below.
In this study, we investigate the short-circuit currents and voltages at the bus of the Kunčice substation (KUN), as well as at some points such as the secondary side of the Dĕtmarovice transformer (EDET) and at the secondary side of the Lístkovec transformer (LIST). The short-circuit calculations will be done only for phase-to-ground and for three-phase at the Kunčice substation (KUN).
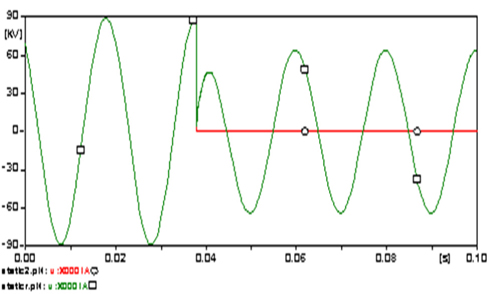
For each analysis in this study, 200 statistical simulations were performed in total. A switching simulation was represented by a statistical switch, modeled at ATP as SW_STAT, with a Gaussian probability distribution and described by a standard deviation σ (set to 1 μs). For all simulations, the starting time of the fault was set to 0.0378 s, which is the time the voltage of phase A crosses the maximum.
4.1 Phase-to-ground short-circuit at the Kun?ice substation
Assuming that the fault occurs at phase A, the following figures illustrate the imbalance situations that could occur at the different points in the network.
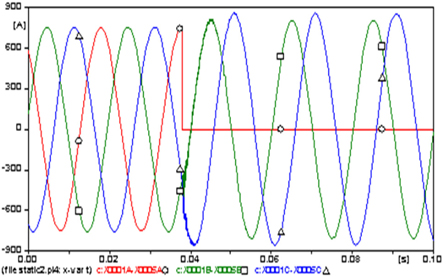
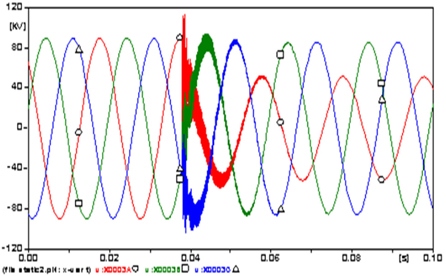
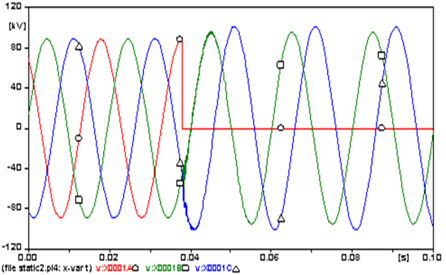
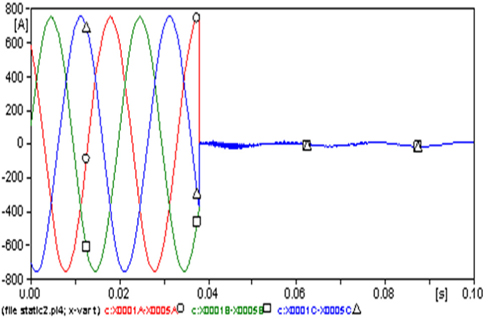
Figures 5 and 6 show the currents of the three phases of the load of Kunčice and the voltages at this busbar. The current and the voltage at the damaged phase A (○) decreased to zero, while those at the faultless phases B (□) and C (△) were slightly affected. The amplitude of the current at all phases (Fig. 5), in the case of steady state, reached 752 A and because the fault, the amplitude of the current at phases B and C increased to almost 811.5 A and 861.4 A, respectively (increased about 7.9% and 14.5%, respectively). In Fig. 6, the amplitude of the voltage reached 88.7 kV at steady state and because the fault increased to 95.7 kV (7.89%) at phase B and -101.65 kV (14.6%) at phase C.
4.1.2 At the secondary side of the D?tmarovice transformer EDET
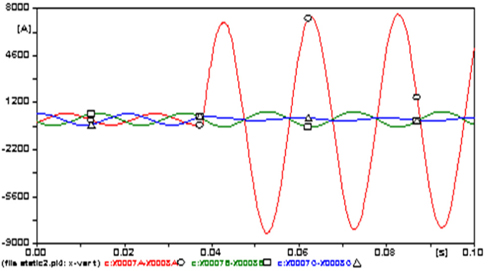
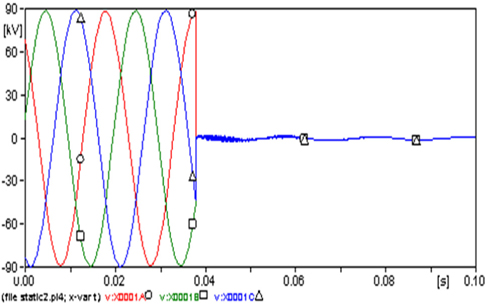
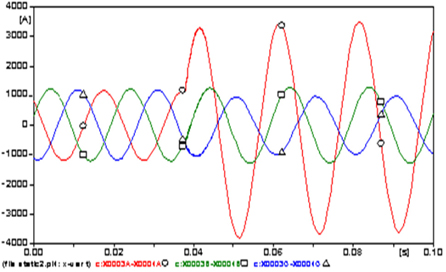
The amplitudes of the three phase steady state currents that flowed from the secondary side of the transformer EDET (Fig. 7) are 1,164.1 A at phase A (○), 1,207.6 A at B (□) and 1,184 A at C (△).because the fault, the amplitude of the phase A current increased to a maximum -3,794.2 A (225.9%). This disturbance appears in the curves of voltages (Fig. 8), whose the amplitudes at the three phase steady state were almost 89.85 kV, because the fault decreased to 51.1 kV at phase A (decreased 43.1%).
4.1.3. At the secondary side of the Listkovec transformer list
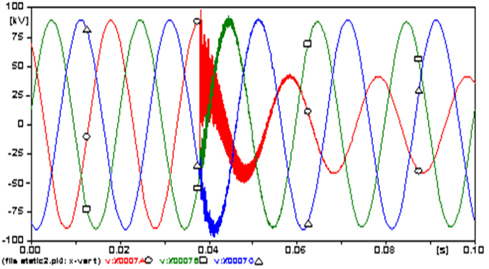
The amplitudes of the three phase steady state currents that flowed from LIST (Fig. 9) are 441.23 A at phase A (○), 451.59 A at B (□) and 418.36 A at C (△).because the fault the amplitude of the phases A current increased to a maximum of -8,225.3 A (1,764.2%). The amplitudes of the three phase steady state voltages (Figure 10) are almost 89.1 kV because the fault decreased to 41.31 kV (53.6%) at phase A.
4.2 Three-phase short-circuit at the Kun?ice substation
Based on the above explanations, the following imbalance situations occur:
Figures 11 and 12 show the currents and voltages at the three phases. The current and the voltage at the damaged phases decreased to almost zero. The amplitude of the current at all phases (Fig. 11) at steady state reached 753 A and the amplitude of the voltage reached 89 kV (Fig. 12).
4.2.2. At the secondary side of the D?tmarovice transformer EDET
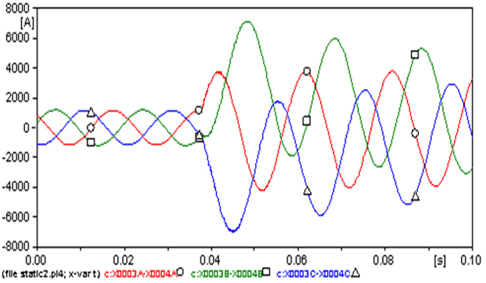
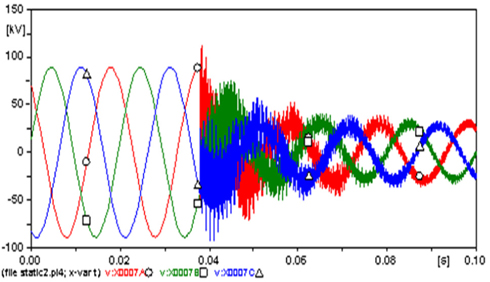
The amplitudes of the steady state currents at all phases (Fig. 13) are 1,164.1 A at phase A (○), 1207.6 A at B (□) and 1,184.1 A at C (△).because the fault, the amplitudes of the currents increased to a maximum -4,219.5 A at phase A (262.5%), 7,135.6 A at B (490.9%) and -6,979.4 A at C (489.4%). This disturbance appears in the curves of voltages (Fig. 14), whose amplitudes of the three phase steady state are almost 90 kV, because the fault decreased to almost 40 kV (55.6%) in all phases.
The transient disturbance at the start of the fault showed that the transient voltage at phase A reached the value of 131.16 kV, i.e. increased by about 45.7% in comparison with that at the steady state.
4.2.3 At the secondary side of the Listkovec transformer LIST
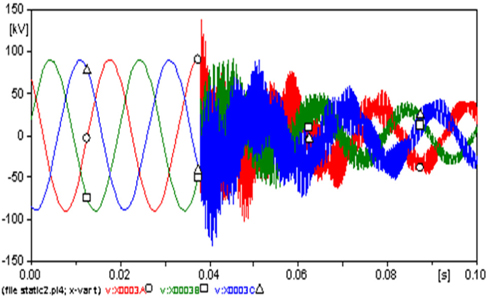
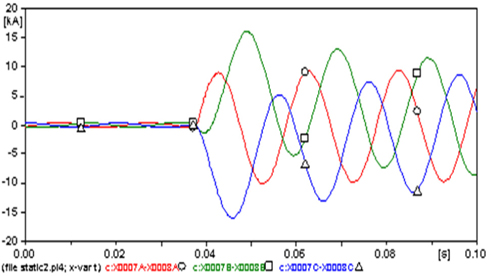
The amplitudes of the three phase steady state currents that flowed from the LIST (Fig. 15) are 443.71 A at phase A (○), 451.71 A at B (□) and 429.37 A at C (△).because the fault, the amplitude of the current increased to a maximum -10,077 A (2,171.1%) at phase A, 16,019 A (3,446.3%) at B and -16,090 A (3,647.4%) at C. The amplitudes of the three phase steady state voltages (Fig. 16) are almost 89.2 kV because the fault decreased to almost 33.5 kV (62.4%) in all phases.
At the start of the fault, the transient voltage reached the value of 112.7 kV (26.3%) at phase A.
A fault such as indirect connection of one phase with the ground in networks with an isolated node or in compensated networks (node is connected via arc-suppression coil) is called an earth-fault (or ground fault). This fault may occur in normal operation and currents will leak from phase to earth. Earth-leakage currents have small values and are capacitive [12], while short-circuit currents usually reach multiple values higher than those at steady state operation and are inductive.
In this study, we assumed that the earth-fault resistance was zero, although it has a decisive influence on the Y-voltage (U0) value and thereby on earth-fault protections. For example, the functions of some earth-fault protections, such as GSC12 [12], are blocked by the value of (U0); protection will not react if the value does not reached 30~40% of the nominal value.
Short-circuit calculations are possible using earth-fault resistances if the power system is correctly modeled and the study aims to find the correct configuration for the network to avoid faults. In ATPDraw, the earth-fault resistance is simply modeled by the component "Resistor", which will be one-pole or three-pole grounded. For example, with earth-fault resistance of 10 Ω for the scheme corresponding to Figs. 5 and 6, the curves of the currents and voltages will differ as shown below. The amplitude of the current at phase A reached 538.92 A, not zero (Fig. 5), and the amplitude of the voltage reached 63.6 kV.
This study demonstrated the imbalance situations due to short circuits at different locations in power systems. Short-circuits may occur in well designed power systems and produce large decaying transient currents, in most cases much above the system load currents. Such a case can be studied to identify the worst possible cases in a power system by modeling using a suitable program, such as EMTP-ATPDraw, and simulating the faults at different locations in the network.
The high oscillations on the voltage curves due to a fault originate from the oscillating circuit described previously in Fig. 2.
The worst case in this simulation (the fault started when the voltage of phase A crosses the maximum, t=0.0378 s), which need to be protected against, was the rise of a short circuit current at the secondary side of the Listkovec transformer LIST for both phase-to-ground and three-phase faults. Referring to Fig. 9 and Fig. 15, the amplitude of the current at phase A increased to a maximum -8,225.3 A (1,764.2%) because of the phase-to-ground fault and increased to -16,090 A (3,647.4%) at phase C because of the three-phase fault. These values decreased when the voltage was not the maximum.
The worst case was the three-phase fault, which is called a symmetrical three-phase bolted fault. Knowing this, the short-circuit to the faulty section of the electrical system should be limited by applying appropriate switching devices that can operate under short-circuit conditions without damage and isolate only the faulty section.