White LEDs, based on blue LED chips coated with yellow emitting phosphor (YAG:Ce), were first reported in 1997 [1] and since then, has been a well known approach to obtain white light. As another approach, white LEDs have been made by coating near ultraviolet (n-UV) emitting LEDs with a mixture of high efficiency red, green and blue emitting phosphors [2]. Even with the recent improvements in the emission efficiency of LED chips in the near UV-to-deep blue range [3-6], they are still inferior in quality compared to the LED chips coated with YAG:Ce. Hence, the first approach [7] in which blue excitable, yellow phosphor is coated on a blue chip is considered to be more practical. In addition to the poor colour rendering, however, there are several other disadvantages of the YAG:Ce phosphor, which are well documented [8].
Phosphor converted LEDs using YAG:Ce phosphor have high color temperature (CT), typically higher than 6,000 K, and emit only the 'cool white' color. To decrease the CT, it is necessary to move the CT to the right of the coordinated colour temperature (CCT) curve to the right - side in the chromaticity by changing the spectral shape in the visible range. Such a spectral modification cannot be realized by increasing the powder content of the YAG phosphor in typical YAG-based white LED packages.
Also because the chip is small with limited phosphor area, the temperatures near the LED chip can range from 400 to 450 K. Secondly, the efficiency of YAG:Ce phosphor coated LEDs decreases at these temperatures, although the phosphor itself shows much better thermal quenching [9]. This efficiency reduction is related to the concentration quenching at higher temperatures [10]. Another problem associated with the use of YAG:Ce is the “halo effect” (blue/yellow colour separation), which results from the poor mixing of YAG:Ce in the resin due to the high density of YAG, resulting in colour unevenness [11].
For improving CRI and CCT, the emission spectrum can be red-shifted by introducing Gd3+ [12-14] and Tb3+ [15-17] at the Y3+ sites, and blue-shifted by substituting (part of the) Al3+ by Ga3+[18-20]. The effects of these codopants on intensity, emission wavelengths and CRI have been recently reported [21].
In this paper, we report the synthesis and characterization of GdAG:Ce phosphor, and fabricate white LEDs using this phosphor with 470 nm chips.
Gd3Al5O12(GdAG): Ce (0.7 mol.%) phosphors were prepared by combustion synthesis. Instead of the conventional solution combustion synthesis, we used a modified procedure to form the desired compounds in a single step. Reagent grade (Indian Rare Earths, Ltd.) rare earth oxides/carbonates were dissolved in nitric acid to convert them into corresponding nitrates. The nitrates were dried by prolonged, gentle warming. Stoichiometric amounts of hydrated nitrates of yttrium, aluminium and cerium were thoroughly mixed with urea/glycine. The nitrate - to - fuel ratios were calculated by the method described earlier [22, 23]. Due to the presence of large water of crystallization in aluminium nitrate, a thick paste was formed. A china dish containing this paste was placed in a furnace preheated to 500℃. Within minutes, the paste foamed and a flame was produced, which lasted for several seconds. The china dish was immediately removed from the furnace.
X-ray diffraction patterns were recorded on the Philips PANalyticalX'pert Pro diffractometer. PL characteristics in the range of 200~700 nm at room temperature were studied using a Hitachi F-4000 spectrofluorimeter with 1.5 nm spectral slit width. Colour coordinates of the phosphor were calculated using the software Colour Calculator 2.0.0 (Radiant Imaging).
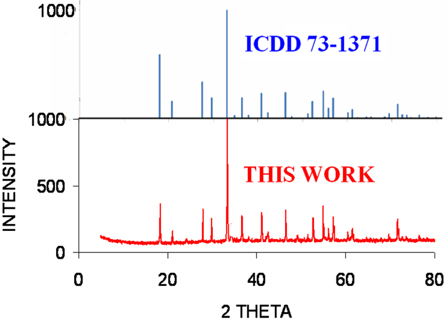
All the lines matched exactly well with those of ICDD file 73~1,371. Some additional weak lines mixed in the noise may be due to the carbonaceous matter that was formed during combustion synthesis
The phosphor in desired quantity was dispersed in a transparent silicone resin (Wells Electronic Materials Company, 5012-2A and 5012-2B), and the resulting epoxy resin was coated onto a blue LED chip (CREE 470 nm, 300 micron) to fabricate an LED. The electroluminescence (EL) spectra, colour temperature, CIE chromaticity coordinates, CRI and lumen output at room temperature of the fabricated LED were measured using a 300 mm integrating sphere and lumen meter (Hangzhou Zhongwei Photoelectricity Company ZVision ZWL 3900). The measurements were carried out at 3.2 V, 20 mA.
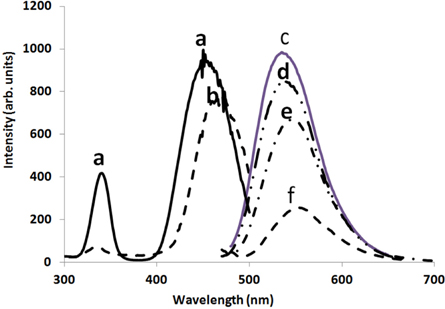
Figure 1 shows the XRD pattern of the GdAG:Ce phosphor that was prepared by combustion synthesis. In our experiments, when urea was used as the fuel, the combustion products were poorly crystallized. Gadolinium nitrate does not have exothermic reaction with urea. Hence, we tried a mixed (Glycine + urea) fuel. Glycine has exothermic reaction with Gadolinium nitrate and urea with aluminum nitrate. An excellent match between the XRD pattern of the GdAG:Ce synthesized using mixed fuel was obtained with the ICDD file 73~1,371. Phase pure GdAG was thus obtained in a single step combustion process without any additional thermal treatment when mixed fuel (Glycine + urea) was used. Activation with Ce3+ or addition of Ga was also attempted by adding cerrous nitrate or Ga nitrate, respectively, to the combustion mixture. Figure 2 shows the PL results for the phosphor so prepared. The excitation spectrum of YAG:Ce (Fig. 2, curve a) consists of several bands; those around 453 and 340 nm are clearly seen. At 460 nm excitation, intense emission is observed with a broad maximum at 535 nm. (Fig. 2, curve c).
Figure 2, curve b describes the excitation spectrum of GdAG:Ce phosphor peaking at 465 nm. This spectrum being broad has good overlap with 470 nm wavelength. Thus, the excitation maximum is red-shifted by 12 nm. The emission spectrum of GdAG is scanned with 470 nm excitation shifted to 552 nm; thus, the emission red-shifted by about 17 nm. But the intensity decreased (Fig. 2, curve f ).
In order to shift the emission wavelength without drop in intensity, (Y,Gd)AG:Ce was prepared. Figure 2, curve d refers to the emission spectrum. There is a marginal red shift by about 2 nm , without much drop in intensity.
In order to retain the red shift of GdAG:Ce but to increase the emission intensity, 10% of Al in GdAG:Ce was replaced by Ga to prepare (Gd2.979Ce0.021)(Al4Ga)O12, henceforth regarded as Gd(Al,Ga)G:Ce.
The peak emission wavelength shifts to the right (Fig. 2, curve e) at 545 nm without greatly affecting intensity. The excitation curve for Gd(Al,Ga)G:Ce is the same as that of GdAG:Ce phosphor and thus, has a better overlap with chip wavelength of 470 nm. For this reason, 470 nm chips were used to fabricate phosphor coated LEDs.
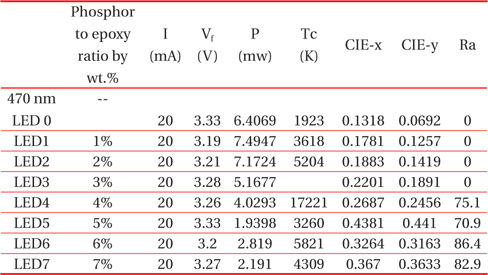
LEDs fabricated by coating YAG:Ce on the blue chips have poor CRI, typically in the range 65-70. Shifting the spectrum to longer wavelengths or adding a red component can improve CRI. To ascertain the performance of the 470 nm chips with Gd(Al,Ga) G:Ce phosphor with respect to these parameters, LEDs were fabricated by coating the 470 nm chips with GdAG:Ce phosphors in proportions given in Table 1. Table 1 lists the various parameters of LED0? LED7 as measured by the Lumen meter (ZWL 3900). LED8 represents Y2.879Gd0.1Al5O12:Ce0.021 having CIE colour coordinates x = 0.32, y = 0.32.

List of various parameters for LEDs fabricated by coating the 470 nm chips with Gd2.979Al4 GaO12:Ce0.021.
3.1 Color Coordinates and CCT of LEDs
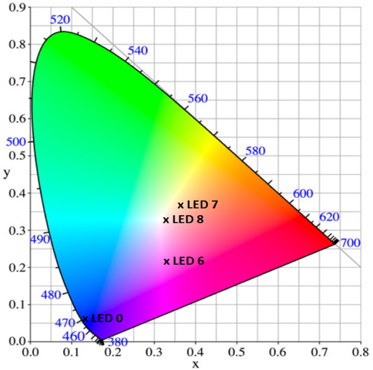
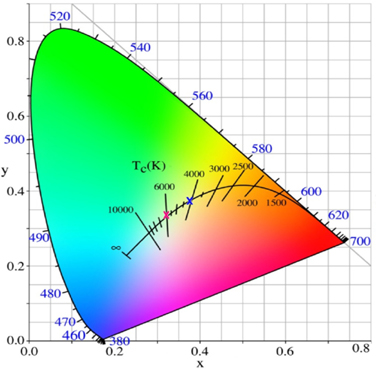
Figure 3(a) represents CIE x and y coordinates of some LEDs. LED 6 and 7 both have good CIE coordinates and hence good CRI of 86.4 and 82.9 respectively, which approach the centre of the chromacity triangle. LED8 has CIE coordinates of x = 0.32, y = 0.32, and hence, has an ideal position exactly at the centre of the chromaticity triangle.
Figure 3(b) represents the colour temperatures of LED6 with Tc = 5821 K and LED7 with Tc = 4309 K. With change in the ratio of GdAG phosphor in the epoxy resin, the blue colour from the diode chip is converted more to phosphor emission.
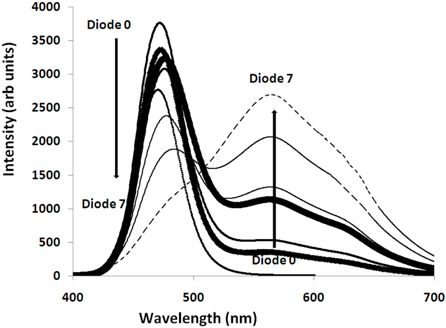
Figure 4 represents the spectra of LEDs 0-7 with the mentioned compositions in Table 1. The downward arrow represents the successive drop in blue emission and the upward arrow represents the corresponding increase in yellow component, which lead to white emission, which in turn improve the CRI from 75 to 86.
Commercial YAG:Ce phosphor has low CRI of 70. We tried to improve CRI by changing the phosphor to GdAG. GdAG:Ce was prepared by combustion synthesis using mixed fuel. LEDs prepared from the 470 nm chips coated with GdAG:Ce considerably improved CRI up to 86.