Recently, rechargeable lithium ion batteries have been widely used in consumer electronics and as power sources for sensors, portable terminals, electric vehicles, and various electronic equipments. Lithium ion batteries are well kwon for their high energy density, wide range of operation temperatures, and battery safety [1-6]. Consumers have obtained satisfaction during use of lithium ion batteries due to their safety, capacity, lifetime, and size. Among the characteristics of lithium ion batteries, safety requirements have been a high priority. However, the safety of lithium battery needs to be developed further [8-12]. Lithium ion batteries are used in everyday life, and liquid electrolytes could cause an explosion or a fire. Solid electrolytes are an alternative because they reduce the risks of liquid electrolytes. Therefore, active research on solid electrolytes is needed in order to develop the properties of solid electrolytes. Among various type of lithium ion batteries, (Li,La)BO3 (B=Ti,Zr) ceramics with a perovskite structure have well known properties of ionic conductivity that are superior (10-3 Ω-1 cm-1 at T=300 K) and (Li,La)BO3 ceramics can use various electrochemical devices [13-16]. The conductivity of these combinations can be represented by the interaction between the concentration of lithium ions and the A-site vacancies. In Li0.5La0.5ZrO3 perovskite ceramics, the absence of nominal vacancies should considerably reduce lithium conductivity. However, conductivity values are near the maximum reported of (Li,La)TiO3 ceramics. Usually among used B-site ions, zirconium can be anticipated to be more electrochemically stable in compounds [7,17,18].
In this paper, we fabricated (Li0.5-xNaxLa0.5)Ti0.8Zr0.2O3 (hereafter, LNLTZ) ceramics (x=0, 0.1, 0.2, 0.3 and 0.4 mole) with Na content. We investigated how Na affects the structural properties and electrochemical characteristics of LNLTZ ceramics, and we found the optimum conditions of Na content.
The LNLTZ ceramics were fabricated via a conventional solidstate reaction. High-purity powders of Li2CO3 (99%, Junsei Chemical Co.), La2O3 (99.9%, Aldrich Co.), Na2CO3 (99%, Aldrich Co.), TiO2 (99%, Junsei Chemical Co.), ZrO2 (99.9%, Aldrich Co.) were mixed and ground with ethanol in a ball mill. After being dried at 100℃ for 24h, the powder was calcined at 1,000℃ for 4h. The calcined powders were pressed into disk samples 12 mm in diameter. The samples were sintered at 1,300℃ for 12h. After the samples were polished to a thickness of 1.0 mm, silver paste was screen-printed onto the surfaces for the electrodes, and then the sample were fired at 400℃ for 10 minutes. The crystal structures of the samples were analyzed via X-ray diffraction (XRD), and microstructures of the samples were measured using scanning electron microscopy (SEM). Impedance spectra were measured using an impedance analyzer (HP4194A) for the samples. The measured frequency range was between 100 Hz and 40 MHz, and the temperature range was kept at room temperature. Agilent IO control software was used to analyze the impedance data and to calculate the conductivity of the samples.
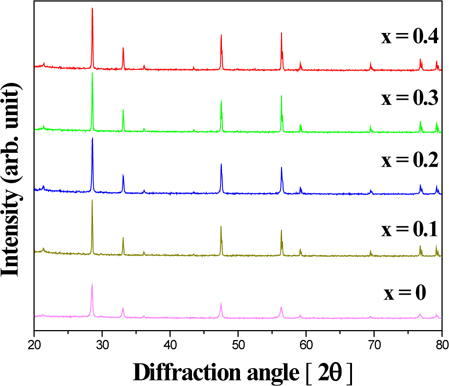
Figure 1 shows the X-ray diffraction (XRD) patterns of LNLTZ(0≤x≤0.4) ceramics samples. All of the samples indicate a perovskite phase, in which no secondary phase is observed. A phase change was not observed and all samples show orthorhombic structure. From Fig. 1, it can be shown that the XRD peak intensities were slightly shifted toward a lower degree with an increasing amount of Na content. These results suggested that Li+ ions were substituted by Na+ ions because their ionic radii are similar, and the ionic radii of Li+ ions and Na+ ions are 0.68 Å, 0.98 Å, respectively. According to Bragg’s law, when Na content increase, the diffraction degree shift slightly toward a lower degree because the radius of an Na+ ion is larger than that of an Li+ ion.
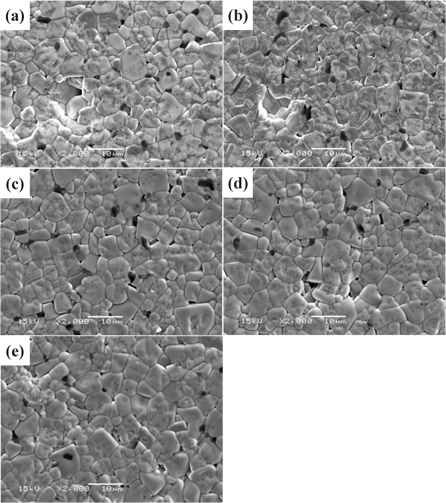
In Fig. 2, microstructures of LNLTZ ceramics (0 ≤ x ≤ 0.4) are revealed after sintering at 1,250℃ with a different amount of Na content. All LNLTZ ceramics have similar shape grains and consisted of fine grains with cavities, which have average sizes smaller than 10 μm. Figure 2(a) shows that LNLTZ ceramics (x=0) have a smaller grain with gaps among them. As the Na ions increase in the A sites, the areas of the cavities decreased. Consequently, the homogeneously grain size of LNLTZ ceramics increases with a higher relative density. Since ionic radius of Na (0.95 Å) are bigger than radius of Li (0.68 Å). The LNLTZ ceramics (x=0.4) have an average particle size of about 6.8 μm and the surface of the grain is smooth. These results indicated that different Na/ Li ratios of LNLTZ ceramics affect their structural and electrical properties.
[Fig. 2.] SEM micrographs of LNLTZ ceramics (a) x=0, (b) x=0.1, (c) x=0.2, (d) x=0.3, and (e) x=0.4.

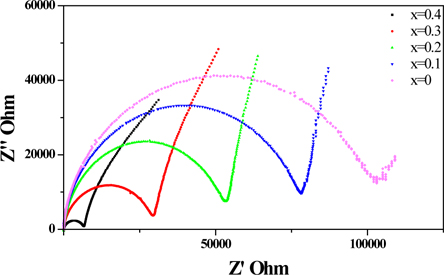
The electrical properties of LNLTZ ceramics were determined by using the AC impedance spectra. To investigate the influence of various Na content, measurements were taken at room temperature in air. Figure 3 shows two semicircles and a tail, where each semicircle represents a grain and a grain boundary. The semicircle and tail are clearly distinguished at low frequencies. The tail is the electrode and the blocked movement of lithium ions. The high frequency is composed of a grain and grain boundary, and the semicircle of a grain is smaller than a semicircle of the grain boundary. Resistance of the grain is smaller than the resistance of the grain boundary. When Na content increased from x=0 from x=0.4, depending on the composition, each radius of the semicircle gradually decreased because the resistance of the LNLTZ ceramics decreased. These phenomena suggested that when Na content increases and Li is difficult to move, the vacancies of the A-sites are filled.
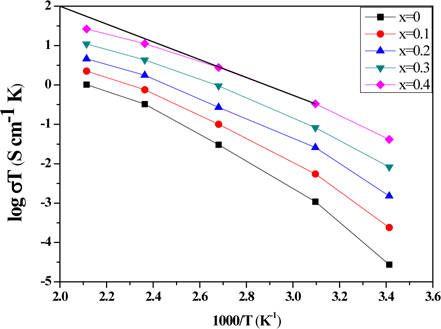
Figure 4 shows the temperature dependence of the electrical conductivity (Arrhenius plot) for LNLTZ ceramics with Na (0 ≤ x ≤ 0.4). Each of the LNLTZ ceramics were measured in a temperature range within room temperature. When doped-Na content increased, the electrical conductivities of LNLTZ ceramics increased. For x=0.4, the electrical conductivity was higher than that of other samples. When doped-Na content was 0.4, the electrical conductivity showed maximum value measured at room temperature because the cell volume of LNLTZ increased.
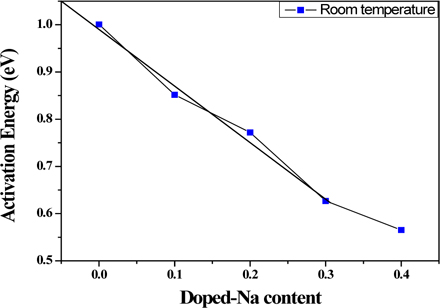
According to the conductivity in Fig. 4, Fig. 5 shows the activation energy of the LNLTZ ceramics. The activation energy is inferred from the Arrhenius plots of the electrical conductivity. When Na content increased, the activation energy decreased from 0.56 eV to 1 eV measured at room temperature. The activation energy decreased through an increase in Na content because the electrical conductivity and cell volume increased.
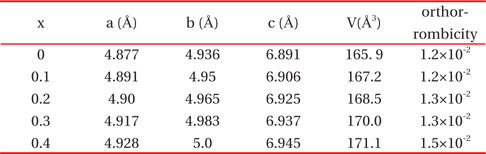
The variation in the lattice parameters, volume, and orthorrombicity for the LNLTZ ceramics ranged from x=0, 0.1, 0.2, 0.3, and 0.4 are shown in Table 1. It can be seen that with increasing Na content, the lattice parameters, volume, and orthorrombicity linearly increased because Na+(0.95 Å) ions entered the Li+(0.68 Å) site. In particular, high orthorrombicity caused superior electrical properties. A similar study had been performed by Y. Kawakami et al. [20]. LNLTZ ceramics (x=0.4) show strong orthorhombic structure, and theirvolume and orthorrombicity were 171.1, 1.5×10⁻² respectively.
[Table 1.] Lattice parameters, volume, and orthorrombicity for LNLTZ.

Lattice parameters, volume, and orthorrombicity for LNLTZ.
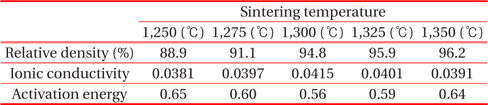
Table 2 shows the relative density, ionic conductivity, and activation energy value measured at room temperature of the LNLTZ sintered at various temperatures. When sintering temperature increased, the relative density increased. However, for sintering the temperature of 1,300℃, the relative density was not the maximum value because the liquid phase was insufficient to allow liquid phase sintering. At a sintering temperature below 1,275℃, ionic conductivity increased to 0.0397 Scm-1 and activation energy decreased to 0.6 eV. When the sintering temperature reached 1,300℃, the ionic conductivity and activation energy showed a higher value than at other sintering temperatures. The maximum values of ionic conductivity and activation energy were 0.0415 Scm-1 and 0.56 eV, respectively. However, when sintering temperature exceeded 1,300℃, the value of ionic conductivity decreased and activation energy increased. In this result, the higher sintering temperature led to a decrease in the electrochemical properties of the LNLTZ ceramics.
[Table 2.] Ionic conductivity and activation energy for LNLTZ.

Ionic conductivity and activation energy for LNLTZ.
In this paper, LNLTZ ceramics (0 ≤ x ≤ 0.4) were fabricated via a standard solid-state synthesis route, and the influence of Na content on the structural and electrical properties of LNLTZ ceramics samples were investigated. From the XRD analysis, we discovered that the increased Na content of LNLTZ ceramics produced good perovskite structure. AC impedance spectra indicated that the LNLTZ ceramics showed superior electrical properties when x=0.4. Electrical conductivity of LNLTZ ceramics increased with increasing Na content, and when x=0.4, LNLTZ samples had a superior ionic conductivity than that of other compositions. At x=0.4, the activation energy was of 0.56 eV at room temperature. These results indicated that the LNLTZ ceramics are promising electrolyte materials for application in lithium ion batteries.