With the rapid progress of the display industry, 3D display technologies have been developed such as a nonglasses 3D display panel with a micro-lens array [1]. A measurement of a micro-lens array has been very important for the fabrication of a high quality 3D display device. A lenticular lens is widely used for the micro-lens array of a 3D display panel. Various reports have been published on measuring lenticular lenses, yet most have cylindrical shapes. Recently, a micro-Fresnel lens-shaped lenticular lens was adapted to the micro-lens array for the fabrication of a thinner 3D display panel.
There are many surface profiling technologies, for the 3D shape measurement of micro-lens arrays. Contact type methods using a probe have limitations in measuring small features due to the size of the probe tip. Thus, non-contact technologies such as confocal microscopy [2, 3], fringe projection, interferometry [4], wavefront sensing [5], and holography [6, 7] are preferred in measuring features of the micro-lens array. Although confocal microscopy is useful in micro-optics characterization, it requires a time-consuming point scanning in order to make 3D measurements [3]. A scanning white light interferometer (SWLI) is a noncontact technique using white light as a speckle-free light source, and can be configured to an automated system easily. As the coherence length of the white light is very short, SWLI is normally applied to a reflective interferometer. A reflected beam from a specimen is used to make an interference signal in the reflective interferometer. Thus, SWLI has a low visibility problem in measuring specimens that have a high angle surface profile. In contrast, a transmissive interferometer uses a transmitted beam through the specimen to make an interference signal. A laser is normally used as a light source in the transmissive interferometer. A phase shifting interferometer (PSI) and a digital holographic microscope have been actively researched in recent decades [8, 9]. In this paper, we describe the advantages of transmissive laser interferometer in measuring optical components as compared to using a reflective white light interferometer and AFM. A high NA (numerical aperture) objective lens, a mega pixel camera, or an immersion medium are selectively adapted for precise measurement [10]. We configure an optics system based on the Mach-Zehnder interferometer (MZI) that consists of optical components which are effectively adapted for an automated in-line system in industry.
PSI is a technology that has a high vertical resolution, however, it has a phase ambiguity problem when it measures a specimen which has a big difference between adjacent pixels, for example, the facet’s height of Fresnel lens is greater than one half of the wavelength. Various algorithms have been researched to solve the phase ambiguity problem in an interferometry technology field. Wyant [11] developed the white light phase shifting interferometer (WLPSI) by a combination of SWLI and PSI, which has a high vertical resolution without the phase ambiguity. The WLPSI is widely used in industry [12]. The SWLI does not have phase ambiguity [13, 14], yet is less precise. The PSI has phase ambiguity, yet can have a high vertical resolution. The WLPSI is a combined technology having advantages of both SWLI and PSI. However, the WLPSI has a limitation of short coherence length.
A multiple-wavelength interferometric technique was reported to solve this ambiguity with a longer equivalent coherence length in PSI [15-18]. This technique works for a clear step height, however, it does not work well on a rough surface, and multiple light sources are needed. Therefore, we propose a new two-step unwrapping method, when the height of facet is greater than one half of the wavelength. The proposed method needs a single wavelength diode laser for ambiguity-free measurement in PSI.
II. TRANMISSIVE LASER INTERFEROMETER SETUP
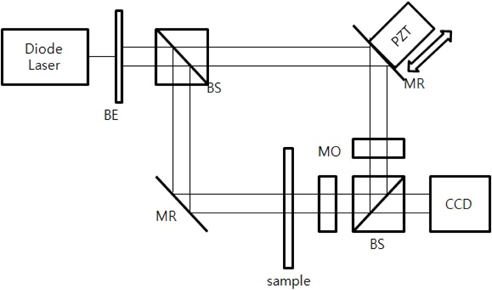
The schematic diagram of laser interferometer based on the MZI is shown in Fig. 1. A laser (diode laser, 10 mW, 555.5nm) beam through a beam expander (BE in Fig. 1) is divided into an object arm and a reference arm by a beam splitter (BS in Fig. 1). The beam that goes toward the object arm passes through the specimen, micro-lens array. Then it passes an objective lens (MO in Fig. 1) and enters another beam splitter. This optical path passing the sample is an object arm. Comparing to the object arm, another beam divided by the BS is reflected by a mirror (MR in Fig. 1), which is moved by a Piezo actuator (PZT). The reflected beam enters the beam splitter after passing an objective lens that has same specifications as that in the object arm. Two beams are combined in the beam splitter to make the interference signal. The reference mirror actuated by PZT is controlled in a closed loop with a capacitance sensor for precise phase-shifting.
An objective lens with high numerical aperture (NA), mega pixel camera, or immersion medium are normally adapted for precise measurement.[10] In this paper, a mega-pixel camera (HM1400 CCD Camera, 1400 × 1024 pixels, pixel size 7.5 um) is used for a high lateral resolution. It needs to select a proper magnification of the objective lens depending on the specimen size. It is possible to measure the entire lens unit when using a low magnification lens that has a large field of view (FOV), however, it has a low resolution. In contrast, there is a small FOV problem when using a high magnification lens. The optical resolution
3.1. Limit of a Specimen Angle with a Reflective Interferometer
Normally the cylindrical lenticular lens does not have a high angle slope. In the case of measuring the cylindrical lenticular lens, the reflective interferometer (e.g., Mirau interferometer) can be adapted, and Fig. 3 presents the results obtained. However, if a specimen has a high angle slope, the reflective interferometer may suffer from a low visibility problem of an interference signal. The transmissive interferometer is more effective in measuring optical components, because lenses are used to transmit a light. Thus, a configuration of the transmissive laser interferometer is adapted to utilize the specimen’s transparent property in measuring the mFLL. A reflective coefficient can be expressed by the Fresnel equation, according to the angles of incidence, a refractive index of the medium, and a refraction angle [19].
For the s-polarized light, the reflection coefficient, Rs, is given by For the p-polarized light, the reflection coefficient, Rp, is given by where the subscripts are, n1, n2, θi, and θt, which represent the refractive index of an ambient, the refractive index of a material, the incident angle, and the refractive angle.
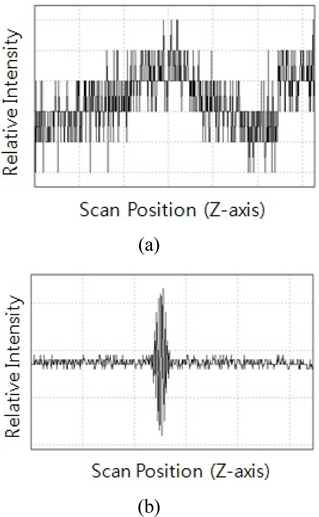
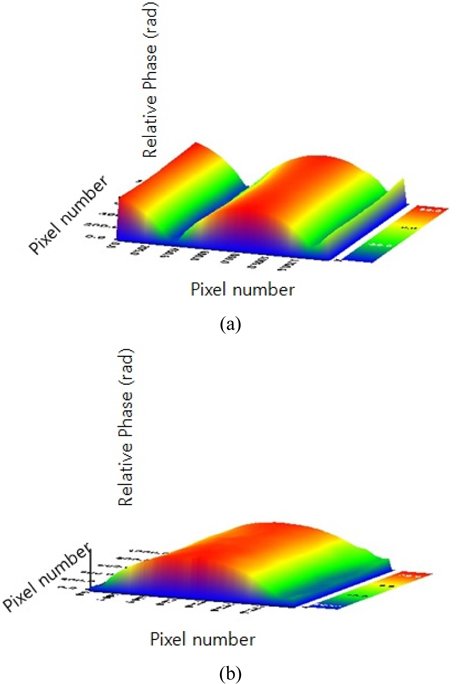
An amount of reflected light from the specimen’s surface diminishes according to an increase of the incident angle. This relation can be expressed by a change of the reflection coefficient in Eq. (2) and (3). On the contrary, a reflected beam from the reference mirror is not changed according to a specimen. An incident beam always enters to the reference mirror perpendicularly. A difference between a reference beam and an object beam creates a problem of low interference signal. A thick convex lens or a Fresnel lens makes a low interference signal, because of low reflected intensity from the specimen’s surface. The interference signal is shown in Fig. 4 (a), when the mFLL is measured by the reflective interferometer. The signal to noise ratio is too small to analyze the interference signal. An interference signal is shown in Fig. 4 (b), when the cylindrical lenticular lens is measured by the reflective interferometer. This signal can be analyzed to make a lens surface profile that is shown in Fig. 3.
3.2. Ray Tracing of Micro-Fresnel Lens-Shaped Lenticular Lens
The advantage of the transmissive interferometer in measuring the specimen which has a high angle surface profile can also be found by using the ray tracing analysis method. A maximum angle of incoming beam to a light cone of an objective lens is defined by the NA of the objective lens and the refractive index of medium, specifically,
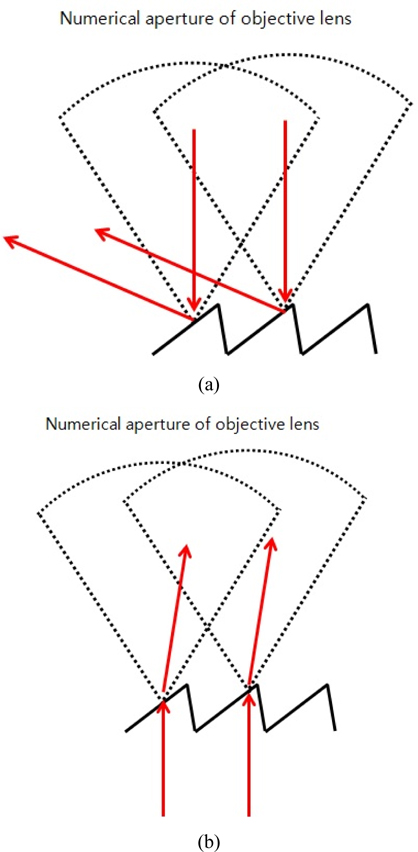
When using an objective lens having 0.55 NA, the maximum angle of the incoming is about 30°, assuming normal use in air (n=1).[20] This configuration usually works for complex micro features having low angle surfaces [21]. However, in measuring micro-Fresnel lenses that have inherent high angle surfaces, the reflected beam does not enter the light cone of the objective lens in comparison to the transmitted beam. Figure 5 presents the difference between reflective and transmissive.
IV. UNAMBIGUOUS PHASE SHIFTING INTERFEROMETRY FOR THE MICRO-FRESNELS LENS-SHAPED LENTICULAR LENS
4.1. Ambiguity Problem in Measuring Micro Optics
In a phase-shifting interferometer, an intensity of interferogram in a measurement point (x, y) is given by
There are three unknowns: an average intensity of interference signal IDC, a visibility of interference signal γ , and an initial phase
The 2 π ambiguity occurs because of this arctan calculation in Eq. (6). Therefore, a relationship between a measured phase and a continuous phase
The Ki should be defined to obtain the continuous phase 𝜙
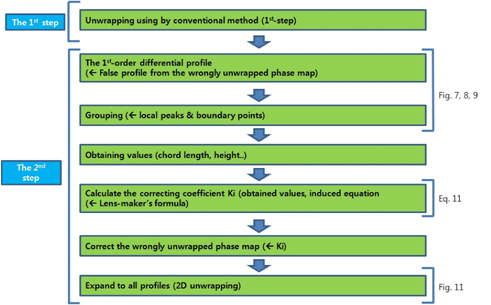
If a wrapped phase map is unwrapped by a conventional unwrapping method, adjacent pixels are connected continuously in a range of 2 π . The unwrapped phase map is different from a real phase map of the specimen. The wrongly unwrapped phase map should be corrected to match the real surface of the specimen. A determination of exact 2Kiπ is needed to correct the wrongly unwrapped phase. It is hard to find the accurate 2Kiπ from the only wrapped phase map without more information. Therefore, we propose a combined phase unwrapping method with the second step based on a shape modeling. The wrongly unwrapped phase map can be corrected by using information of the real shape of the specimen. The mFLL’s information is obtained from some equations in lens making. The exact solution of 2Kiπ can be obtained.
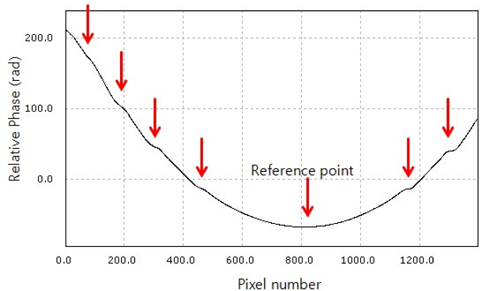
The proposed method begins by extracting boundary points from the wrongly connected phase profile that was obtained by a conventional method in the first step. The boundary points are shown as discontinuities or inflection points in the profile, or appeared as edges in a tomography image. Because a facet’s height of the mFLL is higher than one half of the wavelength (0.555 um) of the laser source, a phase ambiguity occurs in PSI. That is a wellknown ambiguity problem in PSI [30, 31]. In this specimen, correcting points are shown as inflection points in the profile.
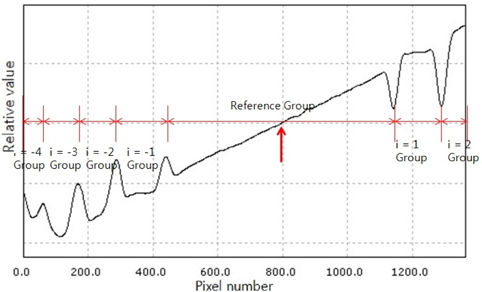
The groups are defined by separating between adjacent pixels of discontinuities. One of the divided groups is assigned to a reference group. After comparing each group with the reference group, deviations can be calculated. A critical dimension (CD) and height of the center part of spherical convex surface in the Fresnel lens can be obtained from the reference point and boundaries. If a focal length of the Fresnel lens is known, a radius of lens can be calculated using these values in the lens-maker’s formula. Otherwise, the radius and height of the facet can be obtained from the radius of the convex part by deriving the following relationship equation.
𝜙ret is a phase of the center of the reference group, or the center part of the spherical convex surface. 𝜙i is a phase of the boundary point in the i-th group from the reference group, when i is , -3, -2, -1, 0 (reference group), 1, 2, 3, . The equation is converted into the equation for the height as follows: where n is the refractive index of lens as a specimen, hRef is the height of the reference group, hi is the height of the i-th group, and Ki is a correcting coefficient integer. To determine Ki, the target lens profile is reconstructed with information retrieved from measured data. Since the target Fresnel lens is constructed from a spherical plano-convex lens, the measured radius of the second surface can be derived from a known focal length or by fitting of measured surface. The distance from string C to the vertex of the center section of the lens, href, can be derived with known length of the string, lc, and the radius of the second surface, Rs, as following.
The Ki can be obtained from Rs and lc of the reference group, then applied for all points of each group to correct the wrongly unwrapped phase. A final unwrapped phase map can be obtained by expanding to a direction parallel to the micro-lens array, which is a 2D-unwrapping. A flow chart of the proposed method is shown in Fig. 6.
4.3. A Boundary Detection Method to Measure the Relief Facet in the Proposed Unwrapping Method
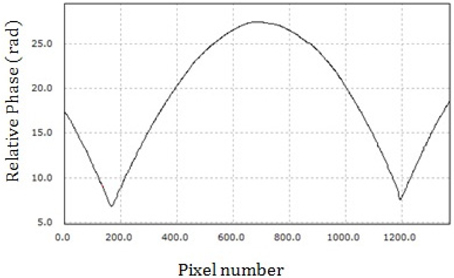
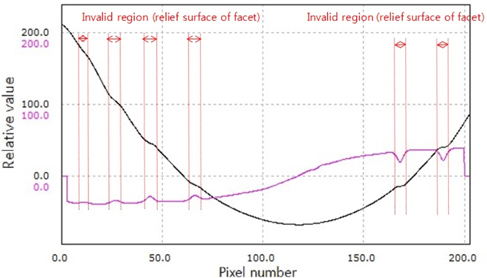
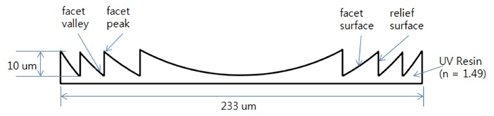
We propose a boundary detection method to separate groups, which is independent of a specimen shape. This is a generalized method to obtain boundary points from an unwrapped phase map without specimen information. First, the 1st and 2nd order differential profiles are derived from an unwrapped profile obtained by using a conventional phase unwrapping method. From these functions, the zero-crossing, inflection, local maximum, and minimum points are found. To find the boundary points stably, a least squares polynomial fitting is applied. The 1st-order differential profile with the least-square polynomial fitting is shown in Fig. 8. The local peaks are boundary points in the generalized boundary detection method for arbitrary shapes of the specimen. After separating the groups on the basis of the boundary points, each group is identified with the reference group. There is no need for specimen information until the separating and finding a boundary in this generalized method. This approach also helps the reliability of the measurement. As the absolute value of the phase error at each boundary points should be smaller than one half of the wavelength, with a lens material of a refractive index (n=1.49 at 0.555 um), which is shown in Fig. 2. Although the wave-front error of this kind of precision plastic lens is typically less than a quarter of the wavelength [32], the proposed method will avoid the chance of misplacing facet surfaces.
As light cannot be transmitted in a surface of relief facet, a minimization of that region is important in a fabrication of the Fresnel lens. The proposed boundary detection method is used to define boundary points of each group matched to the relief facet. The boundary points of an inflection obtained by using a conventional phase unwrapping method (Fig. 7) are matched to the boundary points around the local peaks in Fig. 8. A combined figure of Figs. 7 and 8 is shown in Fig. 9. A region of the boundary points of each group is an invalid region of a measured surface in interferometry, because the light source cannot be transmitted the region. The corrected surface profile of the Fresnel lens can be obtained by modifying the boundary points of each group with considering the invalid region. A correcting coefficient Ki is defined by the difference between the reference group and the i-th group in a wrongly unwrapped phase profile compared with the specimen shape. The Ki is applied to all points of the i-th group for correcting the unwrapped phase profile. The specimen information is needed only to determine the Ki as described above.
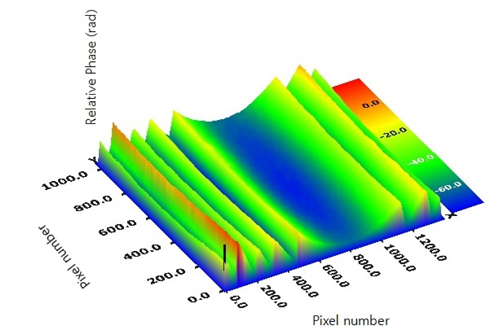
The measurements of cylindrical lenticular lenses were carried out with the MZI having a high resolution. Figure 10 presents the results obtained. An unambiguous 3D map and a profile of the mFLL is shown in Fig. 11. As the facet’s height is about 10um, the results were corrected with the proposed unwrapping method.
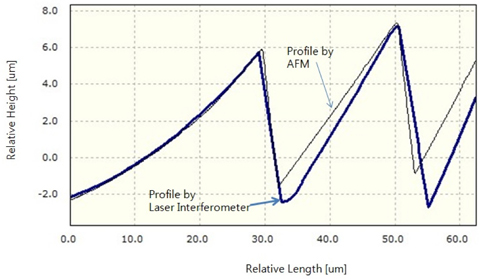
Comparison of the interferometer and AFM reveals the effectiveness of the transmissive interferometer in measuring the mFLL. The profile was obtained by AFM, has a 90 um X 90 um FOV (XE-150 of Park systems). In a measurement method of the contact type, such as AFM, there is a measurement limit due to the presence of an unreachable area of the measuring probe. The false trace of AFM is shown in Fig. 12. This can be interpreted as the negative effect of a probe tip, which is unavoidable in contact methods. This also happens when using a non-contact cantilever in the AFM. On the contrary, this problem can be solved by the proposed method with utilizing the transmissive interferometer having a high resolution.
(1) A transmissive laser interferometer to measure a micro- Fresnel lens-shaped lenticular lens is developed. A high resolution configuration in a transmissive laser interferometer is adapted to measure the facet of the mFLL precisely.
(2) The phase ambiguity problem is observed at facets having height greater than one half of the measurement wavelength. To remove this ambiguity, a new two-step phase unwrapping method is proposed. At the first step, the phase map is obtained by using a conventional unwrapping method that is applied to the wrapped phase map, and then the proposed unwrapping method based on the shape modeling is applied to correct points that show 2π -ambiguity.
(3) The wrongly unwrapped phase map can be corrected by using information of the real shape of the specimen. The mFLL’s information is obtained from some equations in lens making.
(4) To obtain a better result of the shape modeling in the new method, we proposed a boundary detection method that is independent of the specimen shape. The relief facet of the Fresnel lens can be defined by using the proposed method.
(5) Based on a comparison of the profiles between the proposed method and the AFM, we described a measurement limit due to a presence of an unreachable area of the measuring probe in the AFM. The problem can be solved by the proposed method in utilizing the transmissive interferometer having a high resolution.