A circular anisotropy is generated in an otherwise isotropic atomic medium by applying a circularly polarized laser beam. This generated circular anisotropy is characterized by the susceptibility whose real (imaginary) part represents the circular birefringence (dichroism). The birefringence can be measured by detecting the polarization rotation of a counterpropagating weak probe beam. This is called polarization spectroscopy (PS) [1]. In contrast, the circular dichroism can be measured by detecting the difference in the transmissions of the opposite circular components of the probe beam, which has recently been called polarizationenhanced absorption spectroscopy (POLEAS) [2] although the similar nature was well-known in the spectroscopy such as dichroic atomic vapor laser lock (DAVLL) [3]. PS and POLEAS can be measured in a single experimental setup by changing analyzing optics after the probe beam passes through the cell. As in usual saturated absorption spectroscopy (SAS) [4], a sub-Doppler resolution can be obtained in PS and POLEAS because only atoms belonging to specific velocity classes contribute to the signal.
In particular, PS has been widely used in laser frequency stabilization due to its non-modulation characteristic. There were many experimental and theoretical reports on PS for various atomic species [5-13]. From the perspective of an analytical study of the lineshape of PS, Nakayama's model was widely used for simple prediction of the PS spectra [14]. We presented also analytical solutions of the PS spectra for Rb atoms under the approximation of weak intensity [15]. When the pump beam intensity is arbitrarily large, it is impossible to obtain analytical solutions for the complicated transition lines of the atoms such as Rb or Cs. However, it is possible for the simple transition of Jg=0 → Je=1 of the atoms such as 88Sr or Yb. We note that experimental demonstration of PS using Sr was reported [13, 16]. Recently, we reported analytical solutions of the PS spectra for the transition Jg=0 → Je=1 using reasonable approximation that the Doppler broadening linewidth is much larger than the natural linewidth of the atoms [17]. Extending the previous study we consider arbitrary magnitudes of the two linewidths and obtain analytical solutions of the PS and POLEAS spectra. Since exact analytical solutions of the PS and POLEAS spectra are obtained regardless of the ratio between the Doppler broadening linewidth and the natural linewidth of the atoms, it is possible to obtain analytical forms of the spectra for various atomic samples such as an atomic vapor and cold atoms. It may also be possible to extend to the case of inhomogeneously broadened solids [18]. We also present analytical solutions of the SAS spectra whose analytical form under the narrow natural linewidth approximation is presented in the textbook [19].
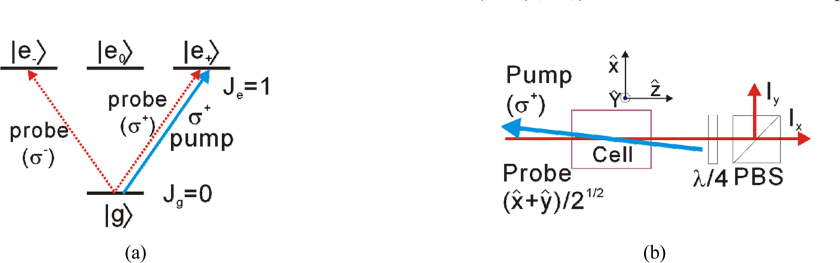
The energy level diagram and schematic of the spectroscopic scheme are shown in Figs. 1(a) and (b), respectively. We consider the atomic transition Jg=0 → Je=1 as shown in Fig. 1(a). The pump beam is σ + polarized, whereas the probe beam is linearly polarized with an inclination angle of π /4 with respect to the x axis. The propagation directions of the two beams are opposite. The detected signal is the difference in the intensities along the x and the y axes, i.e. ΔI =Ix − Iy . The schematic of POLEAS is shown in Fig. 1(b), where a quarter-wave plate is placed after the cell. In contrast, the quarter-wave plate is removed in the setup of PS. The variation of the arbitrarily polarized probe beam after traversing a circular anisotropic atomic medium was reported [20].
Since the details of calculating the susceptibilities are described in [17], we review briefly the method of calculating the susceptibilities in this paper. In the atomic rest frame moving at velocity v, the susceptibilities of the σ± components of the probe beam are given by
where p is the population of the ground state, q± are the populations of the excited states ( e± ), and Nat represents the atomic density in the vapor cell. λ is the resonant wavelength, k is the wave vector, δ is the laser frequency detuning, Γ is the decay rate of the excited state, and γt is the decay rate of the optical coherence which is normally Γ/2 in the absence of the collisional broadening. When the populations p and q± are calculated, the effect of the probe beam is neglected. The populations can be analytically calculated as follows:
where A = (δ + kv)2 + γt2, B = Ω12 γt/ Γ , and Ω1 is the Rabi frequency of the pump beam [21]. Therefore, the susceptibilities in Eq. (1) are given by
where η + =1 and η− =1/2 .
Now Eq. (2) is averaged over the Maxwell-Boltzmann velocity distribution as
where u is the most probable speed of the atom. When the integration is performed, we have used the following result:
with s=sign[Im(z)]. Finally the averaged susceptibility is given by
where
and s0 (=Ω12/(γt Γ)) is the on-resonance saturation parameter. The first term on the right-hand side in Eq. (3) represents the background signal.
Just after the atomic cell, the electric field of the probe beam is changed slightly from the incident one due to interactions with the atoms. When the intensity and the inclination angle of the incident probe beam are I0 and θ 0 (=π /4), respectively, the values I and θ after traversing the atomic cell of the length l are given by
respectively, with a± =exp[-(kl/2) Im(χ±)] [20]. The rotation angle is given by Δθ = (kl/4) Re(Δχ ) where the difference in the susceptibilities, Δχ (≡χ−− χ+), is given by
with
w(=2δ/γt) is the normalized detuning and μ(=ku/γt) is the ratio between the linewidths of the inhomogeneous and homogeneous broadenings. μ is approximately 30 for 88Sr atoms placed at room temperature. At a typical experimental condition, when μ ≫1, the real and imaginary parts of the susceptibilities are given by explicitly
respectively.
In the absence of an optical element after the cell, the PS signal, the difference in the intensities along the x and the y axes, is given by
where the following approximation is used because of small absorption:
In the presence of a quarter-wave plate whose optic axis has an angle of π /4 with respect to the x axis, the POLEAS signal, the difference in the intensities along the x and the y axes, is given by
In Eq. (5), the PS signal is proportional to Re(Δχ ) , and the POLEAS signal is proportional to Im(Δχ ) in Eq. (6) where Δχ is in Eq. (4). When μ ≫1, the PS and POLEAS signals can be expressed in a more convenient way as
respectively.
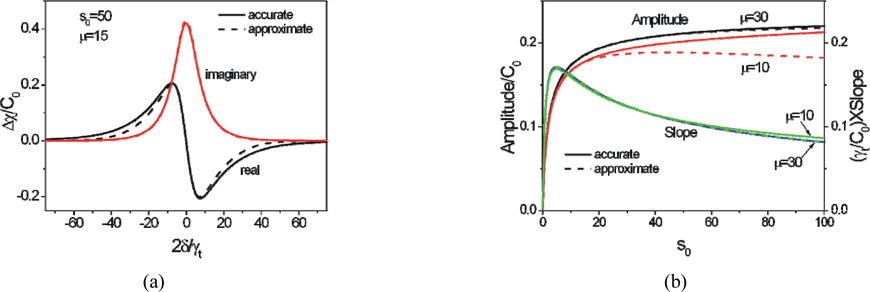
We present typical plots of the real and the imaginary parts of accurate (Eq. (4)) and approximate (Eq. (7)) values of Δχ in Fig. 2(a). In Fig. 2(a), accurate and approximate values of Δχ are shown in solid and dotted curves, respectively, where s0 = 50 and μ = 15 . There is a slight discrepancy between the two results for the real part of Δχ . We found no significant discrepancy for the imaginary part of Δχ at this condition. Fig. 2(b) shows the maximum amplitude and the slope of the real part of Δχ (PS spectrum) as a function of s0 for the two different values of μ = 30 and μ = 10 . Accurate and approximate results coincide well at a usual experimental condition of μ≃30. However, there are discrepancies between the two results, in particular, for the amplitude. The weak dependence of the slope on μ results from the fact that the discrepancy occurs at larger detunings.
Finally we mention briefly the SAS spectrum for two-level atoms. When only the σ + component of the probe beam is considered, the scheme is identical to the case of two-level atoms. Therefore, we can obtain the absorption coefficient for two-level atoms as follows:
The first term on the right-hand side in Eq. (8) represents the background signal in the absence of the pump beam. Eq. (8) can be simplified when the condition, μ ≫1, is satisfied as follows:
which is the well-known expression found in the textbooks [19].
We have presented an analytical study of the lineshapes in PS and POLEAS for the atomic transition Jg=0 → Je=1. PS and POLEAS can measure the birefringence and dichroism, respectively. Eqs. (4)-(6) are the main results of this paper. Unlike the cases for the atoms with complicated structure such as Rb and Cs, the only mechanism responsible for the signals is the saturation effect caused by the pump beam, which enables us to calculate the signal regardless of the magnitude of the pump beam intensity. The results provided in this paper can be used in studying PS and POLEAS using 88Sr or Yb atoms.