The main roles of skeletal muscle are to cause muscle contraction for physical movement and to maintain body temperature by utilizing by-product heat during contraction. The size and composition of muscle are mainly determined by an individual level of physical activity, nutrients and hormones. However, unavoidable activity limitation due to an injury, illness, genetic disorder, or sedentary lifestyle can cause the reduction of muscle mass, or muscle atrophy [1, 2].
According to the previous studies, muscle atrophy occurs by protein turnover which is the imbalance between synthesis and degradation of muscle fiber[3, 4]. During the aging process, muscle loss is caused by various factors; exercise habits, dietary habits and lifestyle, without disease or injury [5]. In general, muscle mass has been shown to decline by 0.5 to 1% per year with 3-5% reduction in muscle strength spanning 10 years between the ages of 40 and 50, and a 1-2% of decline of mass every year in people aged 60-70. Particularly, femoral muscle mass, which has shown significantly greater atrophy in comparison to other muscles, decreased by approximately 24-27% through the ages of 20 to 70 [6, 7].
Sarcopenia, or reduced muscle mass and volume, is accompanied by the loss of muscle strength because muscle produces strength and power in proportional to cross sectional area of the muscle bundle. This vicious cycle hampers locomotion, increases the risks of injuries and diseases, limits independent living, and collectively deteriorates the quality of life [8-10].
Maintaining or increasing muscle tone through physical activity or exercise, reverses the muscle degeneracy via cellular control reaction to up-regulate the synthesis of contractile muscle fiber as well as to rebuild the associated tissues including connective, nervous, and vascular tissues. As physical function is recovered, the risk of chronic diseases and injuries can be lowered [2, 10].
Clinicians not only need to understand the mechanism of sarcopenia but confirming an early diagnosis would be crucial in the prevention of muscle loss. However, it is made difficult by a lack of techniques to image changes of muscle structure. Histology is the gold standard to provide a morphological information but it requires an excision of muscle tissue. Therefore,
Optical coherence tomography (OCT) is usually based on Michelson interferometer utilizing backscattering of near infra-red light from tissue. It provides cross-sectional images of micro-tissue morphology with a high resolution (2-10 μm) in a non-invasive manner but imaging depth is limited to 1-2 mm. Previous OCT studies [11-13] have visualized changes of muscle microstructure using an mdx mouse model for Duchenne muscular dystrophy. In order to image deep skeletal muscle structure, a needle probe has been proposed [14]. However, no OCT study has been done to image changes in muscle structure associated with sarcopenia, to the best of our knowledge. In this study, we developed an animal model using denervated rats to induce rapid muscle atrophy and imaged muscle structural changes using OCT along with histological and ultrasound analyses.
Two male Sprague-Dowley rats (200~250g) were kept in a controlled environment of 23±2℃, 55±5% humidity and a 12-hour light, 12-hour dark lighting cycle. Commercial rodent pellet diet and water were supplied ad
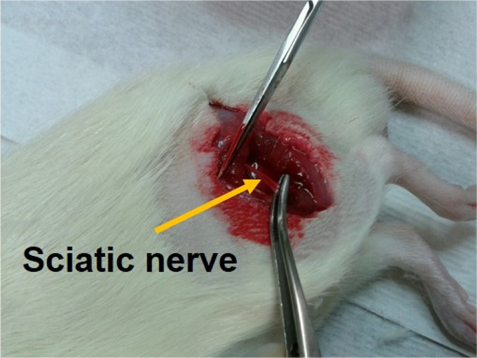
To induce rapid atrophy of muscles in laboratory rats, sciatic nerves were dissected in accordance with surgical procedure, as previously described [15]. In brief, the sciatic nerve of the hind limb was dissected and removed (5-10 mm) unilaterally and the counter part was sham-operated as a control.
Before surgery, rats were anaesthetized using an intraperitoneal injection of pentobarbital sodium (50 mg/kg BW). The left sciatic nerve was separated and removed (4-5 mm) as shown in Fig. 1.
[FIG. 1.] Left sciatic nerve was dissected by surgical procedure to make a rat model for sarcopenia.

A rapid loss of muscle mass was observed in 2 weeks after denervation and progressively reduced during the following 2 weeks [16]. Four weeks after the surgery tibialis anterior (TA) muscles were separated from both distinguished hind limbs of each animal.
The rat was euthanized using CO2 gas. TA muscle was dissected and fixed by 10% neutral buffered formalin (NBF), and embedded in paraffin. Four-micrometer-thick serial sections were stained with hematoxylin and eosin (H&E) and examined by microscopy.
2.3. Optical Coherence Tomography System
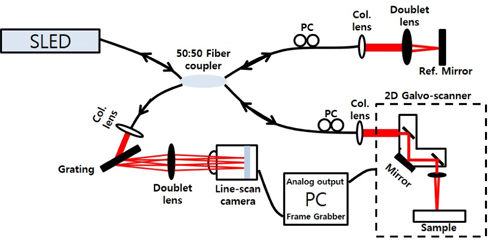
We constructed a spectrometer-based OCT system as shown in Fig. 2. It was a fiber optic Michelson interferometer. A broadband SLED light source (Broadlighter D855, Superlum, Ireland) with a center wavelength of 850 nm and a full width at half maximum of 100 nm was used. The light was directed to a 50:50 coupler that split the light into reference and sample arms. Backscattered lights from a reference mirror and a sample produced an interference fringe. The fringe pattern was collected by a line scan camera (Sprint spL4096-140km, Basler, PA, USA) with a line rate of 140 kHz and 4096 pixels. A two-axis scanner was customized using two galvanometers (6220H, Cambridge Technology, MA, USA). Five hundred twelve B-mode images of each TA muscle were acquired at 10 fps for 1024 lateral pixels. Three dimensional images (5.12×2.56×3.2 mm3) were rendered using the 512 B-mode images. A cross-sectional image could be reconstructed in any direction by image processing. The point spread function was measured and showed a depth resolution of 4 μm in air, a roll-off of 12 dB/mm, and a signal-to-noise ratio of 103 dB.
2.4. High Frequency Ultrasound System
As a multimodal imaging approach, we also used a high resolution ultrasound system (Sonix Touch, Ultrasonix, Canada) with a high frequency linear transducer (40-8 MHz) with a depth range of 0.2-3 cm and a geometric focus of 6 mm. Imaging parameters for this study were set as follows: 40 MHz of frequency, 2 cm of imaging depth, 1.2 cm of imaging width, 85 dB of dynamic range, and 63 Hz of frame rate.
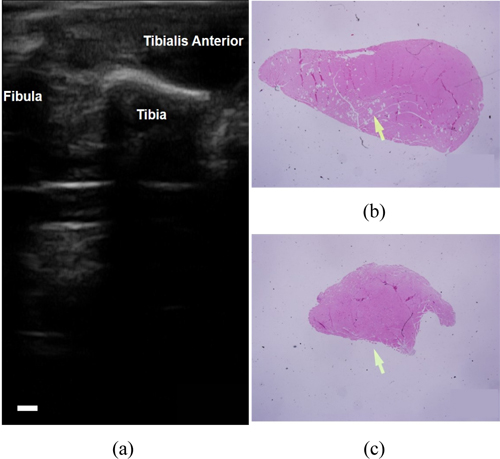
Figure 3(a) shows a typical
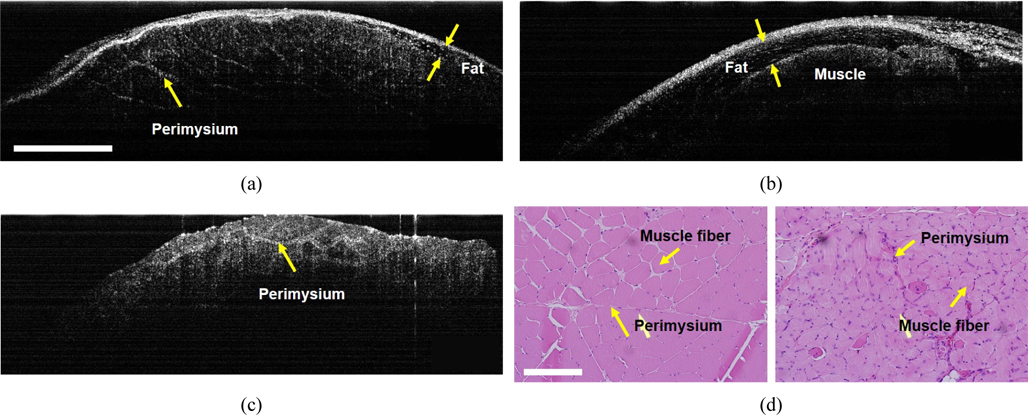
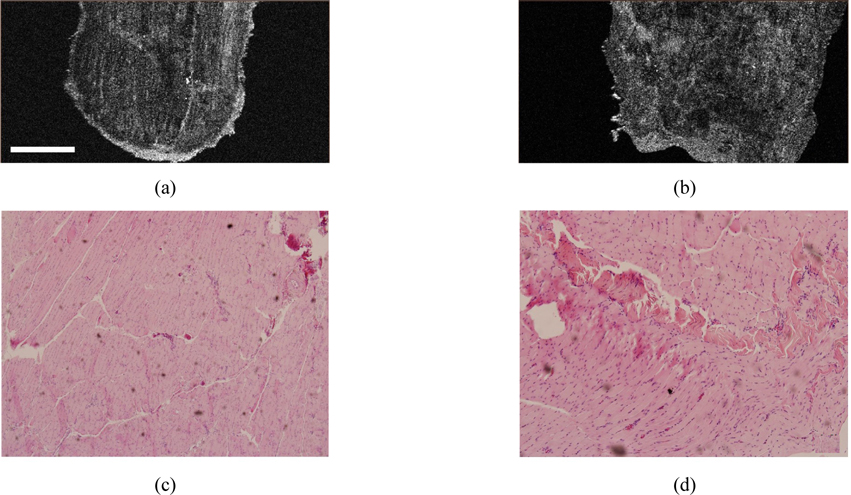
OCT was applied to image detailed structures of TA muscles. Figures 4(a) and (b) are
OCT images of Figs. 4(a) and (c) clearly shows perimysium that was confirmed by the histologic images (Figs. 4d, e). The perimysium is a connective tissue that wraps bundles of muscle fibers also known as fascicles. The atrophic muscle (Fig. 4c) showed significant reduction in the size of fascicles and, therefore, a fine grid of perimysium in comparison with the healthy one. The size of muscle fibers was also finer and the size variability of muscle fibers was higher for the atrophic TA muscle than for the healthy one, as was verified by the histologic images. Since OCT images of Figs. 4(a) and (c) were cross-sectional images of muscle fibers, muscle fibers were imaged as white spots. A high density of white spots in the grid of perimysium characterized the atrophic TA muscle. Another difference between the atrophic and the healthy TA muscles is the thickness of perimysium (Figs. 4a,c). The perimysium of atrophic muscle was thicker and this architectural difference was consistent with findings from the histologic staining with H&E, where numerous inflammatory cells were infiltrated in perimysial spaces as shown in Fig. 4(e).
The present study evaluated a multimodal platform of OCT and ultrasound to compare structures of healthy and atrophic TA muscles and demonstrated a complementary benefit of multimodal imaging in the most suitable rat model for sarcopenia. OCT, combined with pathology, showed an advantage in visualization of muscle microstructure over other imaging modalities such as ultrasound. Histology revealed that the atrophic TA muscle displayed an increased size variability of muscle fiber and inflammatory changes. OCT could image the changes of the perimysial grid and muscle fiber structure in real time without sacrifice.
Ultrasound has been widely used for diagnosis of mus-culoskeletal disease in clinical settings. However, there are few studies using ultrasound with a high resolution for muscular disease. In this study, ultrasound illustrated overall muscle size with distinct anatomical relationship between the healthy and atrophic TA muscles. Even with a high frequency transducer (40-8 MHz), ultrasound demonstrated a limitation in showing microstructures in muscle, especially in small animals such as rats. Therefore, the potential advantage of multimodal imaging in muscle degeneration using OCT and ultrasound may be of great importance. These are potential benefits in its application for diagnosing clinical muscular degeneration.
In clinical settings, there are various factors affecting sarcopenia such as senile change, neuronal degeneration, drug, malignancy, and sepsis. Therefore, the multimodal platform using OCT and ultrasound for evaluation of sarcopenia may be useful for many future applications.
Our results from this study employing OCT illustrated that this method could be a potential tool for monitoring the muscle atrophy induced by denervation. Morphological changes were visualized by OCT with supportive images taken from H&E staining and ultrasound analysis. Ultrasound provided a reduction of overall muscle size which OCT was not able to image due to a limited imaging depth. Structural changes observed by OCT may be attributed to the changes in the size, orientation, and regularity of microarchitecture within the muscle, including changes in perimysium and bundles of muscle fibers (fascicles). Our observation reinforces the potential for the use of OCT and ultrasound as a minimally-invasive diagnostic tool for sarcopenia