Laser-induced plasma/breakdown spectroscopy (LIPS or LIBS) technique is a very famous analytical technique, since it is able to determine several species simultaneously with minimal equipment. Compared to alternative analytical techniques, LIPS is fast, simple, requires no sample preparation, and is able to analyze solid, liquid, or gaseous samples [1-3]. Thus, LIPS has been used for various applications, such as characterization of geomaterial, observation of environmental change, analysis of biological material, and investigations of fossils and works of art [4-7]. Recently, LIPS has been used under atmospheric air pressure for line scanning, depth profiling, surface analysis, and mapping of sample composition with a single instrument [8]. These advantages make LIPS particularly useful technique for surface analysis and chemical mapping of bulk solid samples [8, 9]. Furthermore, LIPS depth profiles were verified in different matrices, such as thick Zn-coated steel, steels, brass, zinc, foils of iron, and semiconductors [8-13]. Because of the characteristic noninvasive nature of LIPS, samples of stainless steel located in a laboratory oven were monitored remotely at different temperatures via fiber optics. In this experiment, LIPS in-depth analyses of the elemental migration caused by the temperature were observed [12]. In recent experiments on an open-path system, LIPS performed measurements remotely, up to 10 meters away from the sample [13]. These experiments have considered the application of LIPS in the chemical mapping of different sample matrices over a range of depths to estimate the spatial distribution of their elemental compositions [14,15]. Nicolas et al. [16] have used LIPS to investigate three-dimensional multi-elemental maps of the chemical compositions of non-flat surfaces. In that study, information on the surface morphology of the area to be analyzed has been obtained and digitized with a simple experimental arrangement. The interaction between laser and sample depends on not only the sample's physical properties and its environmental characteristics, but also on parameters of the laser such as pulse duration, energy, wavelength, and repetition rate. The characterization of depth, volume, and topography of craters allows a better understanding of the ablation process [17].
In this work, the depth profiles for craters created on the surface of high-density polyethylene (HDPE) by intense laser beams were studied using LIPS. The effects of the number of pulses on the topographical features of the craters were investigated by LIPS and by scanning electron microscopy (SEM). Also, the relationship between the ablated mass and the number of laser pulses was found.
The samples examined in this survey are one type of plastic: HDPE, (C2H4)nH2. The plastic samples were sheets of thickness 3 mm, cut into 1 cm × 1 cm squares. These samples were supplied from a commercial company (Saudi Sabic Co., Saudi Arabia; part no. HDPEM300054).
The schematic diagram of the LIPS setup we used is similar to the standard LIPS shown before [18]. The LIPS experiment was carried out using a Spectrolaser 7000 (Laser Analysis Technologies, Australia), an integrated system consisting of a nanosecond excitation laser, focusing optics, a sample chamber with rotational and translational stages, an optical spectrograph, a gated CCD detector, and a camera to adjust the focusing position on the sample. The excitation laser is a high-power (5 -300 mJ, variable) Qswitched Nd:YAG laser, with a pulse duration of 7 ns at 1064 nm and working ata repetition rate of 10 Hz. In the present study, 100 mJ of laser energy was focused on a fresh region of the sample through a convex lens of 45 mm focal length for each successive pulse. A bundle of optical fiber (inner diameter 600 μm) was used to collect the emission of the plasma radiation and deliver it to a spectrometer with a resolution of 0.1 nm (FWHM). To reduce the noise, a data acquisition system collected an average of 10 recorded spectra to represent one LIPS spectrum, for the complete active range from 190-1100 nm.
3.1. Scanning Electron Microscopy (SEM)
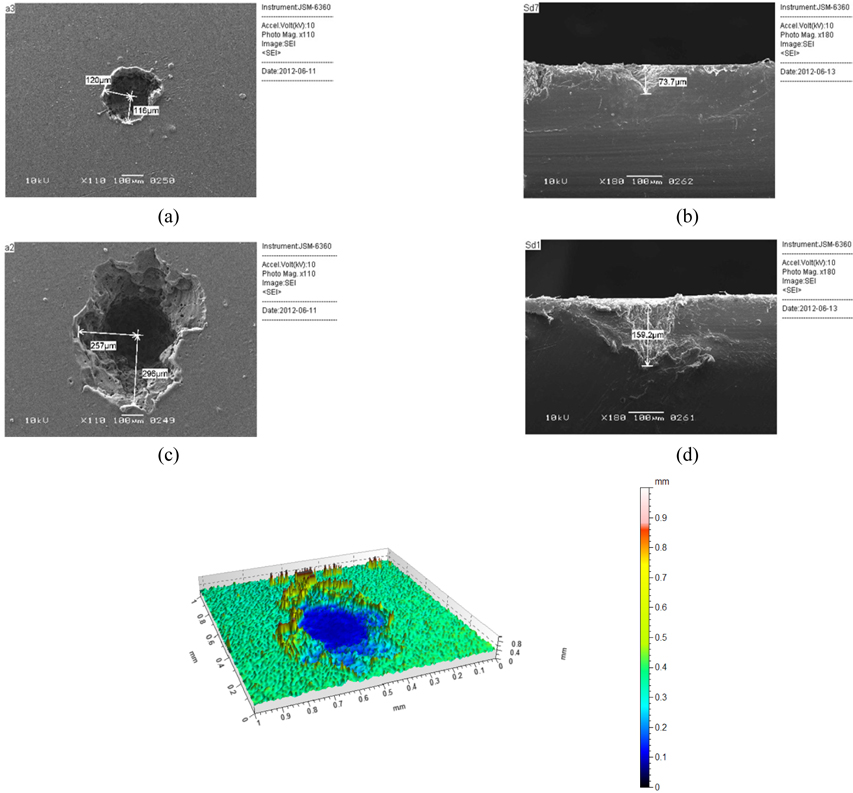
After the focused laser beam was fired, the plasma made craters on the sample surface. The form of such a crater depends on laser parameters such as fluence, wavelength, pulse duration, and pulse repetition rate. A scanning electron microscope (SEM) (JEOL Model JSM-6360) was used to monitor the morphology of the craters [20], and the MountainsMap software (Digital Surf Co., France) was utilized to calculate the depth, area, volume, and profile of each crater [6].
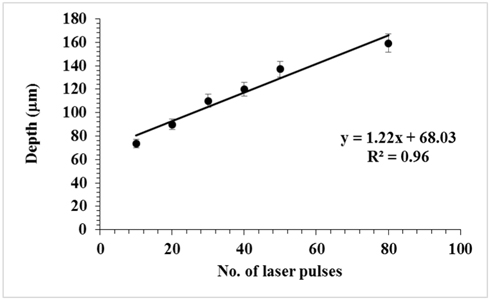
Figure 1 shows typical two-dimensional and three-dimensional images of craters formed on the surface of HDPE. Using a 45 mm lens, we got a spot size of 5.1 μm, which with 100 mJ pulses of 7 ns gives an intensity in the spot of ~7 × 10¹³ W/cm2. Both top-view and sideview images reveal that the width of 240 μm and depth of 73.7 μm of the crater after 10 laser pulses increased to 540 μm width and 159.2 μm depth after 80 laser pulses. Figure 2 shows the variation of the crater depth with the number of laser pulses; the depth increases with the number of pulses. The measurement uncertainties are represented in a range from ±1% up to ±10% estimated standard deviation STD of n=3 craters for each measurement.
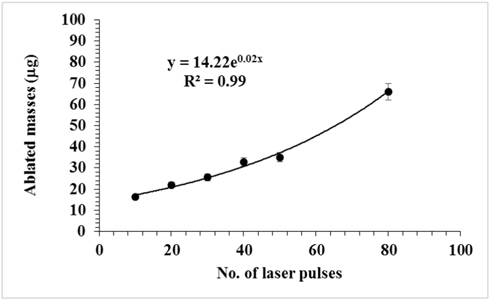
From the obtained results for depth profile (Fig. 2), using the measured widths of the obtained craters (Fig. 1), and taking the density of HDPE as 0.966 g/cm³, the ablated masses were calculated [7]. Figure 3 presents the variation of ablated mass with the number of laser pulses. The mass as a function of the number of the laser pulses can be fitted with an exponential curve as: where M is the ablated mass in μg and
3.2. LIPS Depth Spectra of Major and Trace Elements
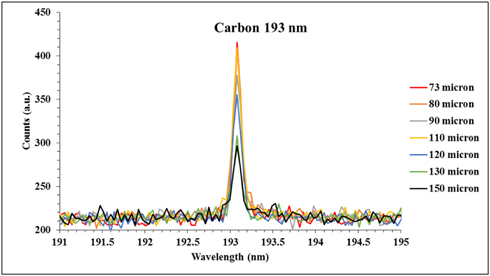
The depth profile of the HDPE could also be described using LIPS spectra for variation of elemental content with depth. The content of both major and minor elements in the commercial HDPE [(C2H4)nH2] sample could be examined. For a major element, we select carbon to be observed in the spectra at different depths. Figure 4 demonstrates the variation of the resolved carbon 193 nm line intensity with the depth in the HDPE using a fixed laser energy. The latter reveals that the carbon intensity decreased just 25% at the deepest layer of 150 μm. The small variation may be due to variation of the matrix in the deep layer of the sample. This small variation proves that the elemental content of the major elements like carbon is almost the same for different depths.
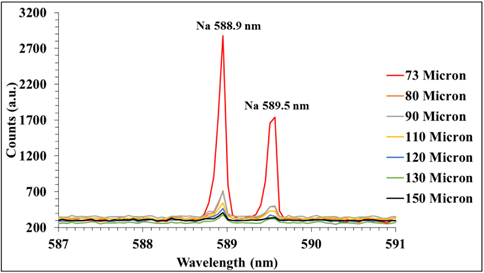
On the other hand, to represent the trace (minor) elements we select sodium to be observed in the spectra at different depths. Figure 5 demonstrates the variation of the intensities of resolved sodium 588.9 and 589.5 nm lines with the depth in the HDPE using the same laser energy. The latter reveals that the sodium intensities decreased sharply with depth, that is, it approximately vanished at depths greater than 120 μm. This result indicates that sodium exists only near the surface of the commercial HDPE polymer sample.
From those LIPS spectra it is seen that even though the carbon is the major element, the intensity of its 247 nm line is much lower than those of the minor-element sodium 588 and 589 nm lines, for many reasons. First, it is well known that neutral carbon usually is not easily detected because of its low transition probability (2.80 × 10⁷ s-1) compared to sodium (6.14 × 10⁷ s-1) [24]. Second, the upper level of the C I 247 transition needs an energy (40333.8 cm-1) much higher than the upper level of Na I lines (16973.3cm-1), so the carbon 247 nm transition is much less populated under the same conditions of electron density and temperature, compared to sodium. This can lead to another effect: The population of the sodium metastable excited states heats the electron energy distribution at the lever energy, overpopulating the distribution of free electrons, which are able to excite (or ionize) sodium again, enhancing its lines. This effect is stronger away from equilibrium, but can also be observed also under equilibrium conditions, because sodium is excited by electrons of lower energy and therefore its excited states are more populated. This last effect can be very important. The third reason is the sensitivity of our setup (spectrometer, detector, optics, mirror, etc.). The Spectrolaser 7000 LIBS system is more sensitive in detecting visible than ultraviolet radiation. Therefore, a reduction in the measured ultraviolet intensity is observed.
In the results for HDPE above, using the same laser energy with a varying number of pulses from 10 to 80, and using a 10 Hz repetition rate, the time interval between the laser pulses of 100 ms is long enough to allow for thermal effects in HDPE. Therefore, the ablation increases with the number of laser pulses. In the current study the infrared radiation of the nanosecond ND:YAG laser was used to carry out the experiments, so that only the photothermal ablation mechanism can be taken into consideration, since the experiments were carried out with the fundamental infrared wavelength. Pham et al. [8] stated that the photochemical process needs nanosecond ultraviolet laser pulses to promote breaking of chemical bonds. In polymers, the photothermal ablation mechanism comprises the absorption of photons, followed by ejection of these photons into the sample matrix. The latter process prompts a fast rise of bulk material temperature, which causes the thermal breakdown of the polymer sample. The polymer decomposition occurs if the vibrational energy reaches a specific fluence boundary, which leads to breaking of the chemical bonds in the polymer, promoting a well-known photo fragmentation phenomenon. The resulting fragments usually occupy a relatively significant space compared to the original material; such a volume expansion causes the ejection of ablated polymer material [8].
In future experiments, the depth profile for quantitative measurements will be reported using calibration curves. This will offer a three-dimensional quantitative mapping of elemental content of the polymer samples, which is essential in many industrial applications.
In this study, the depth profile was accurately studied for the commercially well known polymer HDPE using LIPS technique. The described method allows one to monitor and control the created craters in the micrometer range. In addition, the method offers depth profiling, and chemical mapping of elemental content using one online technique. Our results revealed that the constructed crater depth and the mass ablated from the surface of HDPE could be controlled using a definite number of laser pulses. The well resolved lines for elemental content in the HDPE samples demonstrated that the depth profile of elemental composition could be precisely described. The LIPS method allowed us, using one system, to verify under atmospheric air pressure the following features: controlled generation of well defined craters, depth profiling and mass analysis of the craters, and three-dimensional mapping of the elemental composition of the sample. The obtained results are very important for many industrial applications, such as thin-film lithography measurements and online measurements of thickness in film deposition techniques.