AlAsSb-based systems have been widely investigated for high-speed optoelectronic device applications such as ultrafast cross-phase modulators [1], quantum-cascade lasers [2], distributed Bragg reflectors [3], ultrafast all-optical switches using intersubband transitions [4], and photodetectors [5, 6]. The optical properties such as complex refractive index ñ = n + ik, dielectric function ε = ñ2 = ε1 + iε2, and interband transitions including the band gap of AlAsSb are needed for further device optimization [7], such as designs for distributed feedback grating waveguides [4] and simulations to predict the performance of solar cells [8, 9]. As a result, the dielectric functions and critical point (CP) energies of AlAsxSb1-x have been investigated using spectroscopic ellipsometry (SE) [10, 11], which is an excellent technique for determining ε data directly [12, 13]. However, no analytic representation of these ε spectra as a continuous function of As-composition x has been reported to date.
Here we analytically determine ε of AlAsxSb1-x as a continuous function of x for 0 ≤ x ≤ 1 in the energy range from 0.74 to 6 eV. The source data were obtained previously by rotating-compensator SE [11]. In short, pseudodielectric function < ε > spectra of AlAsxSb1-x alloy films (of well beyond the critical thickness to have bulk optical properties) with x = 0.119, 0.288, 0.681, and 0.829 were obtained on semi-insulating (001) GaAs substrates using molecular beam epitaxy (MBE). We performed in situ measurements directly on films grown by MBE, where the films were prepared and maintained in ultrahigh vacuum, preventing rapid oxidization of Al and ensuring oxide-free data. The endpoint data for AlAs and AlSb were taken from Refs. [14] and [15], respectively.
The CPs generate asymmetric features in ε [16]. Therefore, symmetric-lineshape models such as Lorentz, harmonic, or Gaussian oscillators provide poor representations of ε , requiring additional CP oscillators that have no physical basis. We circumvent this difficulty through the use of the dielectric function parametric model (DFPM) [17, 18], which can treat asymmetric characteristics appropriately while avoiding unnecessary additions. Here, we determine the parameters needed to represent ε analytically for the available spectra, then interpolate these parameters as a function of As composition x.
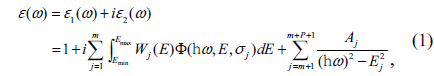
The DFPM has the advantage of properly representing ε data. In brief, in the DFPM the dielectric function is given as the sum of m energy-bounded polynomials that represent CP contributions within the accessible spectral range plus P poles that represent outside contributions [17, 18]. The general expression is
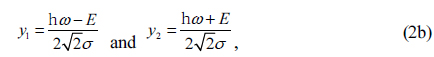
where
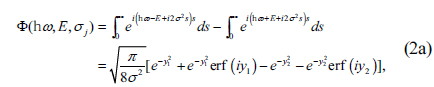
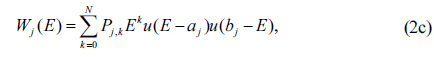
where u(x) is the unit step function. The use of pure Gaussian broadening in Eq. (2a) essentially prohibits closed-form integration of Eq. (1). However, the equivalent expression shown in Eq. (2b) shows that one-dimensional lookup tables as a function of ) can be constructed numerically for each order of polynomial required by Eq. (2c). The corresponding real part of ε is obtained by a Kramers-Kronig transformation. Detailed information, including a program to calculate the DFPM, is given in Refs. [17] and [18].
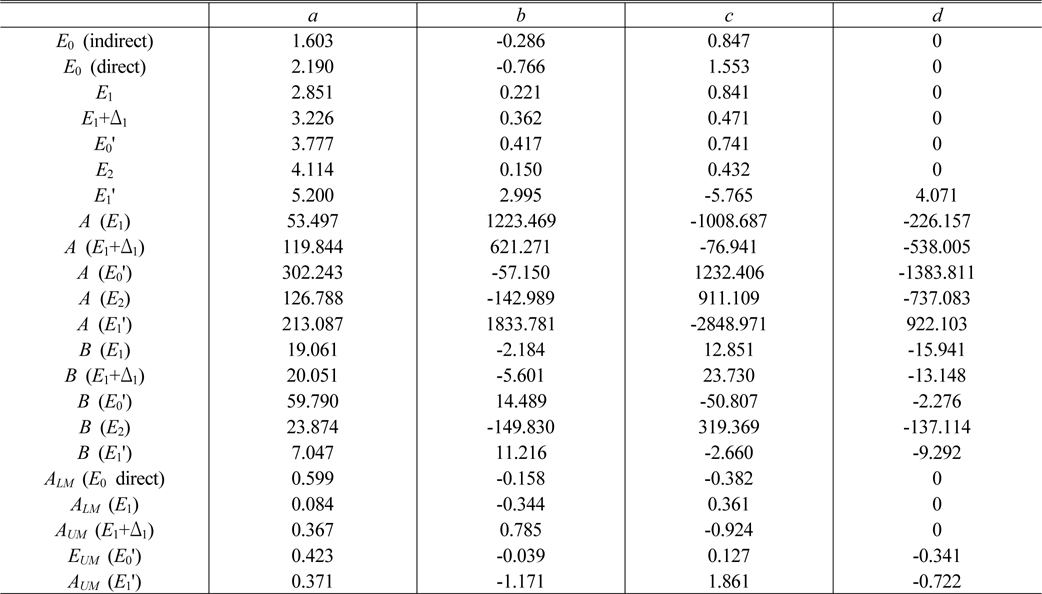
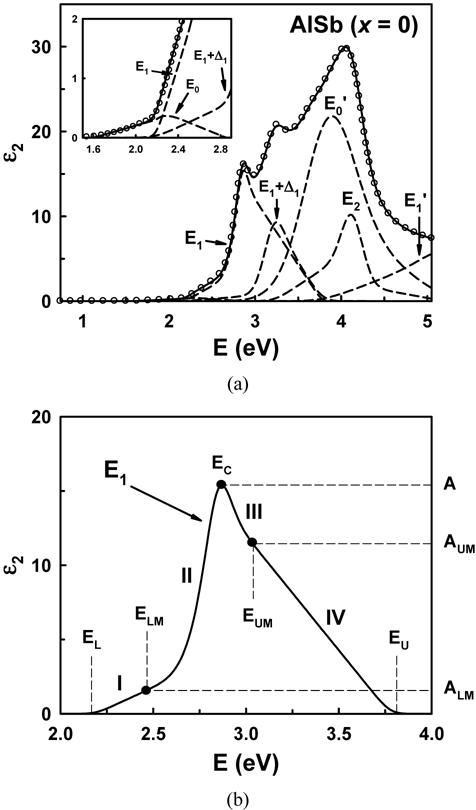
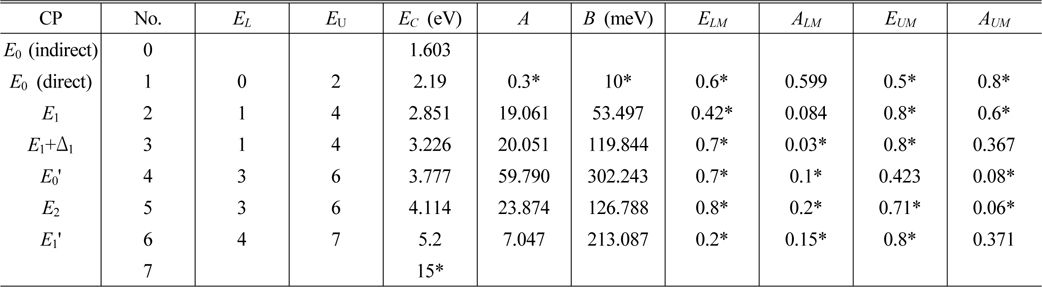
We parameterized the ε spectra of AlAsxSb1-x alloy using DFPM with x = 0 (AlSb), 0.119, 0.288, 0.681, 0.829, and 1 (AlAs). The source data for ternary alloys are obtained from our previous report [11], while data for AlAs and AlSb were taken from Refs. [14] and [15], respectively. As an example, Fig. 1(a) shows how the component CP structures combine to generate the ε2 spectrum of AlSb. The open dots are the data from Ref. [15] while the solid line is the fit of the DFPM to these data. The dashed lines show the contributions of the six individual CPs. To show the quality of the fits better, we reduced the number of data points appropriately. The parameters obtained from Fig. 1(a) are listed in Table 1. In the present work each CP is described by nine parameters, which are depicted in Fig. 1(b). This is the ε2 spectrum of the E1 CP component of AlSb. Using the conventional names of the DFPM, EC is the CP energy, while the values EL and EU indicate the CP structure numbers whose CP energies (EC) are the lower and upper bounding energies, respectively. ELM and EUM are control points for establishing the asymmetric characteristics of the lineshape. The values ELM and EUM are not absolute energies but rather relative positions between EL and EC and between EU and EC, respectively. ALM, A, and AUM are the respective amplitudes at ELM, EC, and EUM. Also, the values ALM and AUM are amplitudes relative to A. Parameter B, not shown in Fig. 1(b), is the full-width-half-maximum broadening parameter inherently embedded in harmonic-oscillator lineshapes. To construct the lineshape of a CP, second- and fourth-order polynomials were used for the energy regions (I, IV) and (II, III), respectively, with the constraint that the lines are connected smoothly and the values forced to zero at the boundaries EL and EU. Parameters that are held constant independent of composition are indicated by asterisks in Table 1. Here, No. 0 (E0 indirect) and No. 7 are not CPs but are the lower bounding energy of E0 (direct) and upper bounding energy of , respectively. The analysis was repeated for all AlAsSb spectra, and the fitting quality was similar to that seen for AlSb.
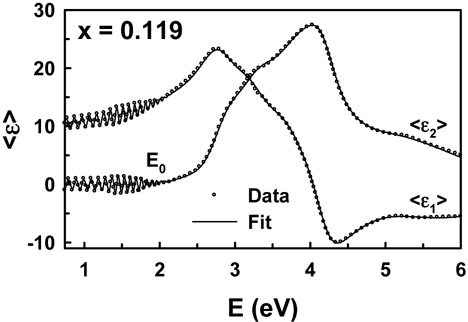
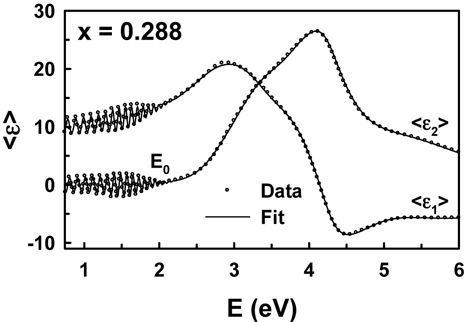
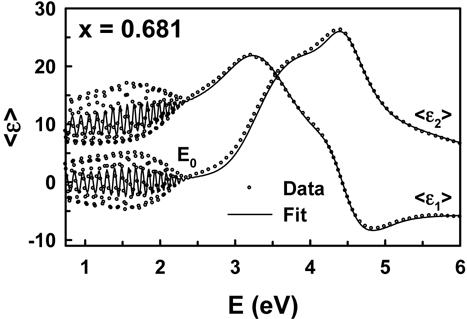
The reported <ε > spectra of ternary alloys have oscillations below the E0 feature, which are interference effects involving light back-reflected at the substrate-film interface, as a result of the films being transparent below their fundamental absorption edges. To extract ε in the oscillation region we performed the DFPM calculation using a multilayer model (ambient/AlAsSb alloy film/GaAs substrate). The fitting results for both real and imaginary parts of <ε > are shown in Figs. 2, 3, and 4 for x = 0.119, 0.288, and 0.681, respectively. The fits of the DFPM (solid lines) agree well with the data (dots) for x = 0.119 and 0.288, with thicknesses 1835 and 1837 nm respectively. To show the quality of the fits better, we reduced the number of data points appropriately. However, we note that the fit for x = 0.681 cannot follow the experimental data of the sharp interference oscillation patterns below 3.5 eV, as shown in Fig. 4. In our previous study of in situ monitoring of the growth of AlSb on GaAs by SE, we detected imperfect growth caused by glomerulate Al before perfect laminar growth of the film [19]. Accordingly, we assumed that our AlAsxSb1-x alloy film for x = 0.681 has an intermediate layer on GaAs substrate and a surfaceroughness layer on the top of the film caused by the remaining effect of roughness from the agglomeration of Al. Therefore, we used a five-phase multilayer model with ambient/surface roughness/AlAsSb alloy film/interface layer/ GaAs substrate. The dielectric functions of the surfaceroughness and interface layers were calculated using the effective-medium approximation [20] and Cauchy model, respectively. In principle, it is expected that the interface layer has absorption above its E0 CP. However, we claim that the transparent Cauchy model is sufficient, because the probe beam cannot reach the interface layer, interrupted by the absorption of the AlAsxSb1-x alloy film above the E0 CP.
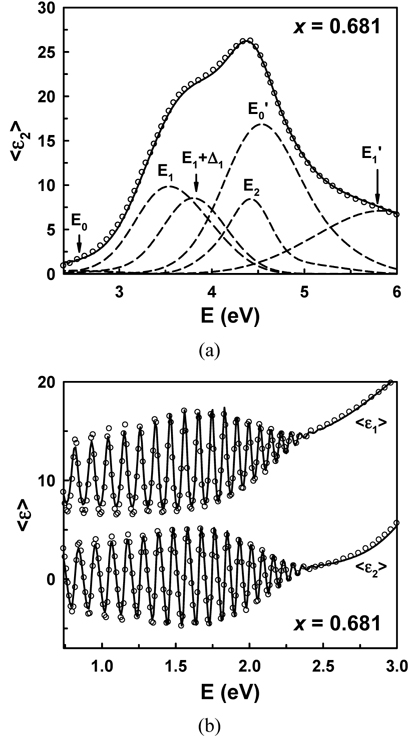
Figure 5 shows the DFPM spectrum (solid line) obtained as a best fit to the data (open dots) for x = 0.681 with excellent agreement, demonstrating the validity of our analysis. The dashed lines show the contributions of the six individual CPs in Fig. 5(a). To show the quality of the fits better, we reduced the number of data points appropriately here also. The obtained thicknesses of roughness, film, and interface layers are 0.71, 1687, and 28 nm respectively. The same analysis was repeated for x = 0.829 yielding similar fitting quality to that seen in Fig. 5. For x = 0.829 the thicknesses of roughness, film, and interface layers are 0.81, 1940, and 11 nm, respectively.
To construct numerical values of ε for arbitrary compositions, we interpolated the results for all data. We represent the x dependences by the cubic equation
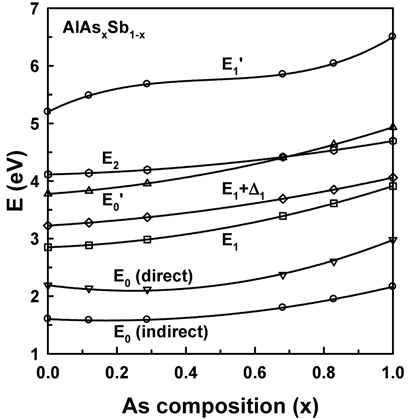
The best-fit parameters are given in Table 2. Figure 6 shows the As-composition dependences of EC as an example. The open dots are parameterized values for each temperature, and the solid lines are the best fits to Eq. (3). The crossing of the E2 and E0' CPs is also detected in our DFPM analysis, as in a previous band-calculation study [11].
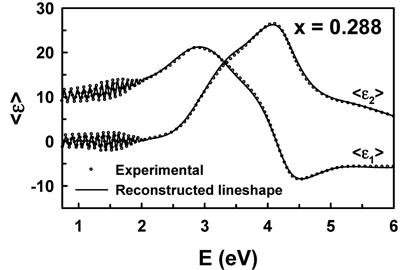
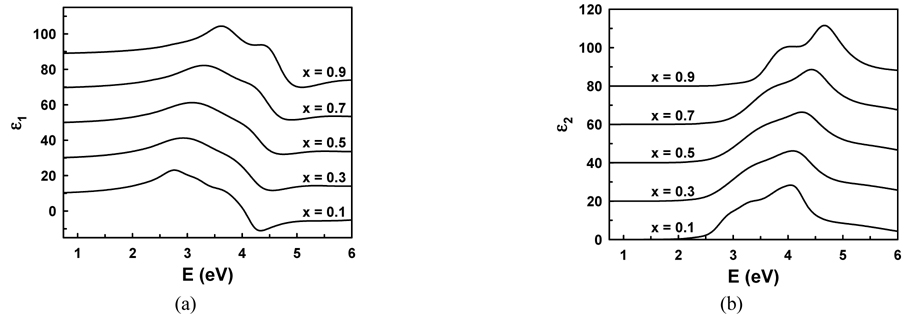
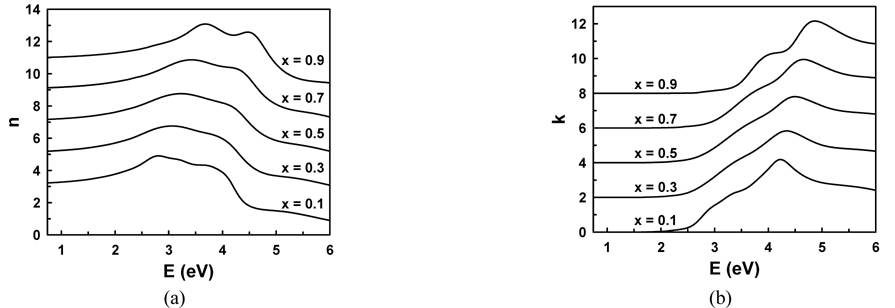
In Fig. 7 we compare the original data to the reconstruction for the representative composition x = 0.288. The dots and solid lines are measured and reconstructed spectra, respectively. The reconstructions are in excellent agreement with the data on this scale. Using these results we could calculate ε for any AlAsxSb1-x alloy, as shown in Fig. 8, where panels (a) and (b) show the real and imaginary parts respectively. The spectra are offset by increments of 20 relative to that for x = 0.1. For convenient application in device design, we also show the complex refractive index in Fig. 9. The spectra are offset by increments of 2 relative to that for x = 0.1.
We obtain excellent representations of the pseudodielectric functions of AlAsxSb1-x from 0.74 to 6.0 eV for arbitrary As composition x. Agreement is achieved with reasonable parameter values. The optical properties reported here will be useful in device design for high-speed optoelectronic applications and in situ monitoring of growth and deposition.


![Pseudodielectric function spectra (dots) for x = 0.119 taken from Ref. [11], together with the best fit (solid lines) using DFPM.](http://oak.go.kr/repository/journal/13383/E1OSAB_2014_v18n4_359_f002.jpg)
![Pseudodielectric function spectra (dots) for x = 0.288 taken from Ref. [11], together with the best fit (solid lines) using DFPM.](http://oak.go.kr/repository/journal/13383/E1OSAB_2014_v18n4_359_f003.jpg)
![Pseudodielectric function spectra (dots) for x = 0.681 taken from Ref. [11], together with the best fit (solid lines) using DFPM.](http://oak.go.kr/repository/journal/13383/E1OSAB_2014_v18n4_359_f004.jpg)