Solar blind UV detection is a useful technology in scientific and industrial fields, mainly working in the range from 240 nm to 280 nm, called the “solar blind band”, in which the ozone layer absorbs solar radiation. That is, the natural UV radiation in this band is hardly detected below the ozone layer. Thus, an emitter in this region can be detected when it emits solar blind UV radiation, due to the complete absence of that radiation from the background (called the “blank background”) [1-4]. UV detection has been widely applied, such as for identifying coronas surrounding high-voltage wires [5], the observation, identification, and tracking of space targets [6], fire alarms, and so on [7-11].
The solar blind UV filter is a major component of a UV detection system, as it guarantees the purity of the detecting environment [12-17]. It prevents the UV detector from being interfered with by other spectral bands radiation, thus improving the signal to noise ratio of the detection system, as well as reducing the false alarm rate. The out-of-band cutoff depth is a major specification of a solar blind UV filter that represents the inhibitory ability of the filter to incident radiation in the near ultraviolet, visible, and near infrared ranges. To optimally match the spectra with the detector and enhance the performance of the UV detection system, it is crucial to measure accurately the cutoff depth of a UV filter.
Currently the main means to measure filter cutoff depth include UV spectrophotometers [18-20], DF-type reflectometers [21], and acousto-optic modulation detection systems [22]. Among these, the UV spectrophotometer and DF-type reflectometer can measure the cutoff depth accurately for OD values of less than 6, where OD = -log (transmittance). In 2009 Liu. et al. (Ref. 22) extended the dynamic range to 0-6 OD by proposing an acousto-optic modulator detection system, which consists of an acousto-optic modulator, transmittance attenuators [23, 24], an integrating sphere, and some other components. However, it is extremely difficult to measure solar blind UV filters when some have a deeper out-of-band cutoff, which is even up to an OD of 10 in some spectral bands.
In this paper we propose an advanced system for measuring out-of-band cutoff depth of filters, named Cutoff Depth Adjustable Measurement System (CDAM). CDAM mainly consists of narrow-band LED [25,26] light sources, reflective neutral attenuators with known attenuation coefficients (given by the manufacturer), and a photomultiplier (PMT). The basic principle is based on the substitution method, using the attenuation coefficients of the standard reflective neutral attenuators (SRNAs) as references. Experimental data are presented to show the out-of-band cutoff depth of solar blind UV filters that can be obtained through comparative calculation. Additionally, we analyze the system’s uncertainty to demonstrate its accuracy. The CDAM, which is flexible and cost-effective with high precision and wide dynamic range, could be widely used in the measurement of filter cutoff depth in a large spectral band.
In this paper, our aim is to design a new system to enhance the precision and dynamic range of filter cutoff depth measurement, as compared to what has already been achieved in Refs. 18-22. The motivations for presenting the new system are based on the following considerations:
Previous experiments used a monochromatic light source, which is generated by white light passing through a monochromator, but the light will become too weak to detect a deep cutoff depth like that of a solar blind UV filter, which can be up to 10 OD units. Also, many systems adopt attenuators, but those attenuators are transmitted, with attenuation coefficients that are not known accurately due to the aberration caused by inner-material inhomogeneity. This leads us to two questions: Are there more powerful light sources, and how may we acquire exact attenuation coefficients for measuring a deep cutoff accurately?
The first problem can be solved by using a narrow-band LED source, which is sufficiently strong and possesses narrow half-bandwidth, and thus no band confusion. Take a solar blind UV filter for instance; the output power of the LED source is of the order of a milliwatt after passing the filter, and the receiving power is decreased to 10-13 W, which is still within the linear response range of a PMT.
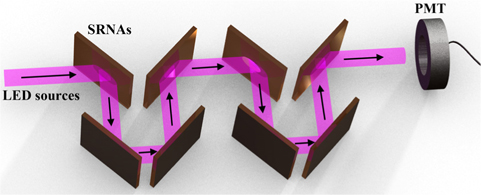
Additionally, since the measured solar blind UV filters are out-of-band deep cutoff, the linear response range of a PMT is not large enough to detect the original photocurrent and attenuated photocurrent simultaneously. That is, we cannot calculate the cutoff depth of filters by comparing these two photocurrents directly. Furthermore, there will be a larger response error from the PMT even if the original and attenuated photocurrents are both in the linear response range of the PMT, because of the drastic change in light power. Hence, we employ SRNAs in the system to generate a reference photocurrent. Compared to transmitted attenuators, the attenuation coefficient of an SRNA, as shown in Fig. 1, can be obtained more accurately because it is aberration-free. At the same time, we propose an SRNA combining method, with which the system can automatically increase or decrease the number of SRNAs in pairs according to the magnitude of photocurrent passing through filters, as shown in Fig. 2. Therefore, we guarantee that both photocurrents, one passing through filters and the other passing through SRNAs, are of approximately the same order, leading to more accurate and reliable results.
Thus a new system integrating narrow-band LED sources and SRNAs is designed according to the discussions above.
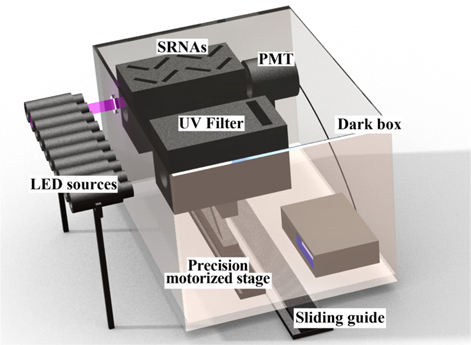
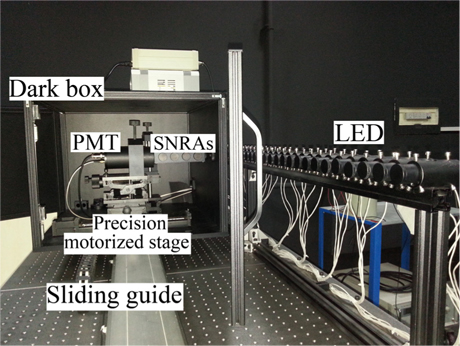
Figures 3 and 4 depict the schematic and actual setup of the CDAM respectively. The whole measurement system is placed on a vibration-isolation platform. LED sources are aligned with the light inlet on the dark box and generate the collimated radiation. The LED sources with power level of a milliwatt and half-bandwidth of 5 nm are lined up sequentially according to the spectrum. To control the power of incident light, an adjustable aperture is set between the LED light sources and the dark box. The box is placed on a sliding guide so that the light inlet can be aligned with the LED sources of different bands. Containers of filters and SRNAs as well as the PMT are placed in the dark box, which is also used for stray-light shielding. Those two containers are fixed on a high-precision motorized stage for changing position. The SRNAs are arranged in a V-shape structure, as shown in Fig. 2. The number of SRNAs can be increased or decreased in pairs to guarantee precision and accuracy in measurement. The probe of the PMT, light inlet, and LED sources are coaxial. The sensitivity of the PMT is on the order of 10-16 W.
The measurement principle was mainly based on the substitution method, using attenuation coefficients of SRNAs as the reference. The out-of-band cutoff depth of solar blind UV filters can be acquired through comparative calculation.
The cutoff depth of a filter is:
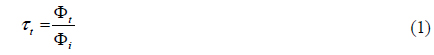
where Φt and Φi denote the radiation fluxes of the light source with and without filters respectively. The attenuation coefficients of SRNAs are given by:
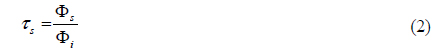
where Φs and Φi are the radiation fluxes of the light source with and without SRNAs respectively. In our system, the known SRNA attenuation coefficients can be combined in pairs. That is, the total attenuation coefficient can be represented as an exponential equation:
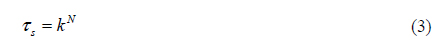
where k is the attenuation coefficient per SRNA at the peak wavelength λ, and N is the number of SRNAs used in the system. Therefore, in the case of the known attenuation coefficients, Eq. (1) can be written as:
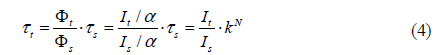
where It represents the detected photocurrent with the filter set in the CDAM, Is denotes the detected photocurrent with the SRNA set in the CDAM and α is the spectral sensitivity of the PMT.
The CDAM determines the out-of-band cutoff depth of solar blind filter, which can also be extended to measurements of other deep cutoff filters. However, since we choose a narrow-band LED as a substitute for conventional monochromatic light, it is necessary to evaluate the impact of using non-monochromatic light on the results.
We currently lack reference data for the out-of-band cutoff depth of solar blind UV filters for comparison due to the well-known measurement difficulty. Therefore, a simulation is performed by treating in-band transmittance (200-400 nm) as a comparison.
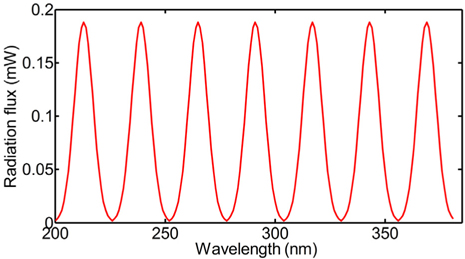
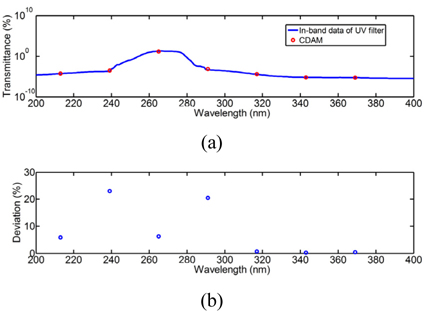
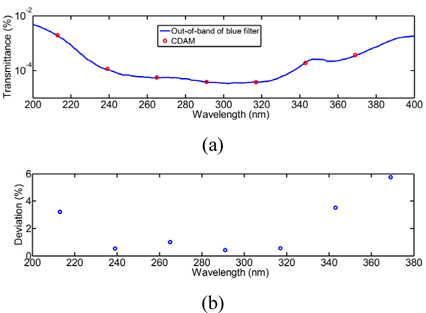
The following details pertain primarily to the measurement process of the CDAM as simulated in MATLAB Ver. 2010b. The power of the narrow-band LED sources in the CDAM is set to be 2 mW, which satisfies the Gaussian distribution of 10 nm band width. As shown in Figs. 5, 7 narrowband LED sources cover the entire in-band spectrum in sequence. Compared to conventional monochromatic light, the radiation power of LED sources is no longer a certain value but spans a wavelength band in a practical test. According to the analysis above, we use the in-band transmittance(200-400 nm)data for solar blind UV filters as a reference and calculate the deviation of the proposed method. Figures 6(a) and (b) show the calculated result and deviation. As presented in Fig. 6(b), the calculated deviation varies proportionally to the slope of the transmittance curve. The deviation usually is below 6% if the slope of the corresponding data point is small, but increases to 20% in the region with rapidly changing slope. Because the out-of-band cutoff depth of filters that the CDAM mainly measures stays low, there is no drastic slope change in that band, and the deviation is predictably small. To test the hypothesis, another set of data for a blue filter is chosen as the simulation object, in which the UV band is taken out of its pass-band. The deviation between the measurements achieved by CDAM and the given data is shown in Fig. 7(b), which proves that for out-of-band with a relatively flat slope, the deviation of out-of-band cutoff depth measured with our method is below 6%.
3.2. Experimental Measurements
Based on the analysis above, system operation was performed in the following steps: First, we collimated the LED source with a micro-lens, adjusted the photosensitive surface of the PMT to receive all the emitted light from the LED, and assembled the diaphragm on the inlet of the dark box to avoid stray light. Second, we preheated the LED to enable it to work in a stable state, and drove the high-precision motorized stage set in the dark box to make the filter face the LED. Then we measured photocurrent It. Again using the precision motorized stage, we had SRNAs take the place of the filter, and by changing the number of SRNAs we matched It and Is to a close order of magnitude. Then we recorded the photocurrent Is. Finally, we closed the diaphragm to shield the PMT from illumination, and regarded the temporal output signal as dark current noise Idark. Thus, the net output current signal can be obtained as I-Idark (I could be It or Is). Along the same lines, we manipulated the dark box to travel on the sliding guide and made every LED source aim at the light inlet on the dark box. We repeated the steps above until all LED sources had been tested. By substituting the measurements into Eq. (4), the cutoff depth of the filter could be found finally.
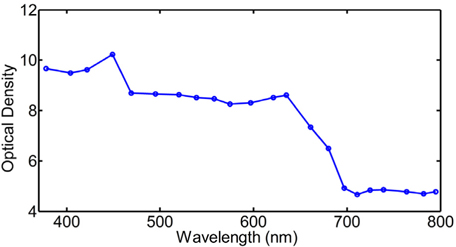
In this paper, we have realized the measurement of deep out-of-band cutoff filters for the first time. The test object was a UV solar blind filter in the UV Lens from AF Micro-Nikkor, bought abroad. Test results are shown in Fig. 8. It is observed that the cutoff depth of the test filter is deeper in the visible band, with deepest point at 420 nm, and declines in the near-infrared band. The out-of-band cutoff depth range of the test filter is between 4 and 10 OD units.
The current resolution of the PMT in the CDAM is 0.01 pA. When testing, the minimum output current detected by PMT is at the pA order of magnitude, which is much larger than the current resolution of the PMT. Hence the test results are of high precision and reliability.
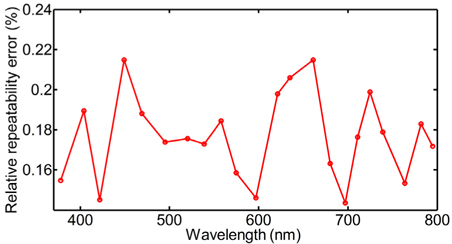
To evaluate the consistency of the CDAM, we performed a repeatability test that measured the filter 20 times. Standard deviations are shown in Fig. 9, which indicates that the relative repeatability error of the CDAM is less than 0.25% for any wavelength.
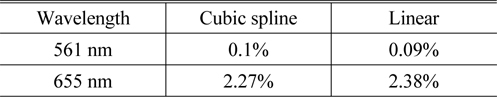
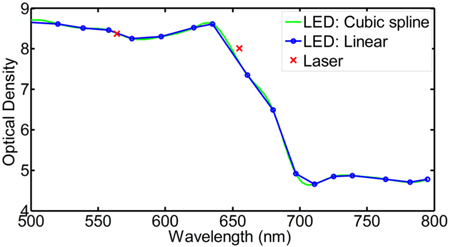
Furthermore, to validate the measurement results shown in Fig. 8, we use two laser diodes with wavelengths of 655 nm and 561 nm as reference light sources. The procedure is to change the light source of the CDAM from LED to laser diode, use the same methods to obtain the out-of-band cutoff depth of the filter at those two wavelengths, and compare the results achieved using LEDs and laser diodes. Because of the difference in center wavelengths of the laser diodes and the original LED sources, accurately point by point comparison is difficult to realize. However, it is shown in Fig. 10 that the two data sets are similar. To get estimates at wavelengths of 655 nm and 561 nm in Fig. 8, the data are interpolated using linear and cubic splines respectively. The relative deviation between original data (LED) and reference data (laser) is shown in Table 1.
[TABLE 1.] Relative deviation between original and reference data

Relative deviation between original and reference data
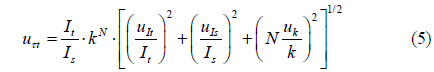
From the descriptions mentioned above in Sec. 2.3, it is clear that the CDAM should theoretically be expected to be free of error for ideally perfect components It, Is and k. However, this ideal situation cannot be achieved in practice, mainly because systematic errors are introduced by the imperfections in devices. To quantify these errors we introduce uncertainty propagation to represent the uncertainty of the measurement of the cutoff depth of filters τt:

where uτt, uIt, uIs and uk are the uncertainty of τt , It, Is and k.
4.1. The Influence of the Detected Photocurrent Transmitting Filters It
uτt can be represented as:

where uα is the response error, uE is the LED sources instability error and uL represents the location error of the precision motorized stage. Those three variables are mutually independent, so Eq. (6) can be written as:

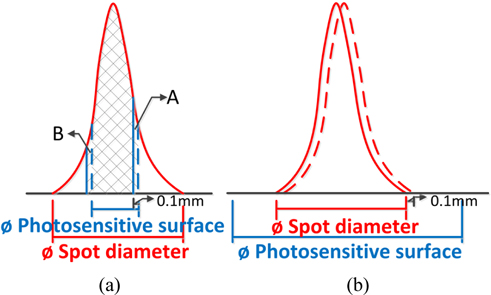
The system uses the visible and near-infrared photomultiplier R2228, with a large photosensitive surface of ∅25 mm, from Hamamatsu Photonics. The spot diameter of the LED sources is about ∅10 mm, which is much smaller than that of photosensitive surface. The location error of the high-precision motorized stage is ±0.1 mm, so it has a negligible impact on the photocurrent It. To clarify that point further through a diagram, Fig. 11(a) shows one situation when the diameter of the photosensitive surface is close to or even less than that of the light spot; the location deviating 0.1 mm would cause radiation flux sum B instead of the A portion marked in the figure to trigger the photosensitive surface. The difference between the radiation flux sums A and B would be the measurement error caused by location deviation. Fig. 11(b) shows another situation, being our approach, in which we adopt a photosensitive surface of ∅25 mm in the CDAM, which is much larger than the spot diameter. Thus the PMT can receive all of the illumination, even though there is a 0.1 mm location error, the impact of which on the measurement can be ignored. Consequently the spectral sensitivity of the PMT has an uncertainty uα of 0.9% and the LED sources have an instability error uE of 0.1%, which cause a relative change in output current of uIt ≤ 0.91%.
4.2. Influence of the Detected Photocurrent Transmitting SRNAs Is
As the testing environments of It and Is are completely identical, the expression for uIs is the same as uIt, that is, uIs ≤ 0.91%.
4.3. Influence of the Attenuation Coefficients k
The CDAM uses standard reflective neutral attenuators, whose uncertainty in attenuation coefficients (supplied by manufacturer) is 0.1%, which means uk ≤ 0.1%.
In summary, the uncertainty in the cutoff depth of filters τt measured by the CDAM is calculated to be less than 1.5%.
In this paper, we have proposed a cutoff depth adjustable measurement system (CDAM), which is capable of measuring deep cutoff filters, enlarging the dynamic range to 10 OD units. The major elements of the CDAM have been introduced. The principle of our system is based on the substitution method. Specifically, we take as the reference the photocurrent of the LED sources, attenuated through SRNAs and detected by the PMT, which substitutes for the LED initial photocurrent. Therefore the out-of-band cutoff depth of a filter can be acquired using comparative calculation. Furthermore, we have presented an attenuator combination method ensuring that the PMT can keep working within its linear response range. Results of numerical simulations and repeatability tests have shown that the proposed CDAM system is of high precision and reliability. Experiment shows that the system effectively extends the dynamic measurement range from 0-6 OD to 0-10 OD units, which could be widely useful in the measurement of filter cutoff depth.