Proteomics aims at comprehensive profiling of protein in tissues or cells utilizing various technical platforms such as proteome separation techniques, mass spectrometry (MS), and bioinformatics tools for data processing. In mass spectrometry based proteomics studies, bioinformatics tools are essentially required to interpret more than thousands of spectra from liquid chromatography-mass spectrometry runs. The above process faces two typical (1) error of monoisotopic mass determination and (2) loss of information due to single database search.1 Assignments of precise precursor ion masses to MS/MS spectra is frequently debatable even when using high resolution mass spectrometers. The resultant non statistical distributions with potentially missing peaks can lead to errors in monoisotopic mass determination.2 In order to solve the problem,
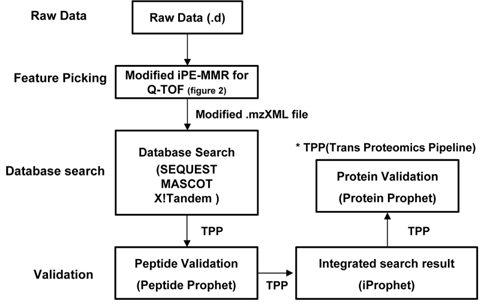
The present study utilizes iProphet to combine the indication from multiple identifications of the same peptide sequences across different spectra, experiments, precursor ion charge states, and modified states. iProphet is a part of open-source suite of proteomic data analysis tools Trans Proteomic Pipeline (TPP).9 Figure 1 illustrates the general MS/MS proteomics dataset workflow through the combined pipeline. The main features of the present combined pipeline include three distinct categories: (1) Feature picking, (2) Database search and (3) Validation. The raw data files from Q-TOF (quadrupole time of flight) were subjected to an integrated data analysis pipeline using modified iPE-MMR and the subsequent mzXML files were searched with three database search and results were validated using peptide prophet, iProphet and Protein prophet using TPP.11 The present pipeline process data twice for identification of proteins. Initially the MS/MS raw data will be analyzed by database search engines. And then the un-identified result data will be adjusted to correct precursor peak mass by PE-MMR. After the PE-MMR result and identified result information will be combined and the modified data will be processed by DtaRefinery for more accurate precursor ion mass. There are several search software with different search algorithm and calculation of validation score lead to differences finding results. iProphet was found to solve this issue. Obviously the more spectra from each search tool that are to be analyzed together the better the statistics are going to be by InterProphet. Therefore, more identified proteins can be gained every though searching based on a same filter. This study shows that the novel pipeline is optimized for identification of proteome by tandem mass spectra data.
In this study, the integrated data processing pipeline was applied by mouse epididymal adipose tissue (EAT) and mouse colitis colon tissue. Obesity-induced chronic epididymal adipose tissue inflammation is considered as a crucial contributor to the above complications.12 Ulcerative colitis (UC) was caused by chronic inflammation through diet condition.13 Both of two metabolic diseases were developed by chronic inflammation in adipose tissue and colon tissue has not been integrated into molecular understanding. We therefore established an experimental animal model for colitic colon tissue and high fat feeding adipose tissue, and used proteomic analysis, based on LC-MS analysis and integrated data processing pipeline, to identify proteins involved in these sample.
>
Protein sample preparation and mass spectrometry
All animal sample procedures were performed according to the protocols approved by the institutional ethical committee at Interdesciplinary Graduate Program in Genetic Engineering (IGPGE) of Seoul National University. Eight weeks old C57B6L/J wild type mice were used for the study. The animals were fed with high fat diet for 16 weeks. At the end of the experimental period the animals were euthanized and the whole intact epididymal adipose tissue (EAT) excluding testis were collected, and snap frozen quickly in liquid nitrogen, and then stored at - 80℃. Mouse tissues of repeated dextran sulfate sodium (DSS)-induced colitis-associated cancer were used for the application of the method.
The snap frozen tissue was pulverized and dissolved in 6 M urea to denature the protein. The mixture was then sonicated and the protein content was determined by BCA assay. A known quantity of the denatured protein (100 μg) was reduced with TCEP (tris(2-carboxyethyl)phosphine) and incubated in 900 rpm, 37 for 30 min. Each sample was adjusted pH 8 to 9 by 1M Tris. The samples were cysteineblocked with 15 mM iodacetamide (IAA) at room temperature (RT) for 1 hour, 300 rpm in the dark. The urea concentration of the solution was made to below 2M with 10 mM Tris. The proteins were then digested by Sequencing grade modified trypsin (Promega) in Trypsin resuspension buffer (Promega) for 16 hours at 37℃, 300 rpm. The digested peptides were desalted using C18 spin column (Havard Apparatus) to remove interfering substances and the samples were dried using Speedvac (SCANVAC, Bio-Rad).
3. Liquid Chromatography Mass spectrometry analysis
The dried peptide pellet was re-suspended in 100 μL of 0.1% formic acid for mass spectrometric analysis using 6520 Accurate-Mass Q-TOF LC/MS coupled to Liquid chromatogram (Agilent Technologies, DE) with a HPLC-chip cube source. The peptides separations were performed with an 1200 series High pressure liquid chromatography(HPLC) system (Agilent Technologies, DE, JP) using HPLC-chip (large capacity chip, 150mm, 300 Å, C18 chip, w/160 nL trap column) (Agilent Technologies, DE) with a nanoflow pump. The peptides were primarily loaded and transferred to the HPLC-chip of trapping column at a flow rate 0.3 μL/min for a minute. Mobile phase A was HPLC grade water with 0.1% formic acid and B was 90% ACN, 0.1% formic acid in HPLC grade water. The sample were separated with gradient from 10% B to 45% B in 15 minutes, then to 90% B for 5 minutes, and finished in 10% B, at a flow rate of 0.3 μL/min. A blank run was carried out in between samples with similar conditions. Data were acquired in the mass range from 100m/z to 3000m/z with positive ion polarity, 3.7 V collision energy. Acquisition rate was set per a second of three spectra. Data acquisition of reference mass (121.050873m/z, 922.009798m/z) corrected to ensure high mass accuracy.
Tandem Mass Spectrometry Data Analysis
1. Generation of lists of all monoisotopic masses observed in a whole LC/MS experiment.
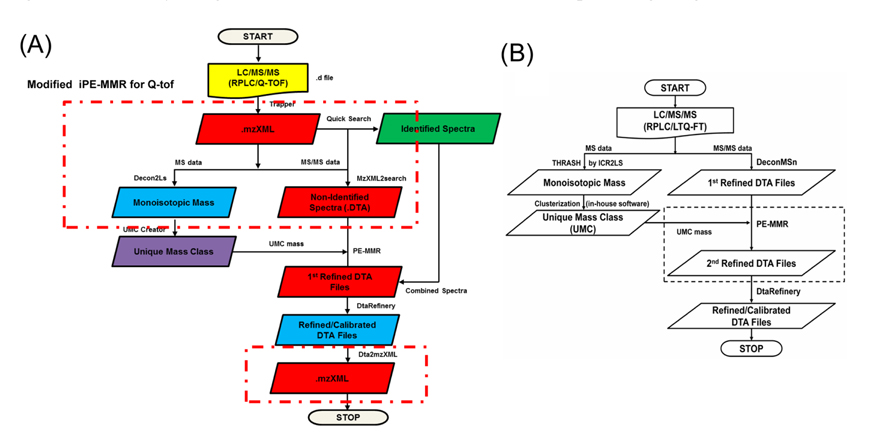
The MS data set arising from the LC-MS/MS experiments were directly submitted as a batch to Decon2Ls and the isotopic distributions and charge states of the peptide ions in the mass spectra were deconvoluted by using the THRASH algorithm developed by Horn et al.14 By using iPE-MMR, mass spectral peaks were grouped according to similar monoisotopic mass (within a mass tolerance of 10 ppm), different LC elution times into a unique mass class (UMC). All of the UMCs observed in an LC-MS/MS experiment were recorded in an XMLformatted file (denoted herein a “UMC list”). We used a simple approach to generate UMCs by using mass tolerance and the requirement of detection in sequential mass spectra. Figure 2A and B shows modified iPE-MMR method that modified from the conventional method to combined method of data conversion that optimized to Q-TOF data analysis.
The grouped peak list from MS/MS exported to mzXML format by Trapper [Agilent MassHunter format (.d directories) to mzXML converter]. Generated peak lists (.mzXML) was searched by SEQUEST(SorcererTM) against International Protein Index (IPI) Mouse database(v3.73) from the European Bioinformatics Institute using the following constraints: semi tryptic peptides with up to two missed cleavage sites were allowed; 20 ppm mass tolerances for MS and 50 ppm mass tolerances for MS/MS fragment ions. Database search parameters were set for carbamidomethyl (+57.021465 Da) of cysteine residues as a fixed modification. Carbamylation (+43.005814 Da) of N-terminal and oxidation (+15.994920 Da) of methionine were specified as variable modifications. Search results were evaluated with the Trans proteomic pipeline (TPP) using Peptide Prophet (v4.4.1). And then exceptions of identified spectra were used for processing next PE-MMR step.
MS/MS raw data were extracted using MzXML2Search(TPP v4.4 VUVUZELA rev 1, Build 201009011732 (MinGW)) of TPP software, which determines values of the monoisotopic m/z and charge states of the precursor ions along with the values of m/z and the intensities of the fragment ions. In this step, charge states from 1 to 8 were considered, and the precursor peptide mass range was set to 400-10,000 Da.
4. Filtration, correction, and refined of tandem mass spectra
In order to obtain more missed peptide feature, among unidentified spectra, garbage MS/MS data files were filtered out by UMC mass value. The PE-MMR compares to the neutral mass (
All raw MS data were converted to the mzXML and mgf file format,15 and searched with X!Tandem version 8.4.4 (LabKey Sever), SorcererTM SEQUEST® v3.5 (Sage-N Research, Inc. Milpitas, CA), and Mascot version 2.3.0 (Matrix Science) the three most commonly used database search tools. Search parameters have set precursor ion and fragment ion tolerances were set to 20 ppm and 50 ppm each other. And fixed modification of cysteine carbamidomethylation, variable modifications of methionine oxidation and n-terminus carbamylation were set as modifications and allowing partially tryptic peptides. The tandem LC-MS data were processed and searched against mouse IPI version 3.73 protein database http://www.ebi.ac.uk/IPI/IPImouse.html and combined, validated by using Trans Proteomic Pipeline (TPP) version 4.4 VUVUSELA rev 1.
The Trans Proteomic Pipeline, which makes use of open XML file formats for storage of raw data at the peptide and protein levels. All search results were processed with PeptideProphet, iProphet and ProteinProphet, in an order. Each of database search results were processed individually by PeptideProphet. Several PeptideProphet results were combined in ProteinProphet with or without using iProphet as an intermediate step. A cutoff probability score of 0.95 was used for this study. It revealed a false positive rate of less than 1% based on a PeptideProphet probability score cutoff at 0.90. And then ProteinProphet, within the TPP, infers the simplest list of proteins consistent with the identified peptides.
Unique identified proteins were visualized and mapped into biological networks using the Ingenuity pathway analysis (IPA) tool of complex ‘omics data version 14855783 (Ingenuity Systems, Inc., Redwood City, CA, USA). IPA is based on a proprietary, manually curated database of mouse protein-protein, protein-DNA, and protein-compound interactions. The differentially expressed proteins were uploaded as IPI ID Number into the IPA platform for analysis.
>
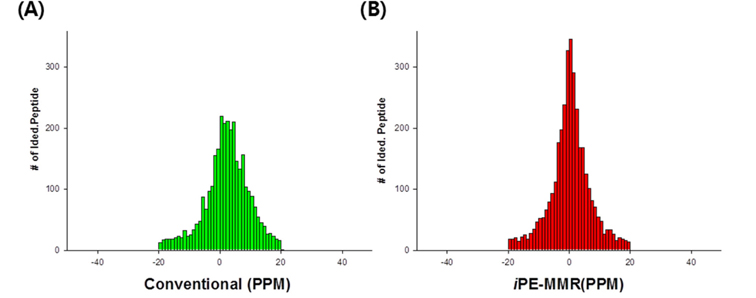
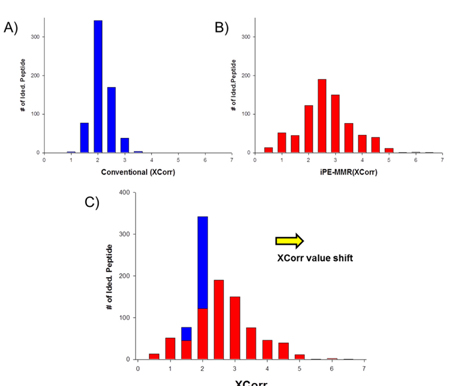
Increased accuracy and sensitivity of modified iPEMMR method for peptide identification in Q-TOF
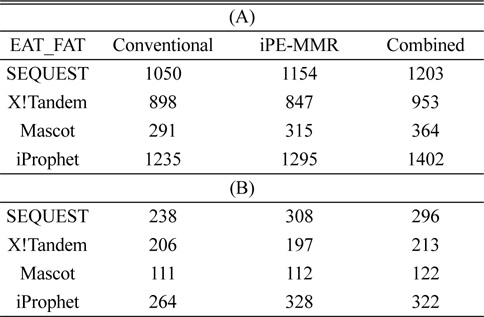
All spectra were searched against IPI using three different search engines - SEQUEST, X!Tandem and MASCOT. We compared efficiency of the peptide identification in three feature picking method such as conventional,
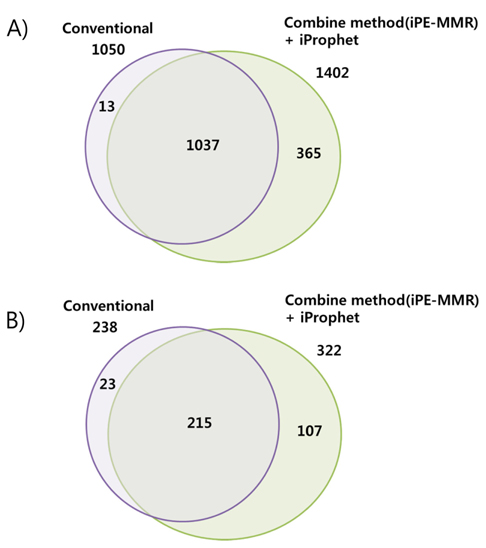
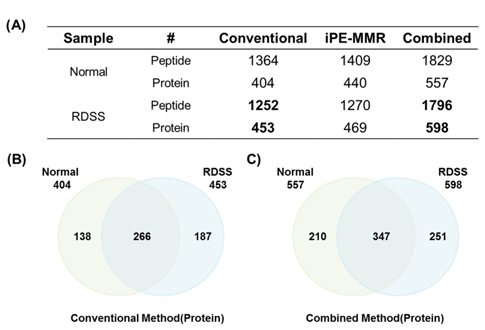
[Table 1.] Number of identified peptide (A) and protein (B).

Number of identified peptide (A) and protein (B).
>
Increased sensitivity and Identification number of Peptides and Proteins by iProphet.
In order to combine identified peptides, the result was analyzed by three kinds of search engines (SEQUEST, X!Tandem and Mascot). Then PeptideProphet validates individual MS/MS spectra matches to peptide, and assign the probability of correctness for the MS/MS spectra. The functionality of ‘iProphet’ is combining of multiple PeptideProphet results. Number of identified proteins were compared from searched results by iProphet and conventional method for the sample of EAT tissue sample. All identified peptide and protein lists obtained by the SEQUEST, X!Tandem, MASCOT and iProphet. iProphet resulted in 18% increase in peptide identifications compared to the only SEQUEST. And the combined
>
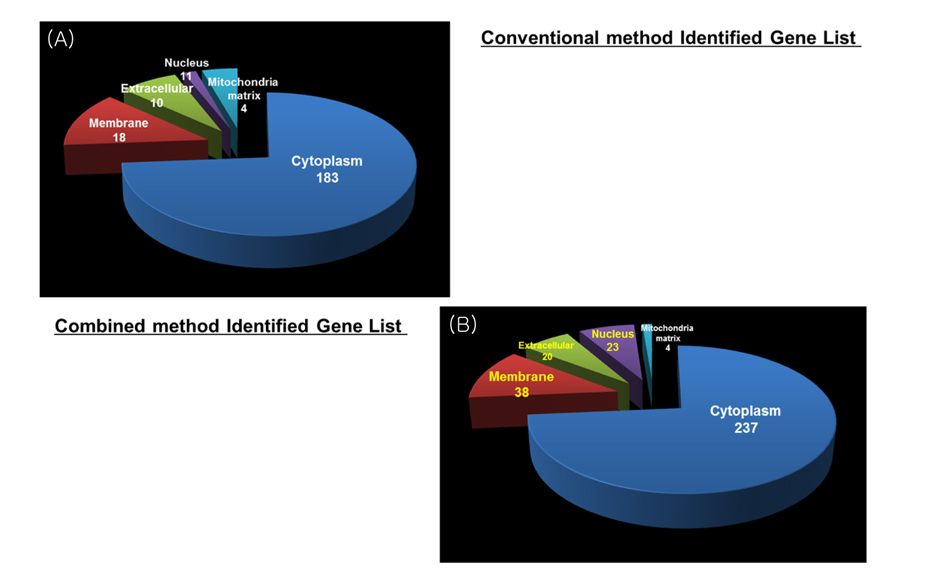
Increase identified efficiency of low abundance protein in cell through advanced pipeline
Overall number of identified result of combined method was increased more than conventional method result in gene level. Figure 6 shows distribution of identified proteins of cellular localization. The majority of proteins were placed in cytoplasm. A few proteins were spread throughout the other parts (
>
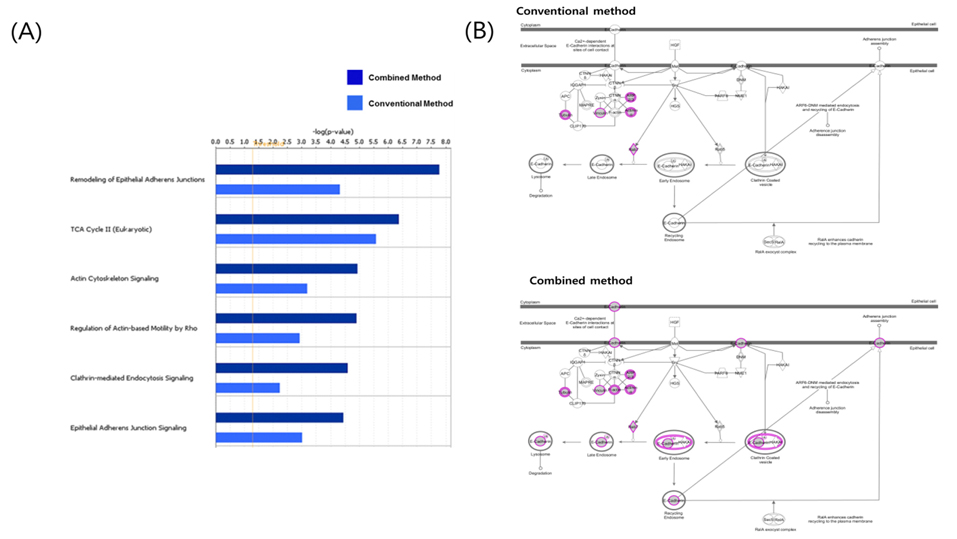
More effectual data mining through protein network analysis
In the study, protein profiling was processed by two kinds of data analysis method from mouse adipose tissue. Conventional method and combined method results compared gene information of identified protein list and defines common and unique subsets followed by functional ontology enrichment, calculation of p-value and network analysis (Figure 7). As shown Figure 7A, it arranges canonical pathway list in order of high ranking of p-value. Top-ranking pathway is remodeling of epithelial adherens junctions in the list. E-cadherin is a calciumdependent transmembrane protein involved in homotypic cellcell interactions.15 E-cadherin at the surface of islet beta-cells is controlled by secretagogues including glucose, correlates with insulin secretion, and can serve as a surface marker of beta-cell function.16 As shown in Figure 7B, marked shaded proteins were identified in data from mouse adipose tissue. This result demonstrates convincingly that combined method is more efficient for finding biomarker candidates than result of single search engine. Only combined method result data appeared known biomarker candidates such as E-cadherin. Two kinds of analysis results were shown similar pattern in signaling pathway analysis. However identified proteins of combined method were demonstrated higher p-value than conventional analysis method. The main reason is that analyzed proteins were more accurate to interesting biomarker candidates in combined method. As efficiency of combined analysis method evidence, E-cadherin is potential clinical diagnostic biomarker of diabetic nephropathy and may participate in the pathogenesis of diabetes.17
>
Application of colon tissue of RDSS induced ulcerative colitis sample
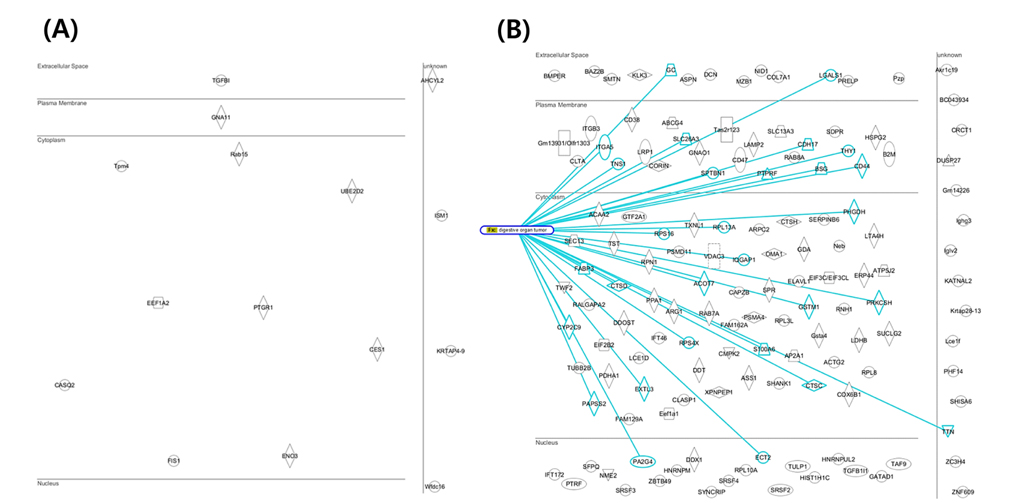
Mouse colon tissue was analyzed by conventional method and combined method. Two groups of sample are control and treated RDSS for induced ulcerative colitis. Increased number of peptides and proteins were identified in control and treated samples in combined method compared to the conventional method (Figure 8). Figure 8A shows that identified proteins were distributed between conventional method and combined method. Figure 8B and Figure 8C show that combined method was able to obtain missed proteins in conventional method. These identified proteins built related with inflammatory bowel disease of protein network for mining biological meaning. Figure 9 shows unique identified protein network of related with digestive organ tumor were compared between conventional method and combined method. Figure 9A and Figure 9B shows that the results of combined method showed significant involvement digestive disease. The result shows that the combined method is more efficient for discovering biomarker.
This novel integrated data processing pipeline can assist in improved discovery of potential biomarker candidates. In proteomic analysis based on mass spectrometry, we still missed many low abundance proteins. Most of biomarker candidates are low abundance and hence present low intensity peaks in MS analysis. Hence, the pipeline was demonstrated in disease pathway analysis by enriching the pathways more specifically. Because this pipeline could be identified not only more protein numbers but also more accurate result.