A large variety of underwater robots have been developed by many research institutes over the last two decades. Some of the more successful of these robots are now being employed for scientific, commercial and military purposes. Research into developing more efficient underwater robots is being conducted with a view to improving mission duration (Yuh, 2000).
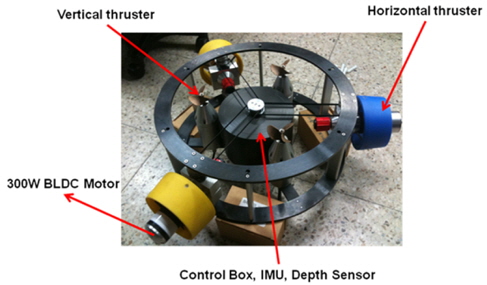
A new type of the underwater robot called an UDR has been developed and its design evaluated by CFD analysis such as a resistance test, propulsion test (bollard pull test) and Planar Motion Mechanism (PMM) test simulation. The body of the UDR is designed as a disk shaped vehicle in order to minimize the effect of external disturbances such as currents and waves. The UDR is composed of hull and frame structure, three vertical thrusters, three horizontal thrusters, a control system and sensors. The thrusters are mounted axi-symmetrically at an angle of 120 degrees to enable the UDR to navigate along any direction by vector summation with the propulsion controller.
Resistance (drag) testing, Propeller Open Water (POW) testing and PMM testing are essential steps that are required to predict the drag force, propulsion power and motion performance of an underwater vehicle. Conventionally, the tests for the prediction of drag, propulsion performance and motion of an underwater vehicle are carried out in a large model basin equipped with a towing carriage, and dynamometer, making the test process expensive. The development of commercial codes for CFD analysis now make it possible to predict drag and propulsion performance of a ship or submersible vehicle such as an underwater robot without using a physical model test basin (Joung et al., 2012).
There are many efforts at predicting drag forces of underwater vehicles by CFD analysis and validating CFD simulation methods in design processes (Yu and Su, 2010; Bellingham et al., 2010). CFD simulations are also compared with in-service data for the self-propelled performance of an Autonomous Underwater Vehicle (AUV) (Phillips et al., 2008). However, carrying out experimental tests for ducted propellers of underwater vehicles, or predicting performance of an UDR, is rarely reported.
In the work reported in this article, CFD analysis was first used to conduct the resistance test necessary to predict the total drag force for selecting an appropriate thruster that will achieve the required speed of the UDR. Pure heaving motion and pure pitching motion studies were then carried out to emulate the VPMM test by CFD motion analysis. The hydrodynamic forces on the UDR body and the distributions of the hydrodynamic values (velocity, pressure etc.) around the UDR body were obtained while the UDR was performing these motions.
Finally, the custom designed ducted propulsion system that is employed in the UDR was also analysed using CFD tools. The results of the CFD analysis for the ducted thruster were compared for validation purposes with the experimental test results that were obtained using a specially designed thrust measurement system. In order to further verify the validity of the CFD modeling process, a CFD model of a commercial thruster was developed and analysed and the estimated thrust performance characteristics compared against the corresponding physical test data as supplied by the thruster manufacturer.
DRAG ESTIMATION OF THE UNDERWATER DISK ROBOT
>
Concept design (initial design)
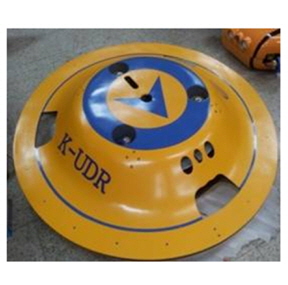
The UDR, shown in Fig. 1, was designed as a streamlined disk shape to reduce the drag force on the body in the horizontal direction. The bare hull of the UDR measures 1.9
The design speed (NCR; Normal Continuous Rating) for the initial design of the UDR is 3.5
>
CFD Setup for Predicting the UDR drag force
The fluid flow around the UDR has been modeled using the commercial CFD analysis code ANSYS-CFX 14.0. For these calculations, the fluid’s motion is modeled using the incompressible, isothermal Reynolds-averaged-Navier-Stokes (RANS) equations in order to determine the Cartesian flow field and pressure of the water around the UDR body. The equations consist of a general solution of the ensemble-averaged, steady-state, three dimensional Navier–Stokes equations, where the
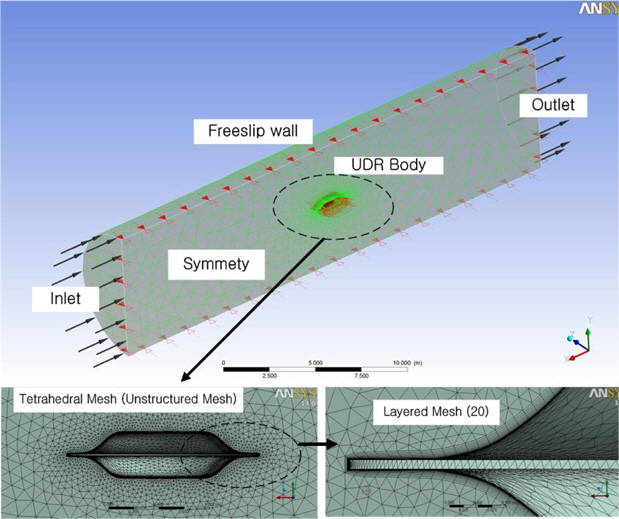
The shape of the domain is cylindrical as shown in Fig. 3 (top). The length of the domain is 8 times longer than the UDR body (8
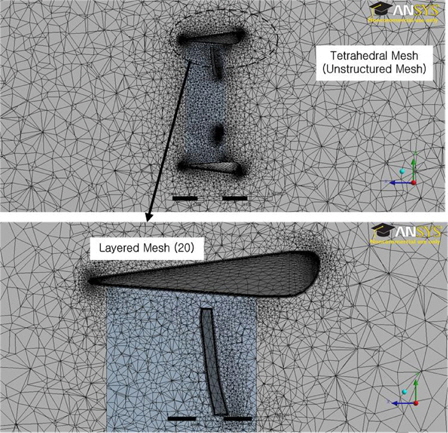
The meshing operation was performed using ANSYS Workbench-CFX-Mesh as shown in Fig. 3 (bottom). Layered (20 layers) meshes were used for generating the boundary layer elements around the UDR body while unstructured (Tetrahedral) meshes were employed for the region far from the body as they are not suitable to resolve the boundary layers adjacent to a solid body (Nishi, 2007).
The height of cells adjacent to the walls was set to less than 20.0
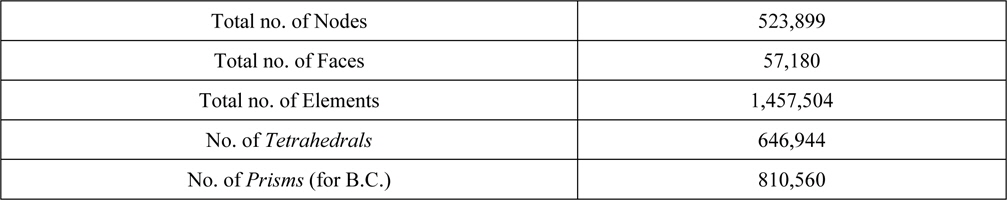
[Table 1] Principal conditions employed in the CFD analysis.
Principal conditions employed in the CFD analysis.
A mesh convergence study was performed at the design speed (3.5
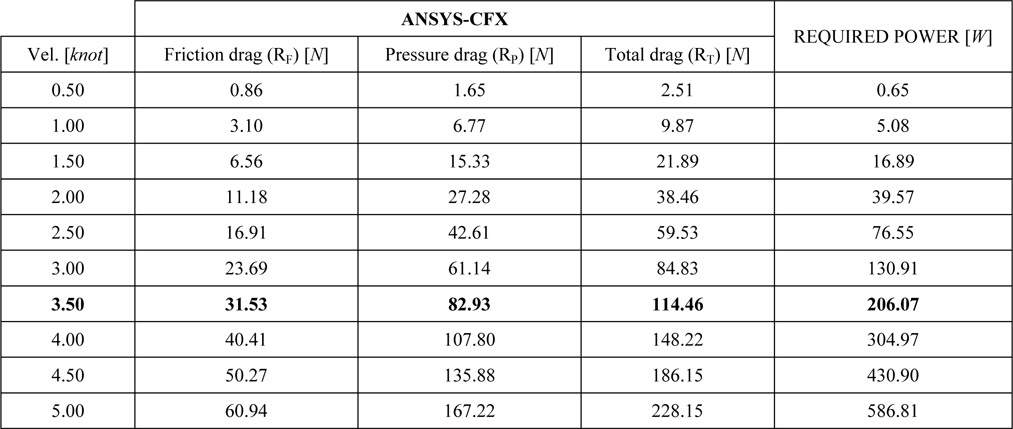
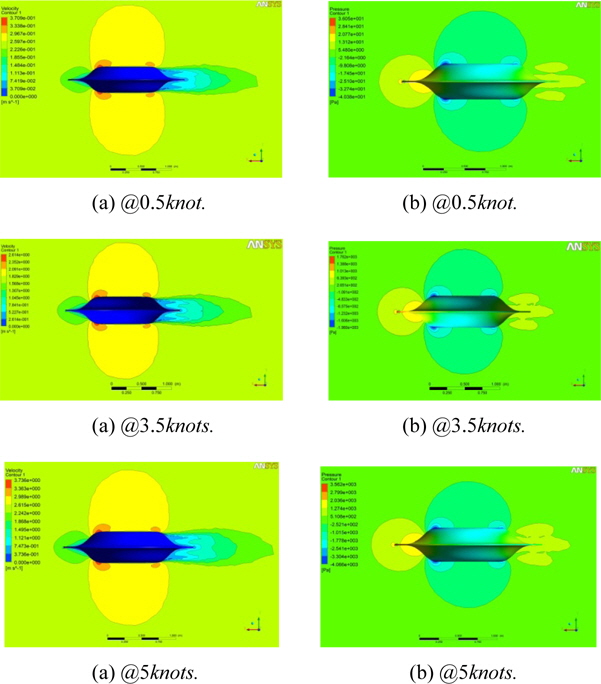
The total drag force (
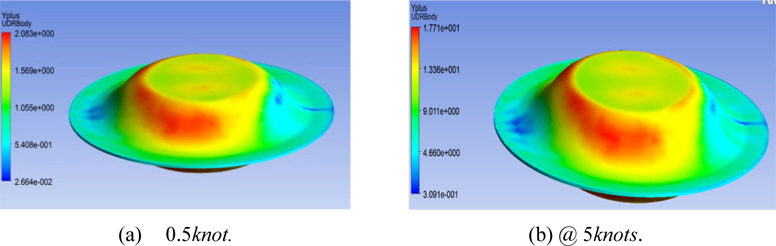
The pressure (form) drag force is obtained by calculating the integral of the pressure on the surface of the vehicle. It was found that the pressure drag force was relatively larger than the friction drag force as the speed of the UDR grows due to the pressure difference between the front and back of the body caused by its shape as shown in Fig. 5. Fig. 5 shows velocity and pressure distribution at the lowest speed (0.5
[Table 2] Result of convergence study with UDR CFD model at the design speed (@ 3.5knots).
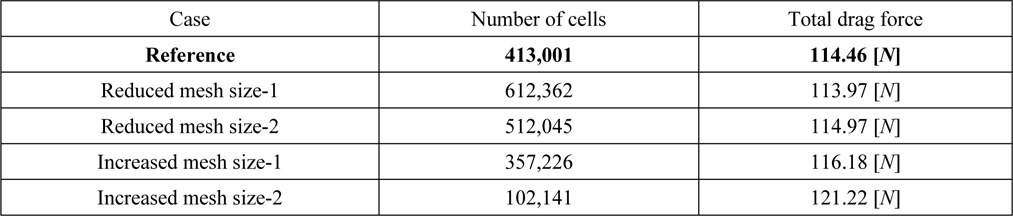
Result of convergence study with UDR CFD model at the design speed (@ 3.5knots).
[Table 3] Computed drag forces on the UDR.

Computed drag forces on the UDR.
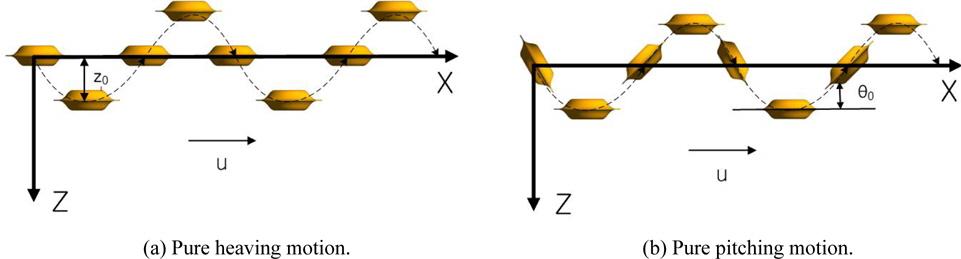
A VPMM test is carried out with the aim of measuring the hydrodynamic forces on the vehicle when changing the motion of the vehicle in the vertical direction. The hydrodynamic forces from the VPMM test are obtained for the pure heaving motion and the pure pitching motion of the vehicle. The hydrodynamic forces are then used to obtain the hydrodynamic coefficients of the UDR in order to build the vehicle’s control system.
For the case of pure heaving motion, the vehicle moves in a purely sinusoidal fashion with amplitude (z0), and zero pitch angle (θ0) as shown in Fig. 6(a). Pure pitching motion, on the other hand, is such that the vehicle moves in a sinusoidal fashion, but this time with a pitching angle (θ0) at the centre of gravity of the vehicle body and the longitudinal body axis is oriented tangential to the path, as shown in Fig. 6(b).
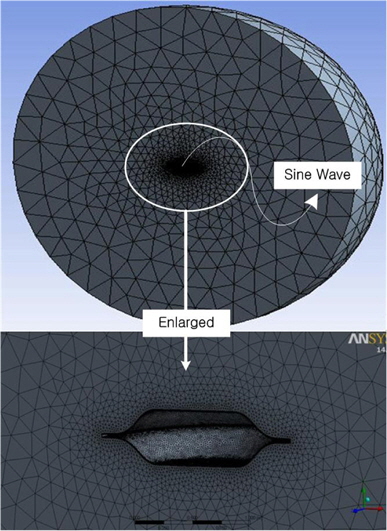
For the purposes of this motion analysis study, the position of the body should be defined and specified in accordance with the VPMM test requirements. The motion of the UDR body is defined as shown in Fig. 7 (top) by using the ANSYS-CFX Command Language (CCL) to simulate the pure heaving and pure pitching motions.
‘Tetrahedral’ and ‘Prism’ elements were employed for generating nodes and elements in the fluid domain. A hybrid mesh is created by merging the two mesh structures, and embodied for the CFD analysis by the “ANSYS-CFX-MESH” mesh generator as shown in Fig. 7 (bottom). The mesh properties for the UDR PMM motion study are shown in Table 4.
[Table 4] Density of the model employed for the PMM Test simulations.
Density of the model employed for the PMM Test simulations.
>
UDR Motion analysis results by CFD
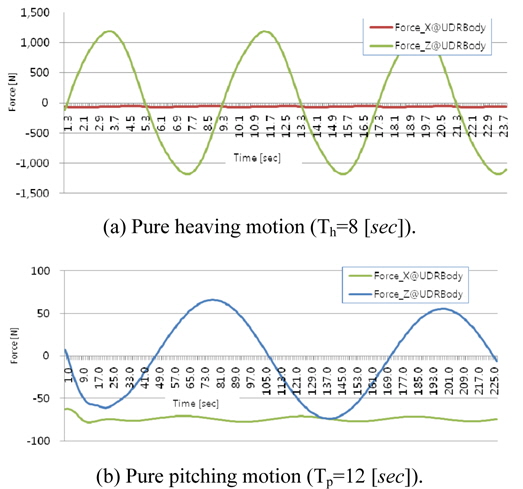
For the pure heaving motion test, the heave period (
In both tests, the x-directional velocity of the vehicle was set to 1
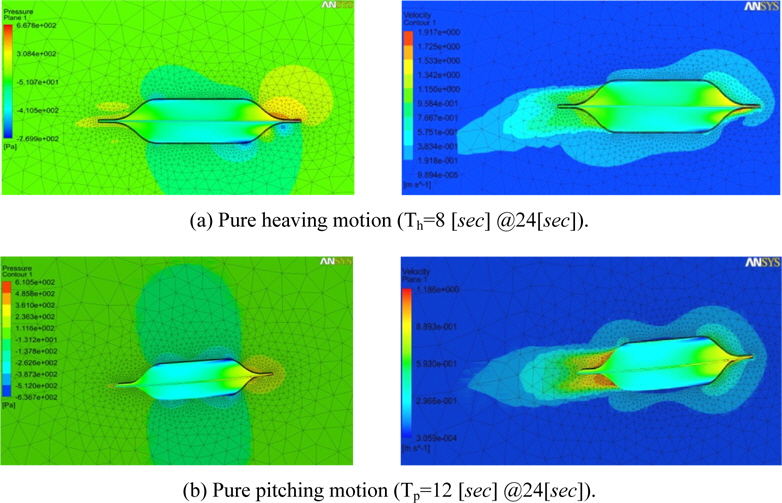
Fig. 8 shows the pressure and velocity distribution around the UDR after 24 seconds from the starting point. The pressure distribution around the UDR shows that the maximum pressure occurs in the bow (667.8 Pa-Pure heaving motion; 610.7 Pa-Pure pitching motion). The pressure difference between the fore and aft of the vehicle is higher when carrying out pure heaving motion.
Although the x-directional velocity (U0) of the vehicle is 1
The x- and z-axis directional forces of the pure heaving motion (a) and pure pitching motion (b) obtained from the CFD analysis are shown in Fig. 9. The added mass and inertia of the vehicle are derived from these hydrodynamic forces (Lee et al., 2011).
CHARACTERISING THE UDR THRUSTER’s THRUST POWER
The following section uses the custom-designed horizontal thrusters as a test scenario for confirming the validity of the CFD modeling approach. The discussion is limited in this paper to the horizontal thrusters. Similar modeling and analysis techniques can also be used to characterise the performance of the vertical thrusters.
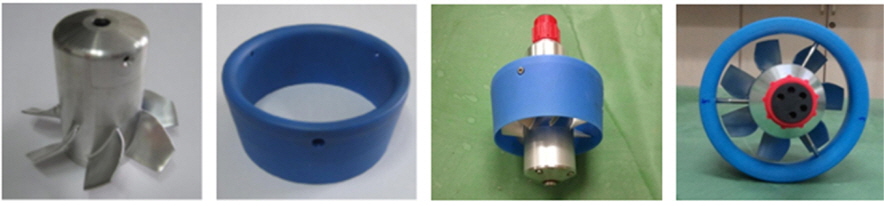
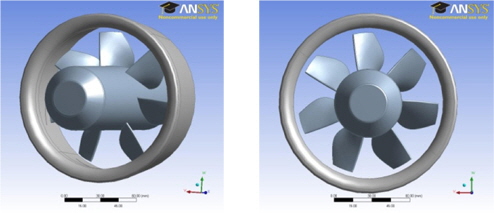
The ducted propeller design is shown in Fig. 10. The propeller has seven blades, and the pitch and diameter of the blades are 12.8
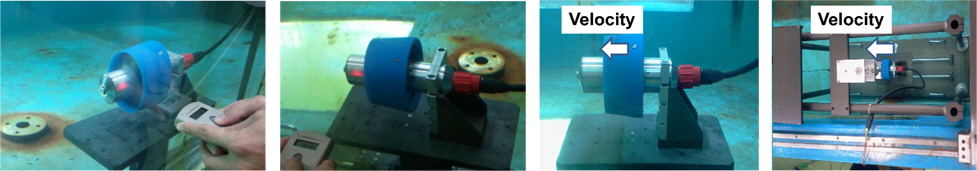
Bollard pull tests were carried out with nine copies of the designed 300
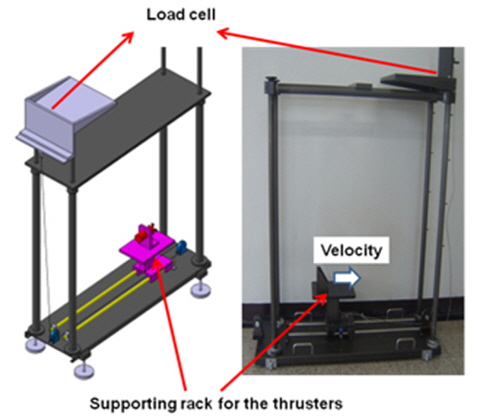
The conventional method for measuring thrust force is not directly suitable for determining the thrust force or torque produced by a single body thruster, such as the ones used in the UDR, where the nozzle, propeller and BLDC motor are all integrated together in one module. A purpose-built thrust power test system, as shown in Fig. 11, was therefore, designed and constructed for characterizing the performance of the ducted thruster. The bollard pull thrust power of each thruster was measured with the developed thrust power measurement system. Thrust forces produced by the blades rotating in the forward direction and in the reverse direction were obtained for a range of revolution speed (
>
CFD Analysis (geometry model, mesh generation and boundary condition)
The CAD model of the ducted propeller design is shown in Fig. 13. The meshing operation, which was performed using ANSYS Workbench-CFX-Mesh, generated a mesh with 5,281,598 elements and 1,441,134 nodes. A structured layer mesh (Prism elements, 20 layers) was employed as the boundary layer. The mesh model for the CFD analysis is illustrated in Fig. 14.
The Shear Stress Transport (SST) turbulence model was used for simulating turbulence, and the modified wall function was employed to reduce the number of the elements.
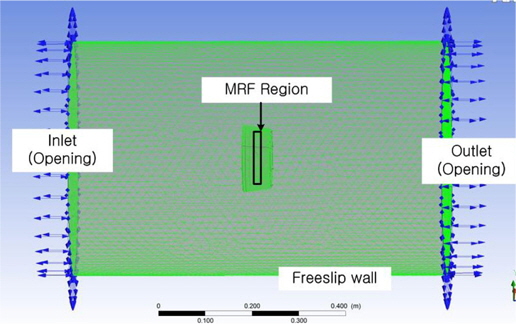
Employing suitable assumptions for the simulation could help save considerable computation time in the CFD analysis. The region in the UDR thruster can, for instance, be divided into a ‘rotational region’ and a ‘stationary region’. The Multiple Reference Frame (MRF) method can be used to conduct a simulation based on such assumptions (Wickstrom, 2007). The rotational region is defined around the blades while other regions are defined as stationary, as shown in Fig. 15. “The frozen rotor method” and the “General Grid Interface (GGI) method” were used for transferring information between the rotational region grid and the stationary region grids (ANSYS Inc., 2011).
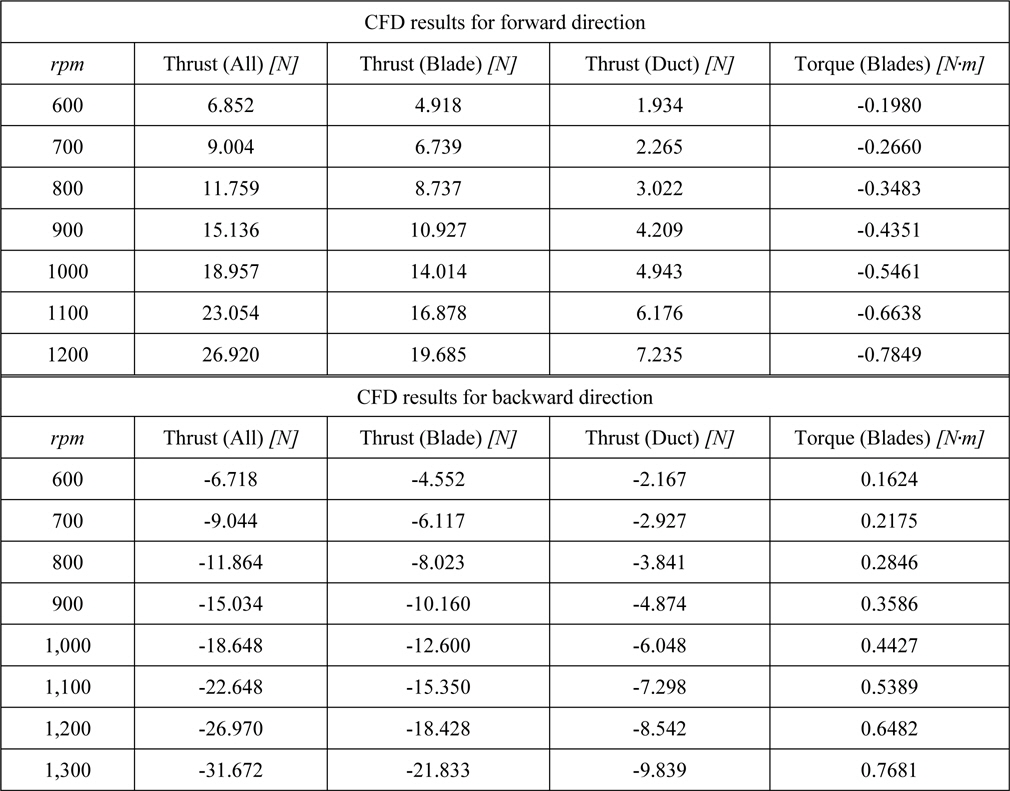
The thrust forces and torques of the ducted propellers were obtained from CFD analysis for the range 600
The thrust forces and torques produced by the blades inside of the duct and the thrust forces and torques produced by the duct itself were computed separately as shown in Table 5. The thrust forces produced by the duct are about 33∼39% of the thrust forces by blades when the blades are rotating in the forward direction. On the other hand, the duct thrust forces is about 45~47% of the blades’ thrust forces when the blades are rotating in the reverse direction. All of the thrust forces and torques increase linearly with the rpm.
[Table 5] CFD Results for forward/reverse directions of the thrusters.

CFD Results for forward/reverse directions of the thrusters.
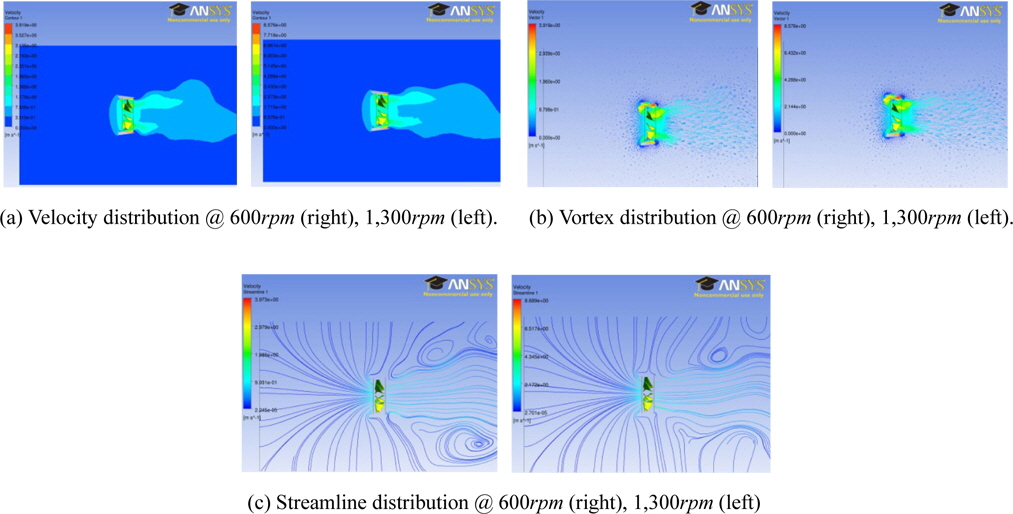
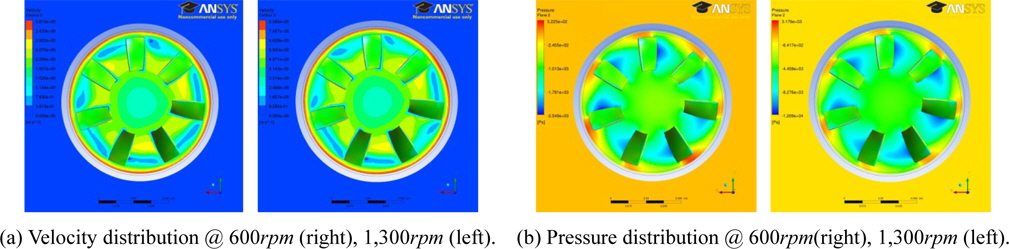
Velocity and pressure distributions on the propeller plane at the rotational speed, 600
[Fig. 16] Velocity and pressure distribution in front of the propeller plane at 600rpm and 1,300rpm.
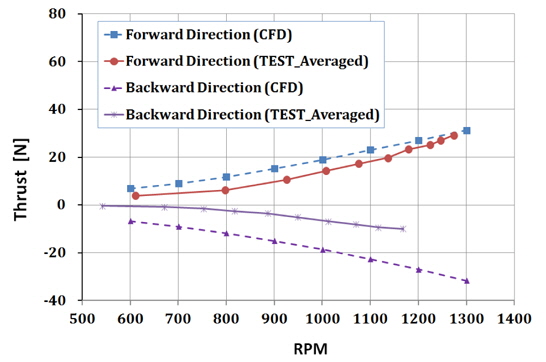
A comparison of the results obtained from the CFD analysis and those obtained from the experimental tests is presented in Fig. 18. The experimental test results were obtained from the bollard pull tests with nine copies of the 300W thruster. The averaged value of the test results and CFD analysis result are compared. While the results for the forward direction correspond well with less than 5% errors, the differences between the results in the reverse direction are significant (up to over 100% of errors). This is because the thruster supporting structure, which is located just behind the propeller as shown in Fig. 12, affects the thrust power when it rotates in the reverse direction. The flow, therefore, is unable to enter the duct directly when rotating in the reverse direction and the reverse thrust forces are consequently low compared to those for the forward direction.
Note that the revolution speeds (
>
Validation of the CFD results
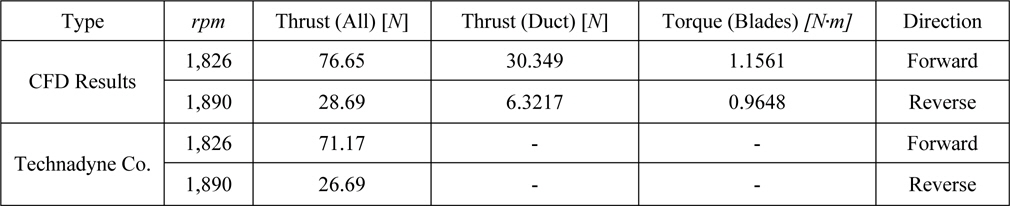
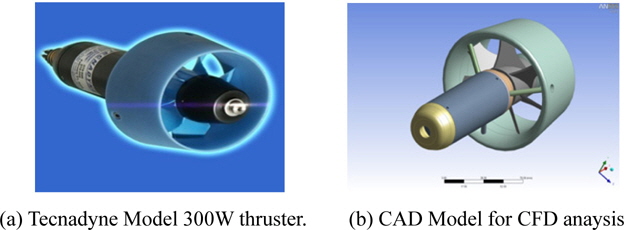
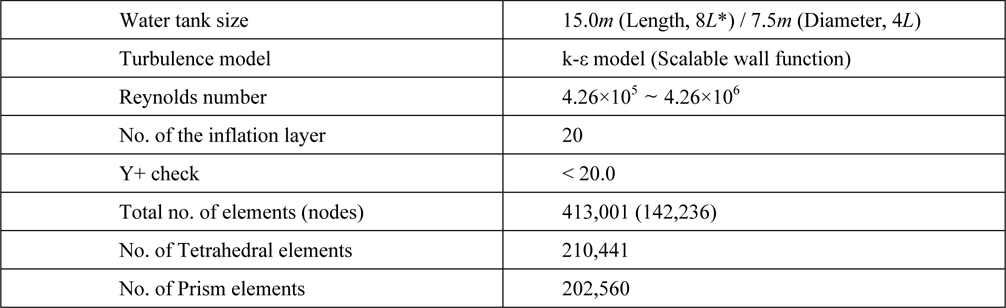
The CFD modeling and analysis process was further validated by testing the approach on a commercial off the shelf motor design, the Tecnadyne Model 300 thruster (Fig. 19). The Tecnadyne thruster was modeled and meshed, and the CFD predicted thrust measurements were compared with the experimental thrust power data provided by the manufacturer (Tecnadyne Co., 2014).
The mesh is generated based on user defined parameters describing the size of the grid at surface boundaries. The simulation conditions, such as boundary condition, turbulence model are the same as those described in the previous section. The total number of grid cells was approximately 1.46 million.
The comparison is shown in Table 6. The thrust forces for the forward direction and reverse direction are all in good agreement. The errors are about 7% at the maximum rotating speed of the blades which are 1,826
[Table 6] CFD results for model 300 (Tecnadyne co.)

CFD results for model 300 (Tecnadyne co.)
Three key CFD based test procedures have been conducted on the proposed UDR design showing that the CFD analysis can be reliably used as a substitute for experimental tests in the initial design stage.
The drag estimation was conducted first using CFD analysis with a mesh convergence study performed to validate the CFD analysis. The results of the mesh convergence study indicate the mesh size selected for the CFD anlaysis was considered to be of sufficient accuracy. The CFD analysis results revealed that the CFD derived pressure (form) drag forces are relatively larger than the friction drag forces as the speed of UDR grows.
Next, the hydrodynamic forces on the UDR body were obtained from the CFD motion analysis for the pure heaving and pure pitching motion. The added mass and inertia force of the vehicle will be derived from these hydrodynamic forces in the next research step.
A test system for measuring the bollard pull thrust force of the horizontal ducted thrusters was developed and manufactured for a test, and thrust powers obtained for a sample batch of thrusters. The thrusters were then modeled and analysed, using the CFD tools, and their predicted thrust characteristics measured. The averaged value of the measured data from the bollard pull test was compared with CFD analysis data and results were shown to correspond well as the revolution speed increases for the forward case.
The CFD modeling approach was then compared with a commercial thruster of similar design (Model 300 - Tecnadyne co.) and produced close agreement in both forward and reverse cases with physical test data produced by the manufacturer.
Based on the validation studies, the CFD results have been shown to be reliable and the CFD analysis techniques employed are shown to be suitable for initial concept analysis of underwater vehicle designs.