The global quantity of commercial traffic including container traffic in marine logistics has decreased significantly due to the global recession. The global economy began to enter recession after the Sub-Prime Mortgage Crisis in the United States. According to Bloomberg, the Baltic dry index (BDI) decreased sharply by 7343 points to 867 points in 2008. The impact of this decrease on the shipping and shipbuilding industries is expected to be significant over the next few years. The global oil price has increased gradually since 2002. In 2008, the oil price reached US $143.95 per barrel. The demand for energy in developing and developed countries is increasing steadily but the fossil fuel energy resources are finite and limited in quantity. As a result, the price of oil is expected to increase continually in the future. The price of Bunker C fuel also increased significantly. The high price of Bunker C fuel is the greatest burden to shipping companies with the low freight fare market, because it accounted for a large portion of the operating costs. Therefore, energy-saving measures have attracted considerable attention and shipbuilding industries have attempted to develop competitive hull forms and energy saving devices.
Furthermore, as global warming proceeds, many countries have been strengthening their domestic and international regulations across all industries. The regulations to limit the exhaust gases from ships and the discharge of ballast water, which is led by International Maritime Organization (IMO) and developed countries, have been strengthened. Therefore, shipping companies are faced with the several environmental requirements to effectively manage environmental pollution.
Significant global consultation and institutionalized efforts between the related bodies, including international authorities, classification societies, ship builders, shipping companies, and local government, have been made to satisfy the environmental pollution regulations. As a result, the IMO enacted the Energy Efficiency Design Index (EEDI), which is scheduled to take effect on January 2014 for carbon dioxide reduction in ship operation and building. Because of international demand, studies on how to reduce fuel consumption and greenhouse gas emissions have been conducted actively in the areas of hull resistance, propulsion and operation. Research into energy saving devices has also been conducted. The following gives a brief review of the leading studies in energy saving devices.
A comparative study of experiments and computational simulations of the condensed loaded tip (CLT) propeller (Beretta et al., 2012) and a comparative study of the biased asymmetric pre-swirl stator (PSS) propulsion system (Kang et al., 2004) have been carried out. The effects of the PSS (Celik and Guner, 2007), vane wheel (Chen et al., 1989), and duct propeller (Inukai et al., 2007) on the propeller efficiency were identified. The mechanical design of a contra-rotating propeller (CRP) assembly for a small underwater remotely operated vehicle (ROV) was reported (Thaddeus, 2006). A number of other devices have also been studied.
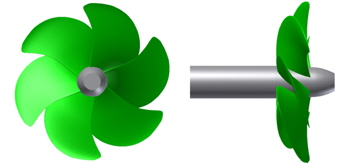
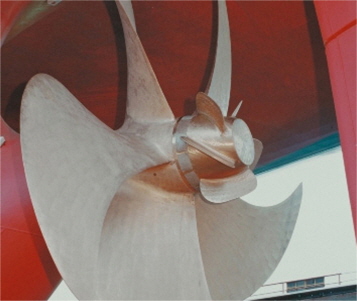
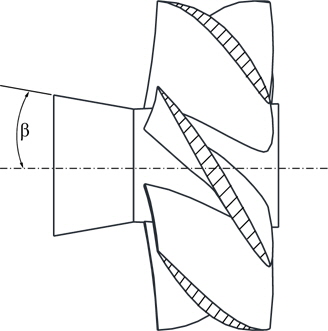
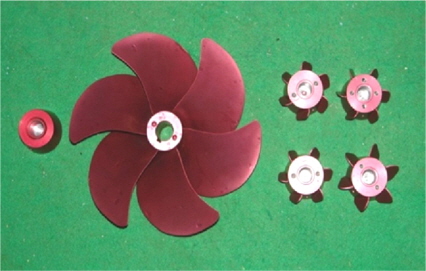
Among these energy saving devices, the PBCF is the most efficient device. Installation is simple and inexpensive due to the simplicity of the PBCF. As shown in Fig. 1, the PBCF consists of small fins attached to the boss cap behind the propeller. The PBCF rectifies the down flow from the blade trailing edge and eliminates the powerful hub vortex, so that the PBCF recovers the energy loss from the hub vortex and improves the propeller efficiency.
Ouchi et al. (1988; 1989) modeled the effects of the PBCF on the propeller efficiency and confirmed the results experimentally. Although the uncertainty in a full scale analysis is generally larger, the energy-saving effects of PBCF are larger on a full scale than in model tests based on full scale analyses of 16 different vessels (Nojiri et al., 2011). Hansen et al. (2011) performed sea trials with a model and a full scale evaluation of a PBCF fitted to an Aframax ship, and reported a 3.5 and 4% decrease in shaft horsepower under ballast and load conditions. Kawamura et al. (2012) investigated the combined effects of the Reynolds number and wake, and found that an increased Reynolds number and the presence of a hull wake positively affected the PBCF under full scale conditions.
This study examined the design parameters of the PBCF and hub cap for 6,000
This paper suggests a divergent hub cap with a PBCF. The design parameters were selected based on the geometrical shape of the PBCF. To identify the correlation between the design parameters, the DOE was performed with a full factorial experiment design and an ANOVA was conducted. An alternative design set of PBCF was selected with the DOE and ANOVA, and the effects of the propeller hub cap shape with divergent shape were analyzed.
A POW test with CFD and an experiment were performed to analyze the propulsion efficiency. A cavitation test was also performed with the selected design alternatives to analyze the hub vortex.
POW TEST OF 6,500TEU CONTAINER SHIP
>
Propeller of 6,500TEU container ship
This study focused on the propeller of a 6,500
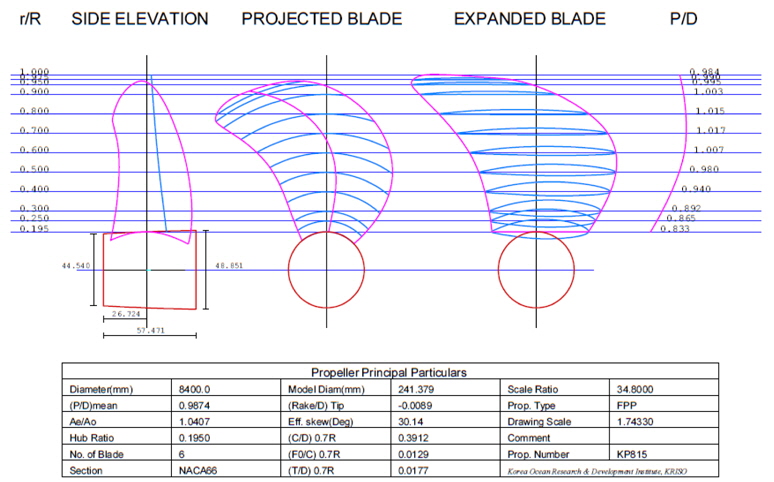
[Table 1] Propeller specifications.
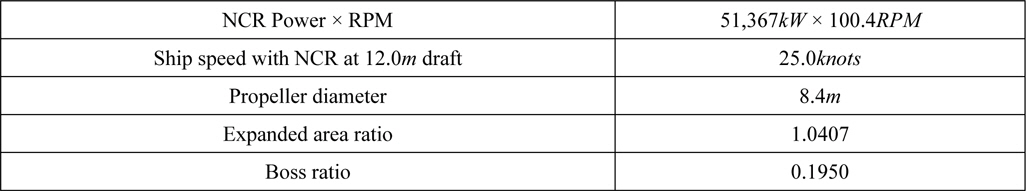
Propeller specifications.
>
Test method for propeller open water test and measuring variables
A propeller runs with non-uniform flow in the stern of the ship, and it is difficult to estimate the performance of the propeller. Actually, the performance of a propeller is affected by its own performance rather than the hull shape when attached to the ship. Therefore, a POW test estimates the performance of the propeller with a model scale of the propeller in uniform flow. The POW test performs with 1.0~1.5
The model test of the propeller must satisfy the geometric similitude law and kinematic similitude law. In addition, it needs to maintain the Reynolds number of the propeller to avoid laminar flow on the propeller blade. Eq. (1) shows the Reynolds number of the propeller.

where

where
The advance ratio (

In the model scale of the POW test,


The open water propeller efficiency ( ηo) is expressed as Eq. (6) from these coefficients.

>
Boundary condition and mesh statistics for POW Test with CFD
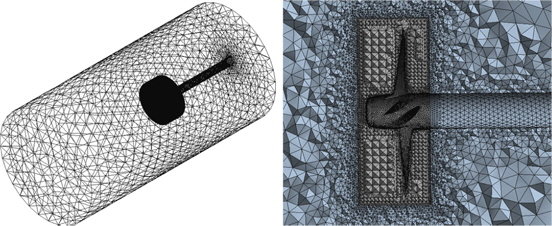
A comparative study of an experiment and computational simulation of a reversed POW test was carried out to check the validity of CFD analysis. The minimum mesh size was 0.01mm. Fig. 4 shows a half section of the generated computational mesh system in the POW test. CFD analysis was performed using ANSYS CFX 14.0.
In the POW simulation, the diameter of the propeller was 0.24
>
Calculation result of POW test
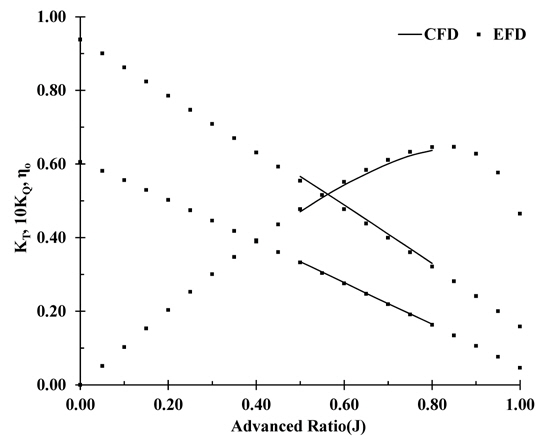
According to Park et al. (2006) and Lee (2007), who compared the POW test results calculated using a numerical method and results of a model experiment, although the thrust corresponded to some extent, there was a tendency that the size of torque was larger than the experimental result. Therefore, there is a tendency that the open water propeller efficiency was approximately 2.0% lower than the result of the model experiment.
Fig. 5 shows the results of EFD and CFD. The CFD results agreed well the experimental measurements of
The error of the calculation results was large (2.0%), which was caused by the overestimated torque, as reported in previous studies. Therefore, the mesh configuration of the analysis is valid for POW analysis. In addition, it is sufficient to compare the open water propeller efficiency by the change in the shape of the propeller hub caps through CFD analysis.
ANALYSIS OF PBCF DESIGN PARAMETERS
Ouchi et al. (1988) analyzed the effects of the PBCF design parameters by the open water propeller efficiency from the experimental test and CFD analysis. Ouchi et al. (1988) suggested 6 design parameters of PBCF as follows:
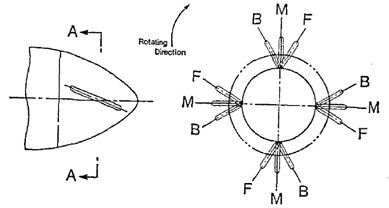
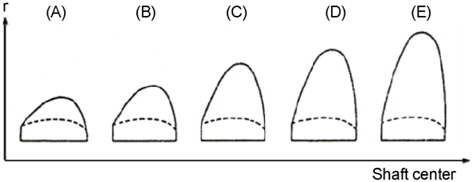
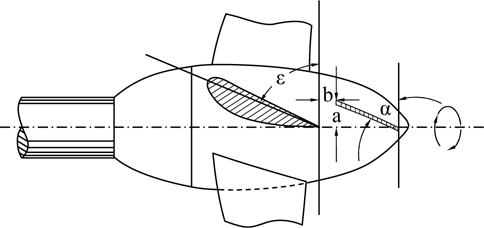
(1) Shape of the fin (See Fig. 6).(2) Radius ratio of PBCF to the propeller (r/R).(3) Installation position of the boss to cap of the leading edge of the fin (a, b) (See Fig. 7).(4) Installation angle of the fin (α) (See Fig. 7).(5) Number of fins.(6) Inclination of the fins (See Fig. 8).
Ouchi et al. (1988) reported that the most important design parameters are the installation angle of the fin, configuration of the fins (chord-span ratio) and inclination angle of the fins. Therefore, this study examined the effects of these 3 design parameters.
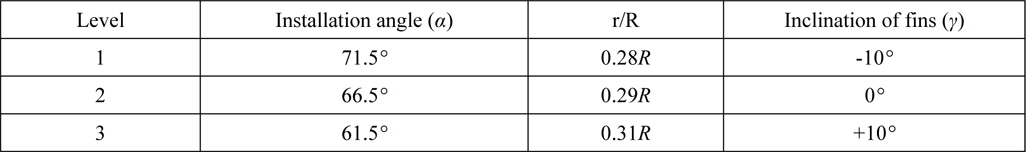
The level of the design parameters were determined based on the results reported by Ouchi et al. (1988). Table 2 lists the level of the design parameters. The installation angle of the fin was determined by the mean pitch angle of the target propeller within 0.3R. Orthogonal array is a kind of fractional factorial design that does not consider the unnecessary interactions with partial combination of the level of design parameter instead of a full factorial design that is performed with a full combination of the design parameter’s level. On the other hand, in this study, the DOE was performed with a full factorial design to identify the interactions among the design parameters of the PBCF. Table 3 shows the full factorial design of the orthogonal array table.
[Table 2] Level of the design parameters.

Level of the design parameters.
[Table 3] Orthogonal array table.
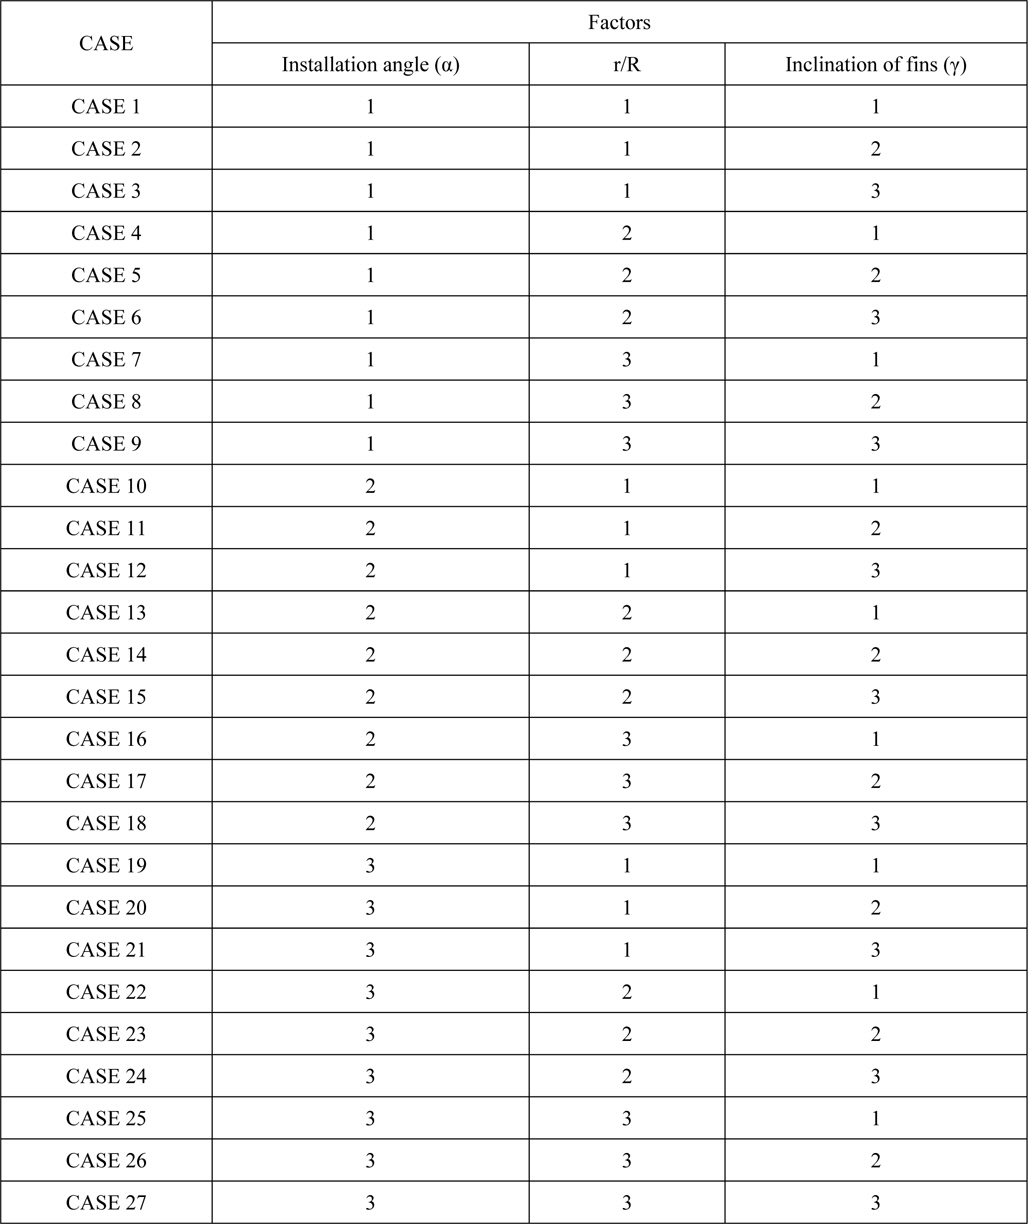
Orthogonal array table.
>
Analysis of design parameters using orthogonal array and ANOVA
An orthogonal array is kind of fractional factorial design that does not consider the unnecessary interactions with partial combination of the level of the design parameters instead of full factorial design that is performed with full combination of design parameter’s level. A fractional factorial design was performed with a series of matrix experiments, which alters the value of the design parameter to examine various design parameters simultaneously (Phadke, 1992).
If the interaction of the design parameters can be neglected, this may estimate the result of the experiment for all design conditions using a minimized experiment. The representation of the orthogonal array suggested by Taguchi is can be expressed as Eq. (7) (Park, 2007).

where
Two methods can be used to analyze the experiment result. The first is an analysis of the means (ANOM), which is used to determine the optimal level of the design parameters. ANOM analyzes the effect of the level of a design parameter. This is defined as the deviation it causes from the overall mean, which is an estimation of the effect of the level of design (Phadke, 1992). ANOVA is an analysis method to determine the main effect factors by the distribution of factors, which are represented as the sum of squares (


where
The percentage contribution (


where
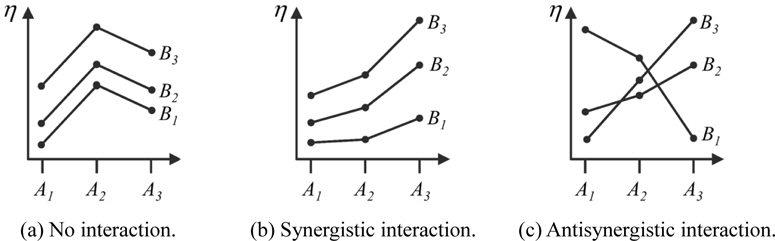
The interaction represents the combined effects of more than 2 design parameters on the result of the experiment. When an interaction is present, the impact of one design parameter depends on the level of the other design parameters (Phadke, 1992).
For example, there is an interaction

Fig. 9(a) shows the case of no interactions between the two design parameters,
>
Result of design experiment and ANOVA of PBCF
In this study, the open water propeller efficiency at an advance ratio (
[Table 4] Experimental results of the orthogonal array.
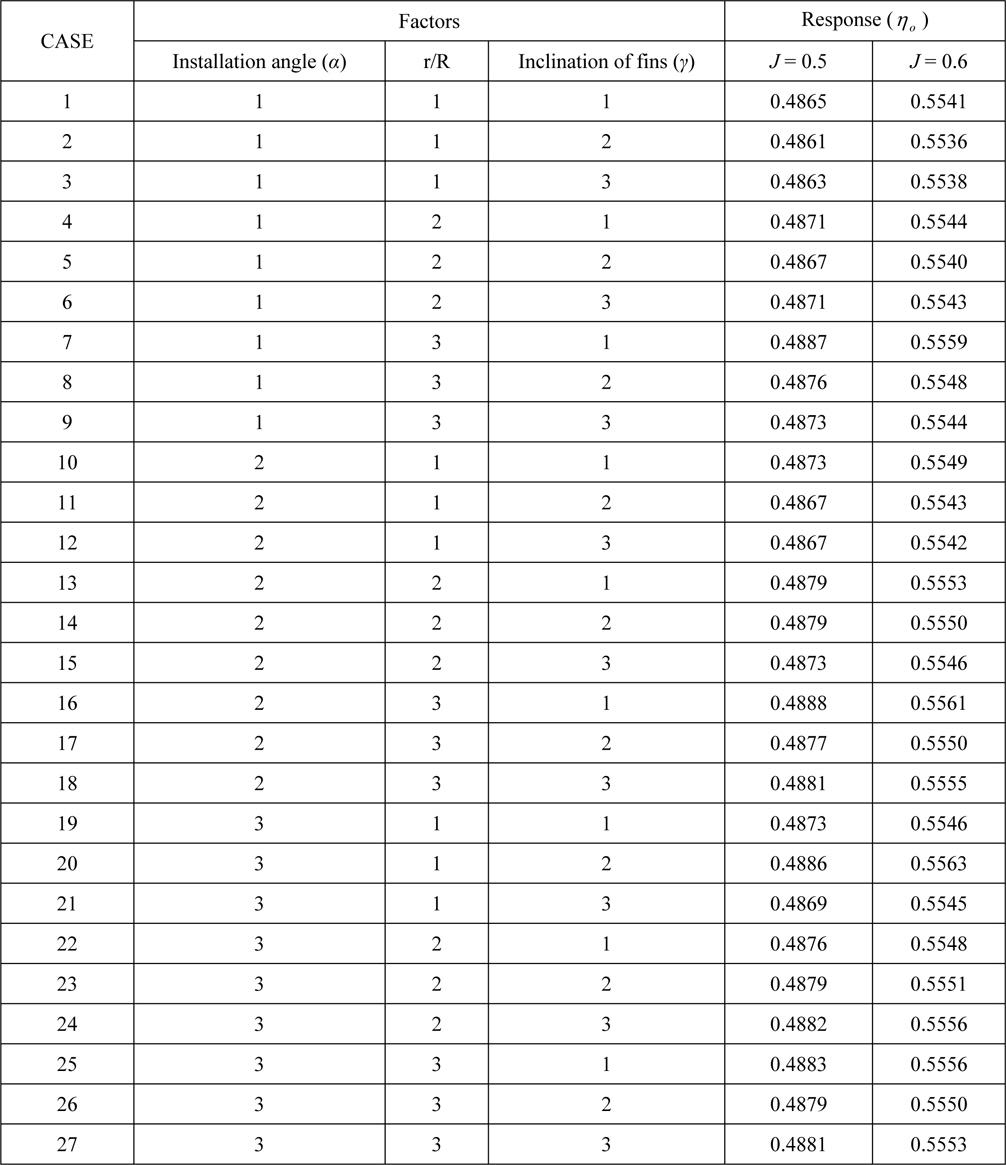
Experimental results of the orthogonal array.
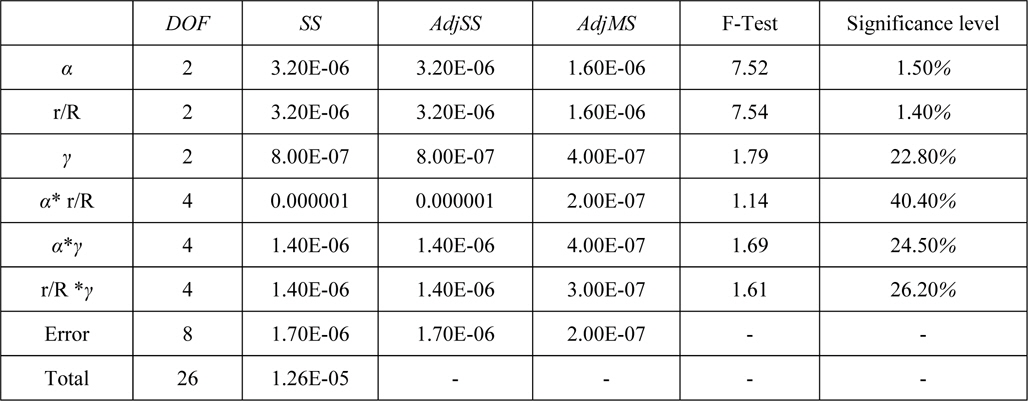
Table 5 lists the analysis results of the design parameters with an interaction. ‘*’ means the interaction among the design parameters. The installation angle and r/R are the most significant design parameters according to the F-test and significance level. The interactions among the parameters have a lesser effect. The correlation of the parameters can be summarized as follows:
Installation Angle ≈ r/R ≫ Inclianation of Fin
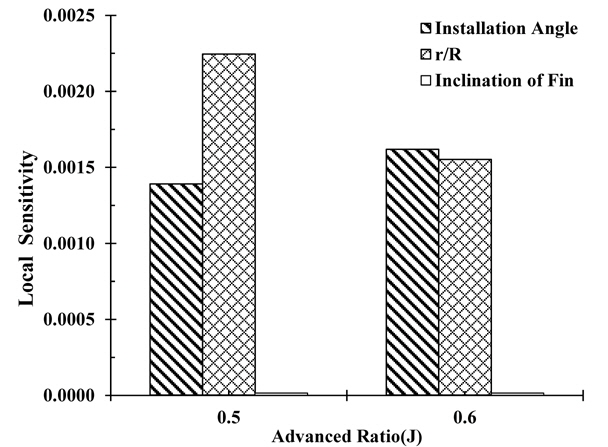
Sensitivity analysis was performed using the design parameters according to ηo (Fig. 10). The effect of the installation angle and r/R mainly affects ηo but the effect of the inclination of the fin is insignificant. This result is the same as the result obtained by ANOVA. The r/R is affected by the change in the advance ratio but the pitch angle does not react sensitively to a change in the advance ratio. As the installation angle and r/R increase, the increasing single effect of the propeller can be estimated.
These 4 design alternatives were selected from the ANOVA, design parameters sensitivity analysis and DOE results. Fig. 11 shows the design alternatives for the PBCF.

Result of ANOVA.
ANALYSIS OF THE HUB CAP DESIGN PARAMETERS
>
Divergent hub cap design parameters
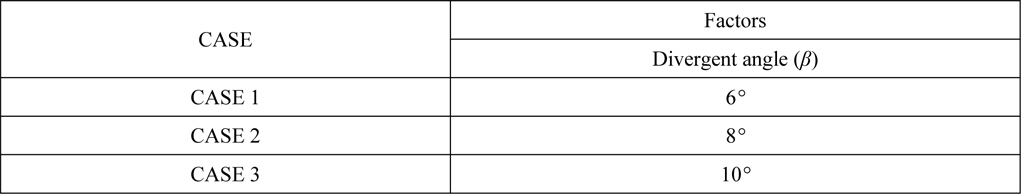
This section analyzes the effect of ηo , which is caused by the shape of the hub cap. A change in the hub cap shape can result in a change in η o, which alters the outflow pattern of the propellers as PBCF. This study examined the divergent cap to reduce the hub vortex of the outflow of propellers. Fig. 12 shows the divergent angle of the cap, where the level of the divergent angle was set in the range of 6 to 10°. This value was determined by the maximum radius ratio of the end of the hub cap, which does not exceed the 0.2R of the propeller. With these angles of the divergent cap, ηo was calculated by CFD analysis. CFD analysis was performed at advanced ratios of 0.6~0.7. Fig. 12 shows experimental case for the divergent hub cap. Table 6 lists the analysis case for the divergent angle of the hub cap.
[Table 6] Cases for divergent angle of hub cap.

Cases for divergent angle of hub cap.
>
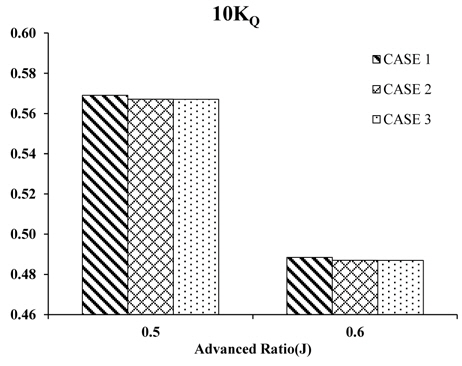
Result of design experiment of divergent hub cap
Table 7 lists the analysis results of POW. CASE 2 shows that 2.1% of ηo has been improved compared to the normal cap. That is the mean improvement of η ofrom a divergent cap (Mewis and Hollenbach, 2006). Figs. 13-Figs.15 show the changing characteristics of the propeller according to the divergent angle.
[Table 7] Analysis result of the divergent angle of the hub cap.
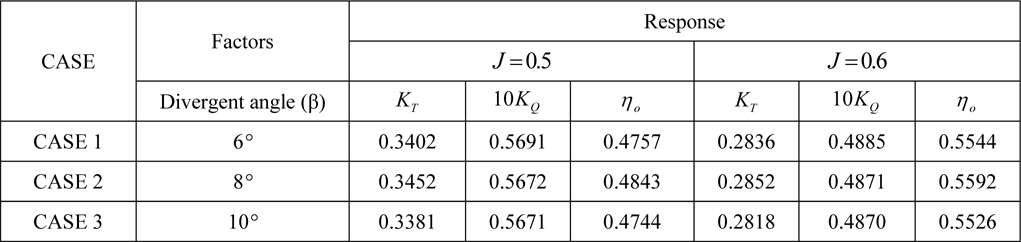
Analysis result of the divergent angle of the hub cap.
CFD ANALSYS OF ALTERNATIVE DESIGNS
>
Selected alternative designs
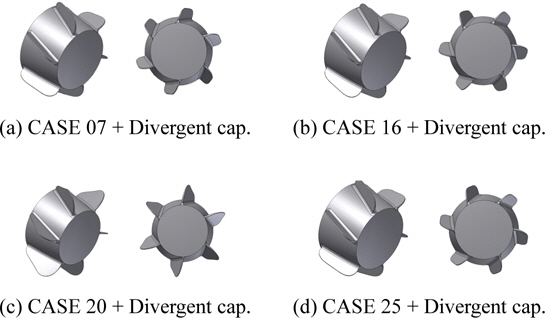
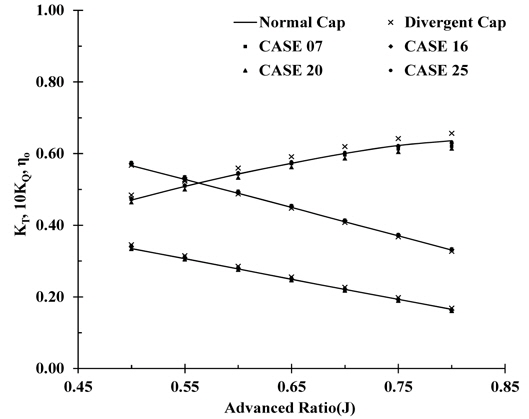
Fig. 16 shows the final design alternatives of the PBCF with the divergent propeller cap from the results of the DOE.
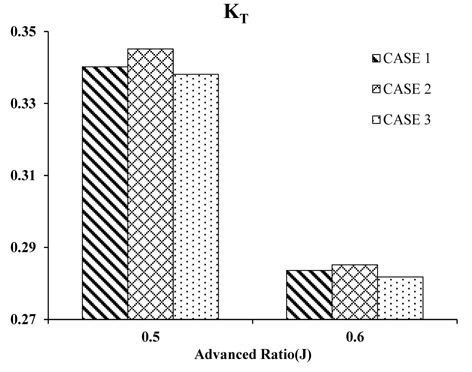
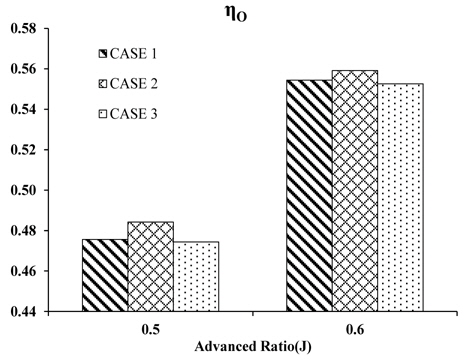
The CFD calculation was performed using these models. Fig. 17 shows the analysis results of the POW test. The divergent cap improved ηo by approximately 2%. On the other hand, the other models decreased ηo slightly. Nevertheless, these values were approximately 1~2%, so its effects are quite small compared to the normal cap. Therefore the shape of PBCF with a divergent cap will not work properly as expected.
EXPERIMENT OF THE PROPELLER OPEN WATER TEST
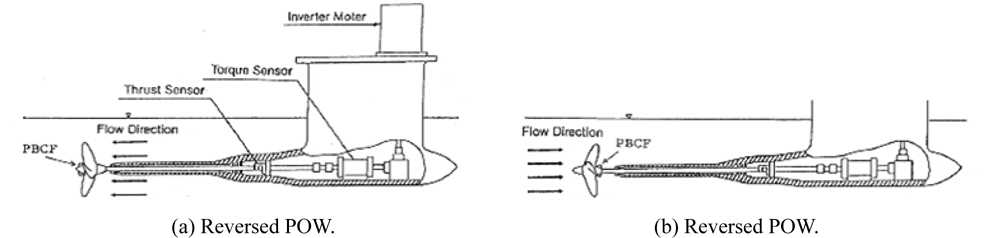
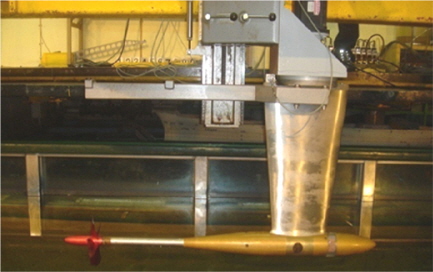
According to the West Japan fluid engineering laboratory (FEL; Ouchi et al., 1990), the conventional POW test is unsuitable for generating the hub vortex. In the conventional POW test, the test equipment, which contains a torque and thrust gauge, and propeller rotating device, etc. are placed on the downstream side of the testing propeller. On the other hand, the propeller shaft is located at downstream of the propeller, where the hub vortex is generated. Therefore, this method is unsuitable for measuring the effects of the hub vortex. Therefore, they suggested a new POW test method (Fig. 18) to properly generate the hub vortex downstream of the propeller. According to the 14th and 17th ITTC recommendations, the POW test results are reasonable when the Reynolds number is greater than 3.0 × 10⁵ at 0.7R (Kim et al., 2000). Therefore, to identify the propulsion characteristics of the PBCF and the flow pattern of the propeller downstream in this study, the speed of the propeller set was set to 13.0
The POW test of PBCF was carried out at the Korea Institute of Ocean Science & Technology (KIOST). Fig. 19 presents a model of the propeller and PBCF. Fig. 20 shows the arrangement of the reversed POW test. Fig. 21 shows the test model of the PBCF attached to the propeller.
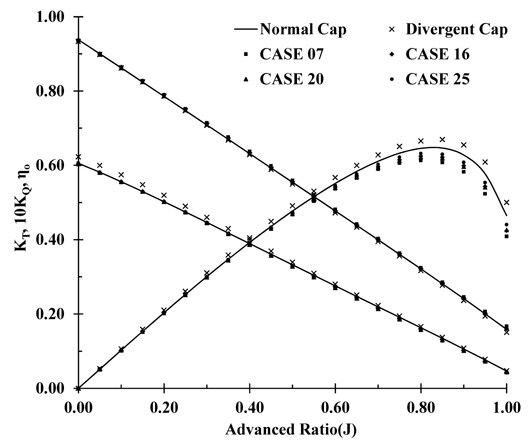
To understand the effects of the PBCF only on the propeller efficiency, 6 cases of the POW test were carried out at 13rps. Fig. 22 shows the results of the POW test. The propeller with a divergent cap showed higher efficiency than that with a normal cap. On the other hand, in the case of a shape with a divergent cap attached to the PBCF, the open water propeller efficiency was reduced from 2.7% to 7.5%. In both cases, the decrease in efficiency appeared to be due mainly to a change in torque but there was a small change in thrust. In the case of a divergent cap, a prominent increase in the torque coefficient was noted, but a decrease in torque was observed in the others. This suggests that the torque coefficient of a divergent cap increased because of the effect of the reduced hub vortex. The increase in the hub vortex in the PBCF-attached divergent cap appears to be a cause of the lower torque coefficient.
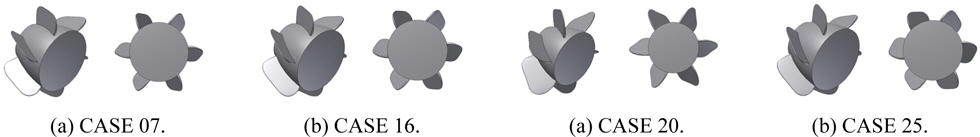
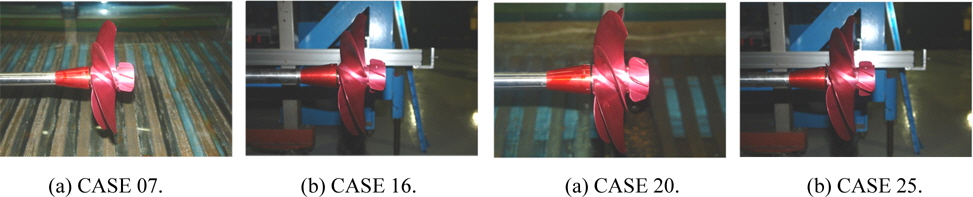
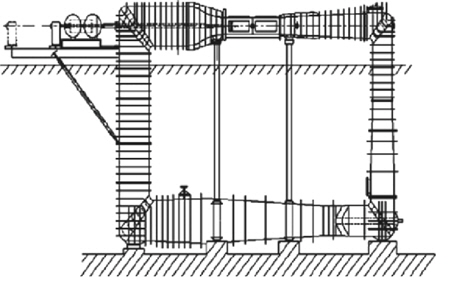
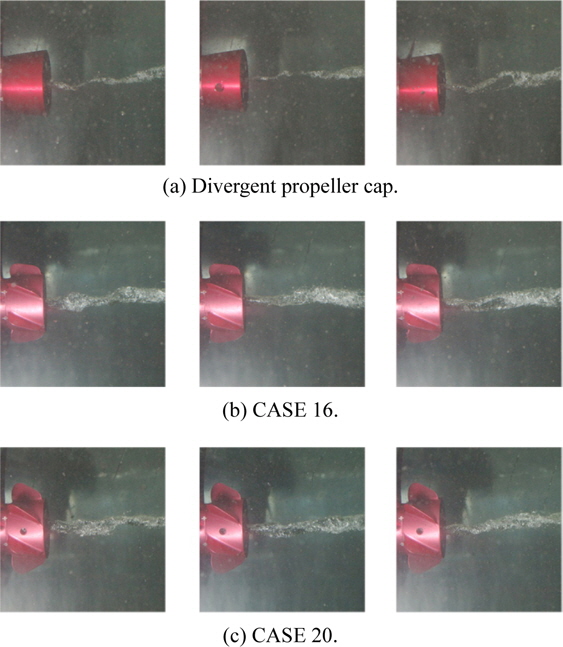
To determine the cause of the decrease in the efficiency of the design alternatives selected above, a cavitation test for case 16, case 20 as well as a divergent cap were performed. Table 8 lists the test conditions for the cavitation observations. The cavitation test was performed in a medium-sized cavitation tunnel (2D), as shown in Fig. 23. The maximum test speed was 12
[Table 8] Cavitation test condition.
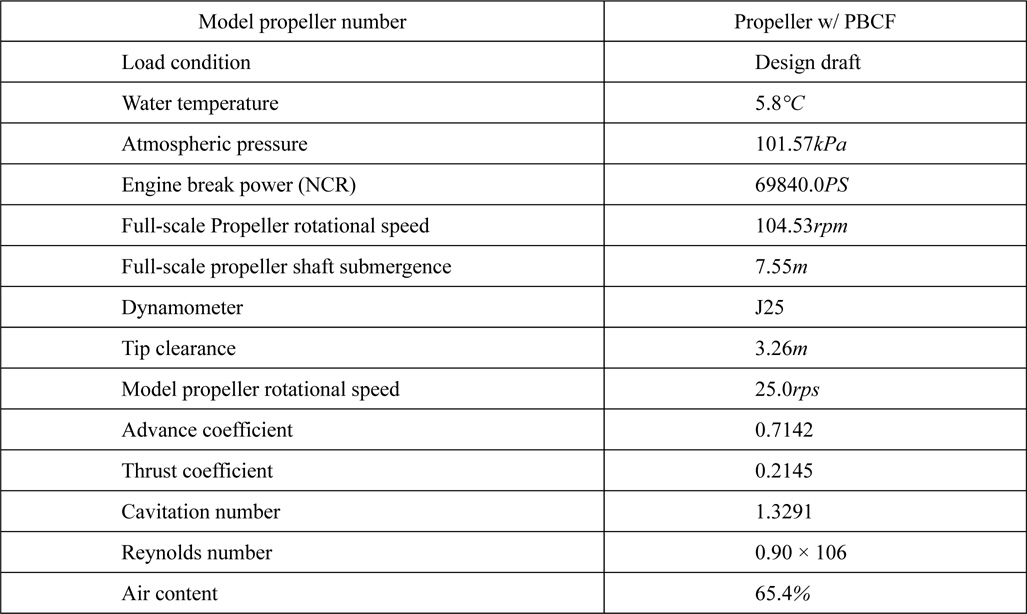
Cavitation test condition.
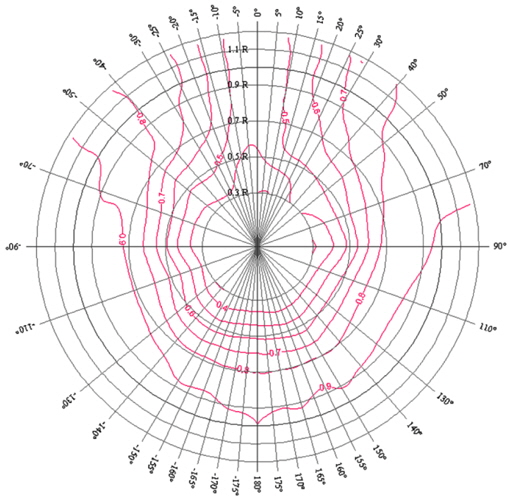
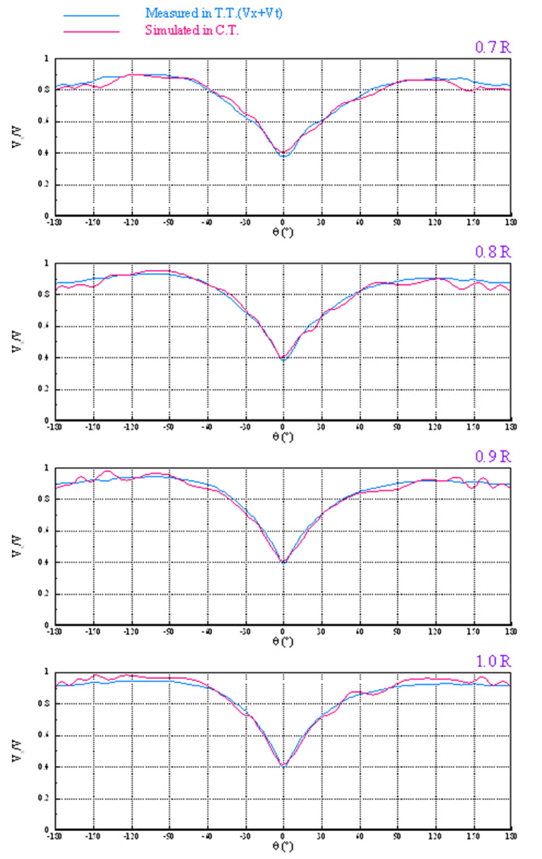
Fig. 24 shows the iso-axial velocity curves of the wake reproduced in the cavitation tunnel. In the cavitation test, the wake was generated by the brass mesh. To check the validity of the simulated wake in the cavitation tunnel, Fig. 25 shows the velocity distributions at 0.7
Fig. 26 shows photographs of the hub vortex. The size of the hub vortex in Fig. 26(a) was smaller than the other cases attached to the PBCF. This suggests that the increased size of the hub vortex is caused by PBCF. The PBCF effect can be negative depending on the shape of the hub cap. As assumed in the POW test, which was carried out before, the size of the hub vortex was larger in the PBCF-attached shape than the divergent propeller cap. This appears to affect the torque of the propeller.
This study examined the correlation among the PBCF design parameters by DOE. The results showed that the pitch and chord to the span ratio are more likely to affect the propeller efficiency than the other design parameters. In addition, the correlation among the parameters was insignificant. Experiments for different diffuser shapes of the hub cap were carried out to determine the effects of the divergent angle of the hub cap on the propeller efficiency. The optimal shapes of the PBCF with the divergent cap were designed based on the results of the DOE. A POW test and cavitation test were performed with the optimal design set, which is a result of the DOE. The results showed that the propeller efficiency with the PBCF on the divergent cap had a decreasing tendency. The cavitation test was performed to identify the phenomenon. The cavitation test result showed that the strong hub vortex at the downstream of the propeller increased. This explains why the hub vortex downstream of the propeller increased the torque of the propeller resulting in a decrease in the performance of the propeller. Future studies should examine the relationship between the divergent angle of the hub cap and the shape of the PBCF design parameters.