Insects are among the most diverse groups of animals; the number of existing species is estimated to be between six and ten million (Chapman, 2006; Vojtech
Mental health can be defined as an expression of emotions, or as a state of well-being (Patel and Prince, 2010). There are different types of mental health problems, such as depression and anxiety disorders (Kitchener and Jorm, 2002). Maintaining good mental health is crucial to living a long and healthy life; this has become increasingly clear in recent years (Patel and Prince, 2010). Various therapies have been developed to prevent this problem, including music therapy, art therapy, play therapy, drama therapy, horticultural therapy, and animal-assisted therapy, among others (Marcus, 2013; Söderback
The rearing or observation of insects can provide some humans with good feelings or even affection; therefore, it is possible that insects may be used effectively as a therapeutic tool. In this study, we performed a survey analysis examining people’s concepts and awareness regarding insects in Korea. These findings may be helpful in developing a therapeutic mental healthcare approach that utilizes insects.
The survey was administered to 788 people, including elementary, middle, and high school students and adults, from May to October 2013. The survey questions were classified into several groups by gender, age, residence, and experience of insect-related events.
Collected data were converted for coding and analysis with SPSS statistical software (Statistical Product and Service Solutions). Some coding data were also re-coded on an ordinal scale. Frequency, significant difference, and correlation analyses were performed on the coding data using SPSS program version 12.0 (SPSS, Inc., Ctahicago, IL, USA). Significant differences in the nominal and ordinal scales were evaluated by crosstabulation and
>
Demographic data and concepts of insects
The survey population comprised 788 people, as indicated in Table 1. The component ratio of male to female was approximately 3:4. Students composed about 37% of all survey respondents. The proportion of rural residents was quite low, at about 14%.
[Table 1.] Demographic data of survey respondents
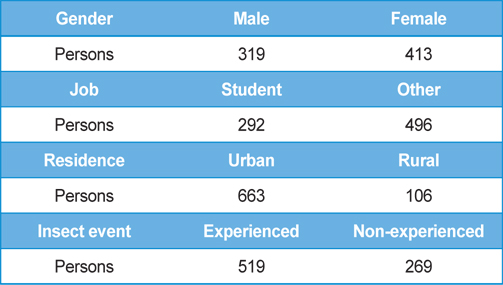
Demographic data of survey respondents
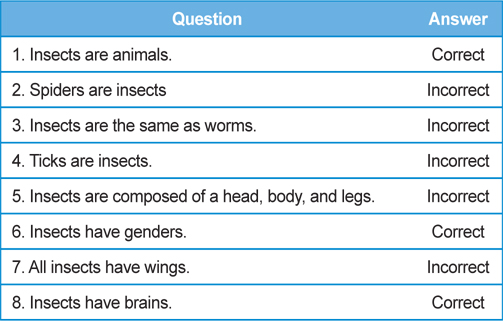
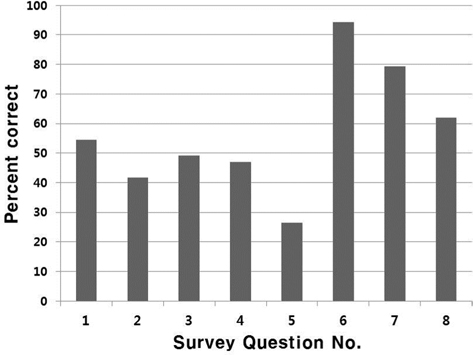
To analyze individuals’ concepts of insects, the survey included eight questions to differentiate insects from other small animals, and to identify the basic characteristics of insects (Table 2). The concept of insects was evaluated by assessing and scoring correct answers for each question. The overall percentage of correct answers was about 57%, but it was highly variable, depending on the question (Fig. 1). The misconception of the basic structure of insects was especially high.
[Table 2.] Questions for the concept of insects

Questions for the concept of insects
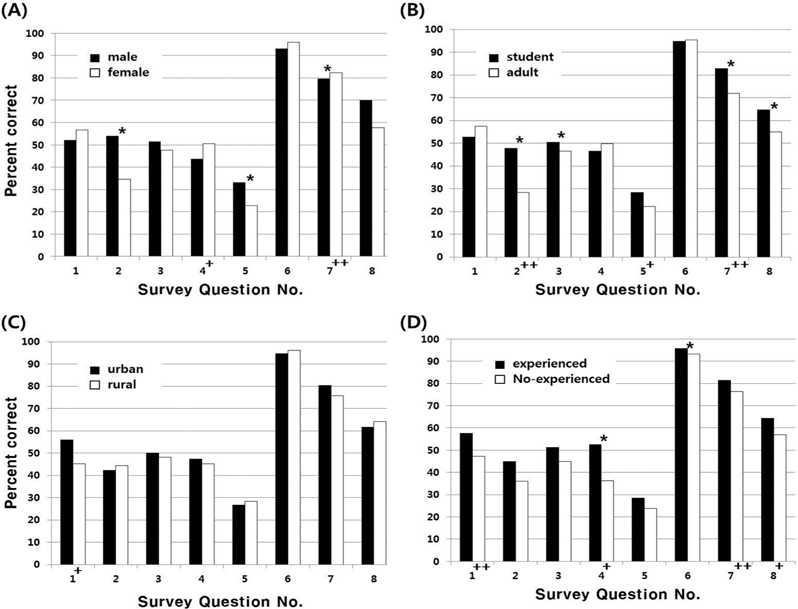
Additionally, the survey responses indicated low ability (below 50%) to differentiate insects from other small animals. Significant differences and correlations were found between students and adults (Fig. 2B). These differences were also found between people who had experienced insect-related events and those who had not (Fig. 2D). Students and people experienced with insectrelated events had a more correct concept of insects than adults and non-experienced people, respectively. These results indicate the importance of continuing education and increased experience with insects. No significant differences were found between gender or residence and insect concept (Fig. 2A and 2C).
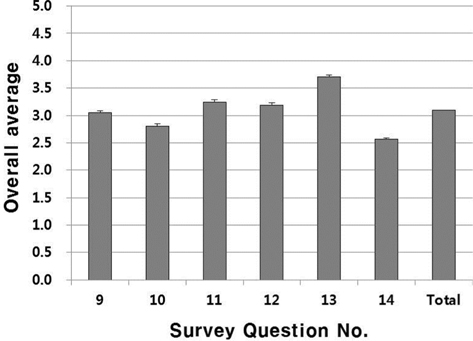
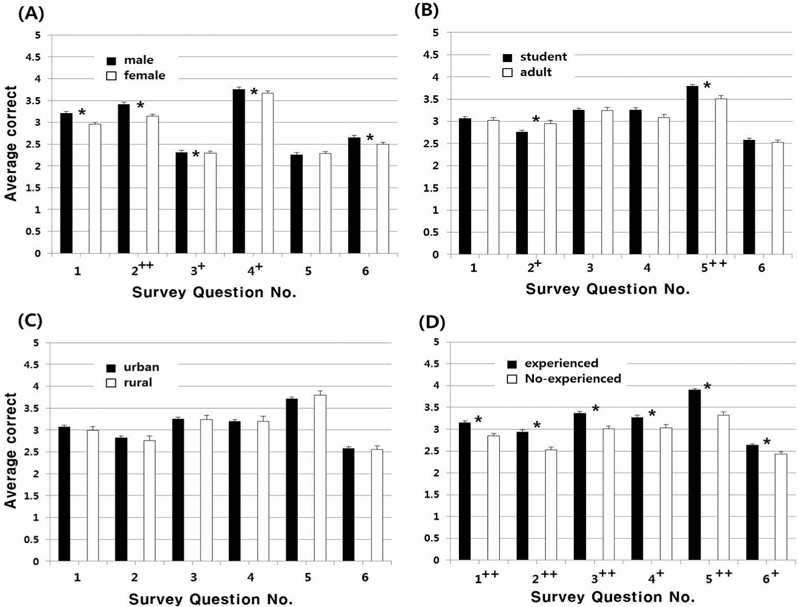
To investigate people’s awareness of insects, the survey included six items concerned with understanding insects (Table 3). The survey responses were rated on a five-point scale that ranged from highly positive to highly negative. For statistical analysis, these answers were re-coded to an ordinal scale: highly positive (5), positive (4), normal (3), negative (2), and highly negative (1). Overall awareness of insects was somewhat high, with an average of 3.1 (Fig. 3). The lowest-scored item was the question concerning participants’ knowledge of the harmfulness of insects. This response suggested that people dislike insects without clear reasons. The significant difference and correlation were found between students and adults, male and female, people experienced in insect-related events and those who were not (Fig. 4A, 4B, 4D).
[Table 3.] Questions for the awareness of insects
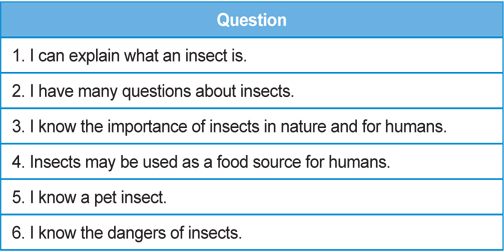
Questions for the awareness of insects
Students, male participants, and people experienced in insect-related events had higher overall insect awareness. The experience of insect-related events influenced insect awareness more than did anything else; e.g., residence had no influence on awareness of insects (Fig. 4C). These results indicate that these people may show more effective results when insect therapy is offered, but also that the tools for insect therapy should be applied according to people’s individual differences. These survey results may be useful as basic data in the development of a tool for insect therapy or other insect applications.