Recently, the sedative-hypnotic effect of
In humans, sleep is essential to maintain health due to its primary function of providing rest and restoring the body’s energy levels (Krueger et al. 2008, ). Sleep is important for physical and cognitive performance, the immune system, mood stability, productivity, and quality of life (Krueger et al., 2008; Imeri and Opp, 2009). Disorders and deprivation of sleep impair cognitive and psychological functioning and worsen physical health (Brand and Kirov, 2011). Although sleep is fundamental to human health, insomnia is currently a widespread health complaint and has become a prevalent and disruptive problem in modern society (Borja and Daniel, 2006; Doghramji, 2006; Erman, 2008). Sleep aids that contain constituents or extracts from foods and plants have become popular as alternatives to prescription sleep drugs to improve sleep quality and avoid adverse side effects (Meletis and Zabriskie, 2008). Therefore, there is a growing demand for a novel class of hypnotic food constituents.
In the present study, to better understand the hypnotic effects of ECE, changes in the sleep-wake profiles of animals after oral administration of ECE were studied by recording electroencephalogram (EEG) and electromyogram (EMG). C57BL/6N mice were used because their sleep-wake cycle and delta activity are more stable than other strains (Huber et al., 2000).
To prepare ECE, dried
All procedures involving animals were conducted in accordance with the animal care and use guidelines of the Korea Food Research Institutional Animal Care and Use Committee (permission number: KFRI-M-12027). C57BL/6N mice (male; 27-30 g; 12 weeks old) were purchased from Koatech Animal Inc. (Pyeongtaek, Korea). Animals were housed in an insulated, sound-proof recording room maintained at an ambient temperatures of 23 ± 0.5℃, with a constant relative humidity (55 ± 2%) on an automatically controlled 12 h light/12 h dark cycle (lights on at 09:00). Mice had free access to food and water. All efforts were made to minimize animal suffering and to use only the number of animals required for the production of reliable scientific data.
ECE was dissolved in sterile saline containing 0.5% carboxymethyl cellulose immediately before use, and was administered orally (p.o.) to mice (
>
Polygraphic recordings and vigilance state analysis
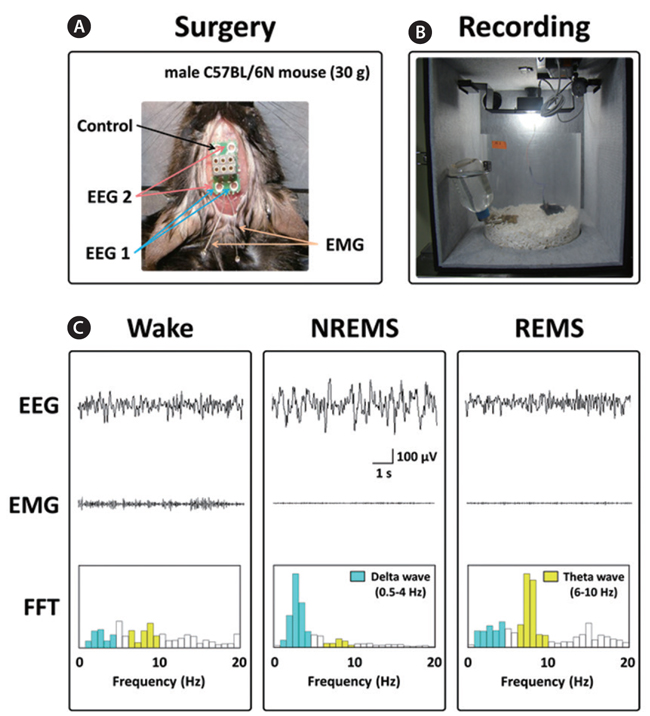
Under pentobarbital anesthesia (50 mg/kg, i.p.), mice were chronically implanted with a head-mount (#8201; Pinnacle Technology Inc., Lawrence, KS, USA) installed with EEG and EMG electrodes for polysomnographic recordings. The front edge of the head-mount was placed 3.0 mm anterior to the bregma, and four electrode screws for EEG recordings were positioned in holes perforating the skull (Fig. 1A). Two EMG wire electrodes were inserted into the nuchal muscles. The head-mount was fixed to the skull with dental cement. After surgery, mice were allowed to recover in individual cages for 1 week and to acclimate to the recording conditions for 3-4 days before the experiment.
The EEG and EMG recordings were performed using a slip ring designed to allow the mice to move freely (Fig. 1B). Two EEG channels and one EMG channel were recorded using the PAL-8200 data acquisition system (Pinnacle Technology Inc.). The signals were amplified (100×), filtered (low-pass filter: 25 Hz EEG and 100 Hz EMG), and stored at a sampling rate of 200 Hz. Recording started at 09:00 and continued for 12 h. To evaluate sleep-promoting effects, recording was performed for 2 days. Data collected during the first day served as a baseline comparison (vehicle) for the second experimental day (test article).
The vigilance states were automatically scored by a 10 s epochs as wakefulness (Wake), rapid eye movement sleep (REMS), or non-REM sleep (NREMS) based on fast Fourier transform (FFT) analyses by SleepSign ver. 3.0 (Kissei Comtec, Nagano, Japan), according to the standard criteria (Qu et al., 2010). The FFT is a computational tool that facilitates signal analysis, such as power spectrum analysis and filter simulation using digital computers (Cochran et al., 1967). FFT analyses of EEG could be classified into two frequency bands; namely, δ (0.75-4 Hz) and θ (6-10 Hz) (Kohtoh et al., 2008). As a final step, defined sleep–wake stages were examined visually and corrected if necessary.
All data are expressed as the mean ± SEM (
>
Effects of ECE on sleep latency and the amounts of NREMS and REMS
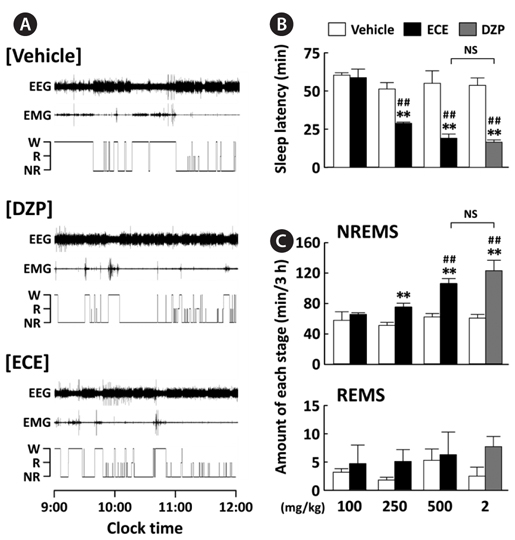
EEG and EMG signals in mice were recorded for 12 h after oral administration of ECE (100, 250, or 500 mg/kg) at 09:00, and its effects were compared to the positive control DZP (2 mg/kg). Fig. 2A shows representative EEG and EMG signals and the corresponding hypnograms for vehicle, ECE, and DZP. As shown in Fig. 2B, ECE (250 and 500 mg/kg) significantly (
The sleep structure of animals is composed of NREMS and REMS. The sleep-wake states are generally characterized as follows: Wake, low-amplitude EEG and high-voltage EMG activity; NREMS, high-amplitude slow or spindle EEG and low-voltage EMG activity; and REMS, low-voltage EEG and EMG activity (Fig. 1C) (Bastien et al., 2003; Kohotoh et al., 2008). The total time spent in NREMS and REMS for the first 3 h after ECE or DZP administration was calculated (Fig. 2C). ECE (250 and 500 mg/kg) significantly (
The sedative-hypnotic effects of ECE are caused by the phlorotannins found in brown seaweed. The phlorotannin fraction of ECE significantly promotes pentobarbital-induced sleep in mice; however, the residual fraction does not show any significant hypnotic effects (Cho et al., 2012a). The phlorotannin fraction induces sleep via the positive allosteric modulation of GABAA-BZD receptors (Cho et al., 2012a). In addition, major phlorotannin constituents dieckol, eckol, eckstolonol, and triphlorethol A have been found to have binding affinity to the GABAA-BZD receptors (Cho et al., 2012b) and potentiate the pentobarbital-induced sleep in mice (data not shown).
>
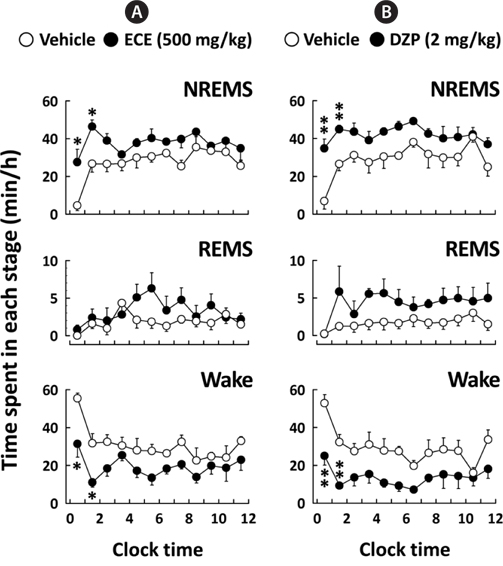
Effects of ECE on the time spent in each sleep stage
Fig. 3 shows the time course changes in NREMS, REMS, and Wake for 12 h after the administration of ECE or DZP. After ECE administration, the amount of NREMS immediately increased, while the amount of Wake decreased. These effects were significant (
>
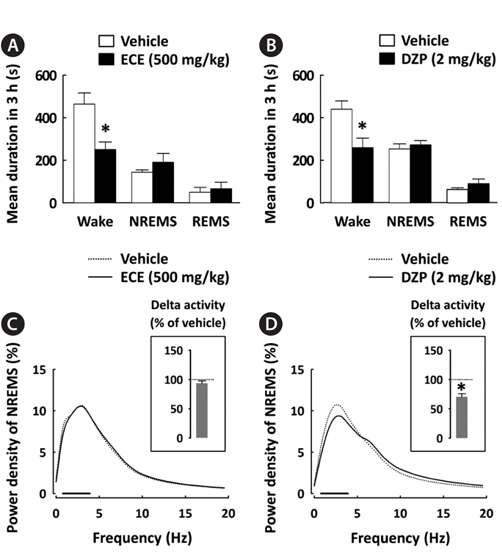
Effects of ECE on the mean duration of each sleep stage and EEG power density in NREMS
To better understand the sleep profile caused by ECE, the mean duration of each sleep stage and EEG power density in NREMS were calculated. ECE and DZP significantly (