In the cardiovascular disease group, coronary artery disease (CAD) is the most prevalent disease that leads to death. CAD causes roughly 1.2 million heart attacks each year, and more than 40% of those suffering from a heart attack will die. Even more worrisome, 335,000 people with heart attacks will die in an emergency department, or before ever reaching the hospital. According to the American Heart Association, over 7 million Americans have suffered a heart attack in their lifetime [1].
In the CAD, the coronary arteries become narrower, and the heart muscles are deprived of an adequate supply of blood and oxygen.
When the blood flow slows down, the heart doesn't receive enough oxygen and nutrients. This usually results in chest pain, called angina. When one or more of the coronary arteries are completely blocked, the result is a heart attack [2].
To diagnose the CAD, many factors have to be considered, which makes the detection difficult and time-consuming. Moreover, some of the detection tests, such as electrocardiography (ECG), echocardiography, and the exercise test, are not very accurate. Currently, the gold standard for the diagnosis of CAD is angiography, which is an expensive and invasive procedure.
In recent decades, many experts have tried to make CAD diagnosis using computer-aided techniques, such as neural networks [3], the Bayesian model and decision tree [4], support vector machine [5], and the naive Bayes classifier [6]. The purpose of such researches is to help physicians to make CAD diagnosis by a non-invasive procedure.
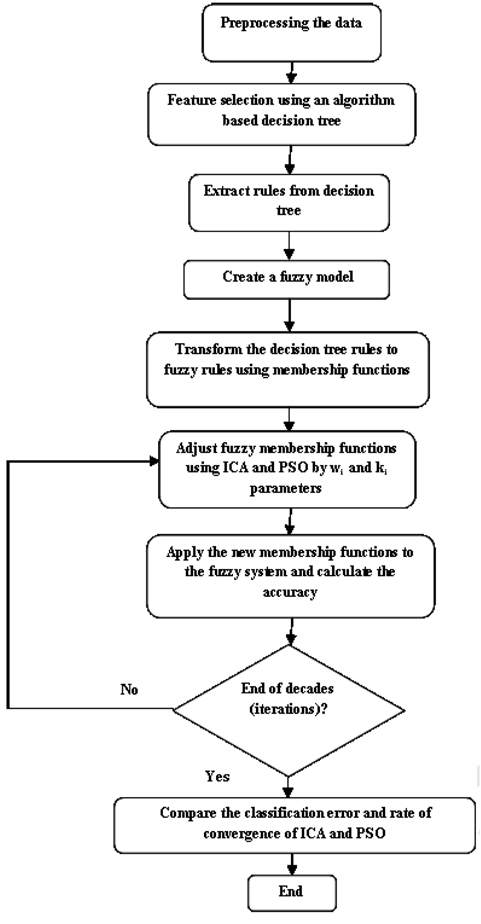
This article proposes an optimization system using two evolutionary algorithms, the imperialist competitive algorithm (ICA) and particle swarm optimization (PSO), based on a fuzzy expert system that involves four stages. The first stage is to preprocess the data used for training. This primarily involves dealing with missing values, outliers, and feature selection. In the second stage, a decision tree is created, and a set of rules are extracted from it. In the third stage, the rules are transformed into fuzzy rules, using fuzzy membership functions. Finally, in the fourth step the fuzzy membership functions are separately tuned by ICA and PSO, and the results are then compared. The fuzzy model with the optimized parameters results in the final fuzzy expert system (FES). Since the generated FES is based on a set of rules, the decisions that are made provide interpretability.
Generally, the innovations of this paper are as follows. This papar proposes a hybrid method for rule learning, using membership functions based on the ICA and fuzzy set; proposes a method with acceptable performance and sensitivity, in comparison with other interpretable methods; and proves the superiority of ICA, in comparison with PSO, from the viewpoints of performance and convergence.
This paper is organized as follows. Section II briefly introduces the datasets employed, and the decision tree algorithm. In Section III, the fuzzy expert system and its parameters are presented. Simulation details and the results are reported in Section IV. The conclusion and future works are provided in Section V.
To evaluate the proposed system, two datasets in heart disease have been used. Both datasets are provided by the University of California at Irvine. The datasets are the Hungarian Institute of Cardiology, Budapest, and the Cleveland Clinic datasets [7]. There are 597 records in total. There are 76 attributes in the datasets, of which all researches just use 14: 13 of them as inputs and 1 attribute as a result. The 13 input attributes include age, blood pressure, serum cholesterol, maximum heart rate, sex, chest pain type, fasting blood sugar, resting ECG, exercise-induced angina, oldpeak, slope, fluoroscopy, and thallium scan. The output variable is the angiography status.
The first step is to preprocess the data sets. This primarily includes the filling of missing values, removal of outliers, and feature selection. The different preprocessing steps that are used are: filling the missing values, dealing with outliers, and normalizing the data and attribute selection.
Real databases frequently include missing data for many reasons, such as the tests not having been performed entirely, or the data being unavailable. Handling them is a very significant step, because they could lower the accuracy of classification. There are different methods for this purpose. Two important methods are removing attributes, including missing data, and data imputation, which estimates and calculates the missing values, by methods like mean and mode values. The first one is used when there are a small number of missing values. In this system, the second method is employed, because of the relatively high number of missing data from the CAD dataset. The categorical values are replaced with the mode, and the numerical values with the mean [8].
Having accurate results, the data preprocessing steps were thoroughly performed: filling the missing data, removing outliers, and normalizing the data had all been done.
Distance-based outliers methods are used to detect the outliers, using the k-nearest neighbor and Euclidean distance. In the normalization step, the intervals of all data were changed to between [0,1]. Data were normalized with the Eq. (1).
A decision tree is a decision support tool that uses a tree-like model. It is a flowchart like tree structure, in which each node represents a test on an attribute value, each branch represents an outcome of the test, and tree leaves represent classes or class distributions. A decision tree can easily be converted to classification rules [9]. Decision trees have several advantages. They are simple to understand, can model large and complex data, and can be combined with other methods. A path from root to leaf represents a classification rule. A decision tree is used for feature selection, and as a rule producer in the proposed system.
Sometimes, the training and learning of decision trees produces large trees. If the tree is too large, the class of a new instance is hard to determine. Pruning decision trees is an important step in the learning phase. The size of the decision tree can be reduced by removing unnecessary features that do not affect the decision tree classification accuracy. Tree pruning will increase the classification accuracy for future instances. To obtain high classification accuracy, pruning the decision tree was done in the proposed system.
The extracted rules from the decision tree will change to fuzzy rules. This requires having a fuzzy model. To create a fuzzy model, there are three main steps to perform: fuzzification, fuzzy inference system, and deffuzification process. The fuzzy model design process includes the following definitions: 1) input and output variables, 2) fuzzy membership functions for each variable, and 3) fuzzy rules.
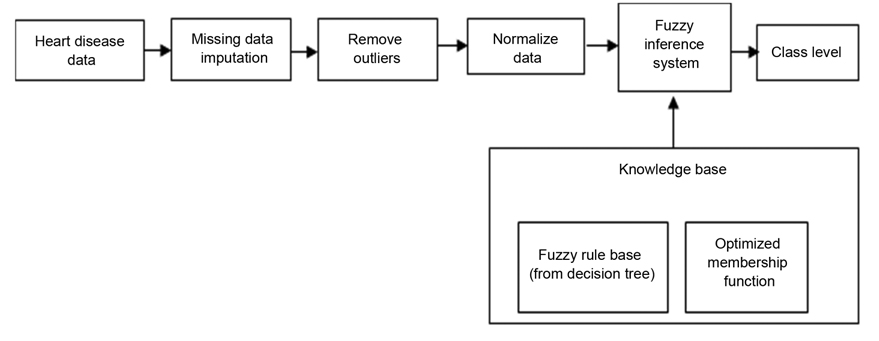
The input variables are designed based on features selected by a decision tree. The output variable is the class field in the dataset. Fuzzy membership functions are defined based on the boundary values of each branch of the decision tree. Fuzzy rules are designed based on decision tree rules, and membership functions. The proposed fuzzy expert system components are illustrated in Fig. 1. As shown in Fig. 1, after the preprocessing step, heart disease data are entered into the fuzzy inference system, and are classified. This classification and inference are based on knowledge base information.
The Sugeno fuzzy inference system was used for the proposed system. In the fuzzification process, the set of rules extracted from a decision tree is transformed into fuzzy rules. The main part of a fuzzy model is the membership function of each feature. The desired datasets have 13 features, among which just 7 features were employed that have more influence than others in decision- making. The feature selection task is performed by the decision tree. The features that are selected are: resting blood pressure (trestbps), chest pain type (cp), thal, number of major vessels colored by fluoroscopy (ca), serum cholesterol (chol), ST depression induced by exercise relative to rest (oldpeak), and maximum heart rate achieved (thalach).
With the normalization step, the intervals of all data were changed to between [0,1]. The output variable refers to the presence of heart disease in the patient. It has two values (0 and 1), which stand for health and heart disease status.
>
A. Membership Function Optimization
Designing fuzzy membership functions and fuzzy rules are very important phases in a fuzzy model, because they directly impact system performance. To optimize membership functions, an intelligent method is proposed that uses evolutionary algorithms, namely the imperialist competitive algorithm and particle swarm optimization.
In contrast with most optimization algorithms, such as PSO, genetic algorithms, and the ant colony algorithm, which are each inspired by natural processes, ICA is the first algorithm that is inspired by a social-political behavior, that of imperialism.
The ICA was proposed in 2007, and like other evolutionary algorithms, starts with an initial population. Population individuals, called countries, are of two types: colonies and imperialists, which together form empires [10]. The competition among these empires forms the basis of the ICA. During this competition, weak empires collapse, and powerful ones take possession of their colonies. The algorithm continues, until just one empire remains.
In addition to the ICA, PSO algorithm also refers to a relatively new family of evolutionary algorithms, and is inspired by the social behavior of certain animals, such as flocking birds, schools of fish, swarms of bees, and even human behavior.
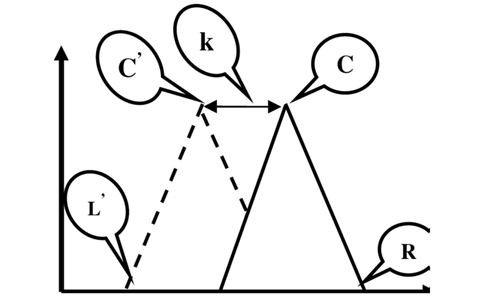
There are three parameters for each triangular fuzzy membership function. Fig. 2 shows the membership parameters: C (center), L (left), and R (right) correspond to the original membership function, where C', L', and R' refer to the center, left, and right of the adjusted membership function, respectively.
The following equations are defined to adjust the membership functions:
where,
Fig. 3 illustrates a step-by-step flowchart of the proposed approach.
The proposed fuzzy system is designed using MATLAB 7.12. The designed fuzzy system has 11 rules, and the average length of 4.
A 10-fold cross validation method was used to determine the training and test sets. Each time, 1/10 of the data was the test data, and the others were used for training. The test data had 59 instances out of 597 instances, i.e., about 1/10 of all instances. The proposed fuzzy system was evaluated using the test sets, and its performance was given as a confusion matrix (CM).
True positive (TP): Number of instances in which the classifier detects them as positive, and the detection is true.
True negative (TN): Number of instances in which the classifier detects them as negative, and the instances don't belong to the positive class.
False negative (FN): Number of instances in which the classifier doesn't detect them, but they are positive.
False positive (FP): Number of instances in which the classifier detects them as positive, but they are not positive.
Using the confusion matrix, five evaluation measures, accuracy, sensitivity (recall), specificity, precision, and Fmeasure were evaluated, as follows:
The accuracy determines the number of samples that were evaluated correctly. Sensitivity specifies the number of positive samples that were correctly classified. Specificity specifies the number of negative samples that were correctly classified.
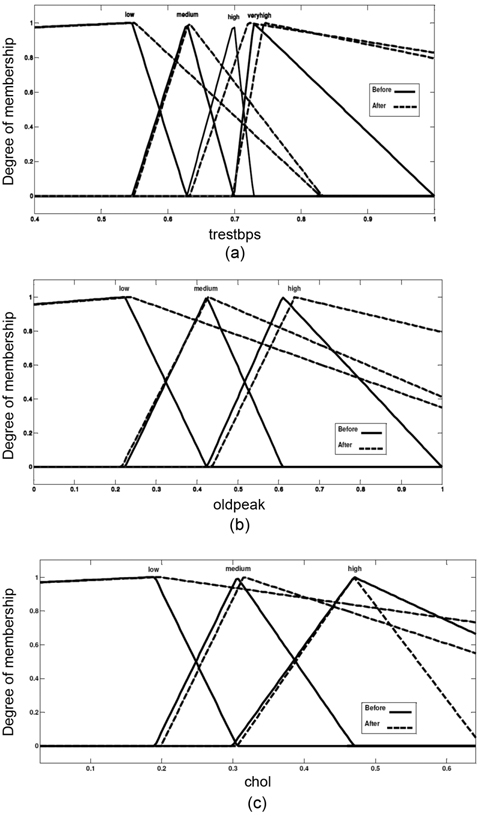
The membership functions of attributes trestbps, oldpeak, and cholesterol are shown in (Fig. 4), before and after adjusting the membership functions.
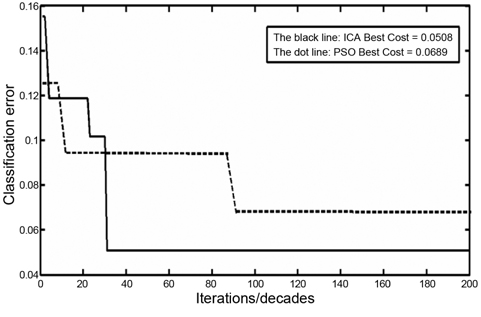
The classification errors for ICA and PSO are illustrated in Fig. 5. The black line shows the classification error that is converted in about the 30th decade. The dotted line shows the classification error using the PSO algorithm. The convergence in PSO occurs later, than in ICA. As shown, the convergence is fixed in the 90th iteration. This proves that in adjusting the membership function problem, the speed of convergence of the ICA is better than that of the PSO algorithm.
From the viewpoint of performance, the ICA has 94.92% classification accuracy, and PSO has 93.11% classification accuracy. The comparison between ICA and PSO in this problem shows that the accuracy of classification using ICA is more than that of PSO; moreover, the convergence in ICA occurs earlier than in PSO.
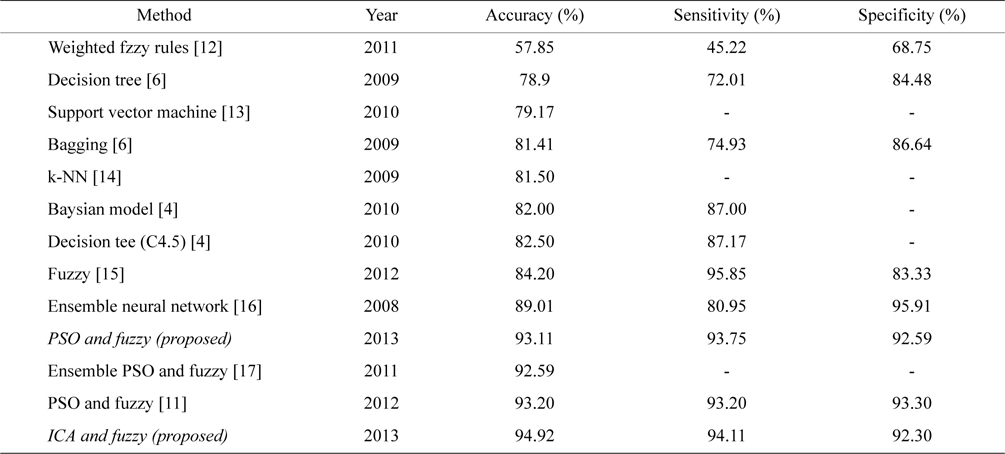
Table 1 illustrates a comparison between the measured parameters for the CAD data set. Table 2 presents a comparison between the proposed system, and other systems that have worked on the CAD problem.
[Table 1.] Comparison parameters for the CAD dataset (unit: %)

Comparison parameters for the CAD dataset (unit: %)
[Table 2.] Comparison of the proposed method with similar works

Comparison of the proposed method with similar works
V. CONCLUSION AND FUTURE WORKS
Diagnosis of coronary artery disease has been performed by computer-aided techniques in recent decades. Although these techniques had an acceptable classification error, they do not have the ability for interpretation. This paper proposed a system with the ability for interpretation. In the proposed method, classification accuracy is 94.92%. The proposed system for the first time uses an ICA to diagnose CAD. A fuzzy expert system and decision tree are employed to obtain valid rules from data. The ICA is used to adjust fuzzy membership functions.
Generally, this paper presented the following tasks:
A hybrid method was proposed for rule learning, using the membership functions based on the ICA and fuzzy set: the system adjusted the fuzzy membership functions using the ICA, and applied them to the fuzzy model. With such a new fuzzy model, we have a different classification error.A method was proposed with an acceptable performance, in comparison with other interpretable methods: interpretability is an important factor in medical systems. The proposed system presented this ability by 11 rules, with average length of 4. Results showed that the highest accuracy and sensitivity was obtained with such a number of rules and average length.The superiority of ICA in comparison with PSO was proven, from the viewpoint of performance and convergence: the diagram in Fig. 5 shows the superiority of the ICA, in comparison with PSO. ICA convergence occured in the 30th decade, while PSO achieved it in the 90th iteration. Moreover, the classification error by the ICA was far less, than by PSO.
The admissible results indicate that using an evolutionary algorithm and a fuzzy expert system would be efficient in problems of the diagnosis of disease.
Future works will focus on filling the missing values with intelligence methods. This leads to higher classification accuracy. Determining membership functions is a time-consuming process, and was performed manually in the proposed system. To reduce the errors that are caused by manual definition, we could define an intelligent procedure to automatically determine the membership functions. This could increase the classification accuracy.

![Triangular fuzzy membership function parameters. Adapted from [11].](http://oak.go.kr/repository/journal/13281/E1EIKI_2014_v8n2_87_f002.jpg)