As an important statistical analysis tool, the regression analysis model is often utilized to describe the statistical functional relationship between a response variable and a set of explanatory variables, so that the response variable can be predicted accordingly. The traditional regression model is anchored on binary logic. The sampling data used in traditional regression analysis has some strict assumptions: every observation is independent of others, the sampling data has a certain probability distribution, and so on. In actual practice, however, the description of the observations is often vague, and the data are often influenced by subjective judgment, or described in linguistic terms.
In recent years, fuzzy logic has become more widely used in statistical analysis. In their pioneering work, Tanaka et al. [1] employed fuzzy input data to establish a fuzzy regression analysis model. From then on the fuzzy regression model and its applications have attracted considerable attention from many fields, such as engineering, economics, management science, and environmental science. In the traditional regression model, the deviation between the experimental data and the model is interpreted as arising from the error of observation, but the fuzzy regression model views this kind of error as fuzziness of the structure in the system and the regression parameters.
Compared with the traditional regression model, the fuzzy linear regression model is inferior to the traditional linear regression model in terms of predictive capability, whereas their comparative descriptive performance depends on various factors associated with the data set and proper specificity of the model, especially for large sample data [2]. However, fuzzy linear regression performance becomes relatively better, as the size of the data set diminishes, and the aptness of the regression model deteriorates. Fuzzy linear regression may be used as an alternative to traditional linear regression in estimating regression parameters when the data is insufficient. Existing fuzzy regression models are mainly based on triangular fuzzy number, or trapezoidal fuzzy number. However, due to the nonlinear and complex nature of the relationship among variables in the system, the estimated effect of these fuzzy regression models needs to be further improved.
Following Tanaka et al. [1], many scholars have proposed all kinds of approaches to solve fuzzy regression model. There are two kinds of approaches to solving a fuzzy regression model. 1) The interval regression method: minimize the total spread of the fuzzy parameters, with the constraint that the membership of the estimate is not less than a predefined value [3-5]. This method essentially transforms a fuzzy regression problem into an optimization problem. 2) The fuzzy least square method: minimize the total square of the distances between the observation and estimated values of the response variables, and induce some equations similar to the normal equations of traditional regression analysis to obtain the fuzzy parameters [6-11].
Besides the above-mentioned two kinds of approaches, there are some other types of approaches to solve a fuzzy regression model. For example, the Monte Carlo method can be applied to the fuzzy regression model to obtain the optimal solution within a predetermined error bound [12, 13]. As a new classification technique proposed by Vapnik [14], the support vector machine (SVM) has been successful in solving pattern recognition and function estimation problems. Hong and Hwang [15] studied the convex optimization problem of a multi-fuzzy linear regression model via SVM. Hao and Chiang [16] employed fuzzy set theory to SVM in which the parameters, such as the components within the weight vector and the bias term, were set to be fuzzy numbers. By using different kernel functions, their method can achieve automatic accuracy control in the fuzzy regression analysis task. Assigning fuzzy membership values to data samples, Khemchandani et al. [17] proposed an approach to fuzzy support vector regression for financial time series forecasting. Wu and Law [18] proposed a new fuzzy SVM with the ability to penalize Gaussian noises in triangular fuzzy number space. Lin and Pai [19] employed support vector regressions to calculate fuzzy upper and lower bounds, to formulate a fuzzy SVM model for forecasting the indices of business cycles.
Previous fuzzy regression models find difficulty in dealing with input data varying with a covariate. Shen et al. [20] proposed a fuzzy varying coefficient model, where the fuzzy coefficients are allowed to vary with a covariate. The fuzzy varying coefficient regression model is an extension of the fuzzy linear regression model. Their method can improve the feasibility and adaptability of the fuzzy linear model. The procedure of their approach includes the following two steps: 1) After the fuzzy varying coefficient regression model is given, the proper kernel function is selected based on the distance of fuzzy numbers, and the cross-validation method is utilized to determine smooth parameters. 2) According to the definition of the distance between fuzzy numbers, the objective function is determined, and the estimate of response variables is obtained by the least squares method.
From the viewpoint of robust analysis, the least square method above is not robust enough, that is, when data contains individual abnormal data called outliers, the least squares estimate will not be reliable, and in the worst case, the conclusion may be incorrect. Therefore, Watada and Yabuuchi [21] suggested that we should remove the irregular data or outliers, before constructing the fuzzy regression model. Combined with robust analysis, the fuzzy regression model will be free from the influence of outliers. In this article, we integrate the fuzzy varying coefficient regression model with robust analysis to improve the feasibility and effectiveness of the fuzzy regression model.
The rest of the paper is organized as follows. Section Ⅱ illustrates the fuzzy varying coefficients regression model with its fuzzy regression coefficients estimation. Section Ⅲ introduces the notion of goodness of fit (GOF) for evaluating the model and the distance of fuzzy numbers, and employed them for robust analysis. In Section Ⅳ, a numerical example is used to demonstrate the effectiveness of the proposed methodology. Finally, the conclusions in this work are summarized in Section Ⅴ.
Ⅱ. FUZZY VARYING COEFFICIENT REGRESSION MODEL
>
A. Distance of Gaussian Fuzzy Numbers
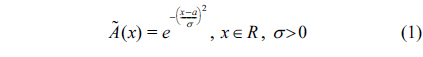
Definition 1.
where, α, σ is the center and spread of
Let
Proposition 1.
1)
2)
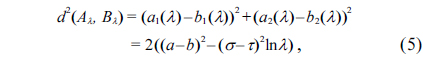
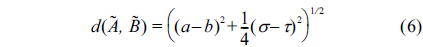
In order to characterize the nearness degree of Gaussian fuzzy numbers
In this article, we set
>
B. Fuzzy Varying Coefficient Regression Model
In order to describe the dynamic relationship between the response variable and a set of explanatory variables, Shen et al. [20] proposed a fuzzy varying coefficient regression model with its estimation. The procedure includes three steps as follows.
Step 1: Construct the fuzzy varying coefficient regression model.Step 2: Determine the optimal value of smooth parameters by using the fuzzy cross-validation method.Step 3: According to the distance of fuzzy numbers, determine the objective function and obtain the estimate of response variables by the restricted least squares method.
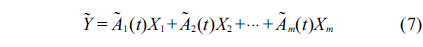
The fuzzy varying coefficient regression model proposed by Shen et al. [20] is formulated as follows:
where,
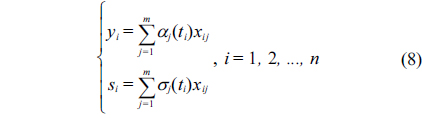
Suppose that there are the experimental data set of the response variable
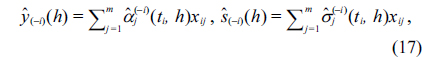
Therefore, the sample form of the model Eq. (7) is
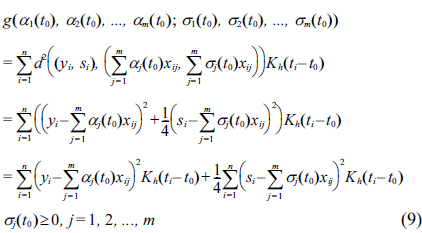
Now we should estimate the fuzzy regression coefficient
where,
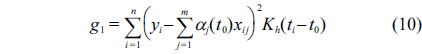
The restricted weighted least-squares problem above is equivalent to minimizing two formulas as follows:
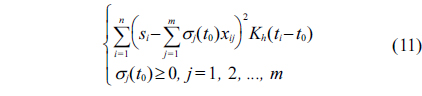
and
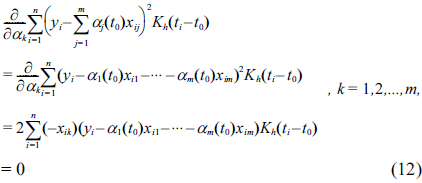
In order to minimize Eq. (10), we set to zero the partial derivatives of
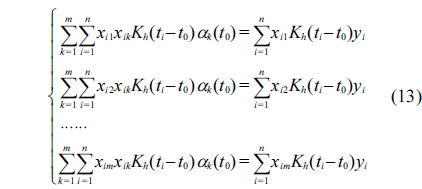
The equations above are equivalent to the following equations:
Let
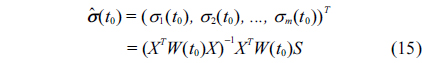
Assuming that the inverse of
Similarly, the estimation of σ(
Considering the positive restriction of the spread, Shen et al. [20] suggested that we utilize the method proposed by D'Urso et al. [24].
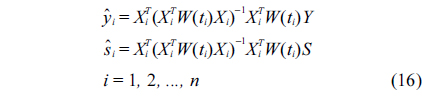
Let
>
C. Determination of the Smoothing Parameter
The role of the smoothing parameter
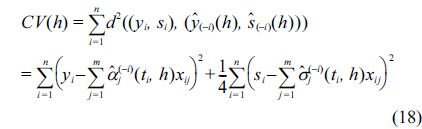
The cross-validation (CV) score is formulated as follows:
Then, we will select
There are two main advantages to using the fuzzy varying coefficient regression model: 1) Because the fuzzy regression coefficients may vary with another explanatory variable, the flexibility and adaptability of the fuzzy regression model are enhanced. 2) The model can deal with data that vary with a time variable, and establish a dynamic relationship between a response variable and a set of explanatory variables.
Ⅲ. ROBUST ANALYSIS AND GOF OF GAUSSIAN FUZZY NUMBERS
From the robustness point of view, the least square method is not robust, that is, when data contains an individual abnormal value or outliers, the least square estimate will not be reliable and a wrong conclusion may even be drawn. Therefore, diagnostic checks should be done on data, before applying the least square method.
Definition 2.
The least square estimator is sensitive to outliers. Therefore, the estimation results are directly affected by each observation, and the data should be analyzed in detail. Sometimes, even a single observation may dramatically influence the value of the parameter estimates, and omitting this observation from the data may lead to totally different results. To handle the outlier problem, Hung and Yang [25] proposed an omission approach for Tanaka's linear programming method. This approach has the capability to examine the behavior of value changes in the objective function of fuzzy regression models, when observations are omitted. On the basis of the Least Median Squares-Weighted Least Squares estimation procedure, D'Urso et al. [24] proposed a robust fuzzy linear regression model to deal with data contaminated by outliers. To overcome the higher order or interactive terms, and the influence of outliers existing in the manufacturing process data, Chan et al. [26] integrated genetic programming with the fuzzy regression model.
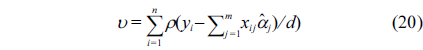
Next, we introduce the M estimation methods introduced by Huber [27], which are widely used for robust regression. M estimation can be regarded as a generalization of maximum-likelihood estimation. The general M estimator minimizes the following objective function
where, the function
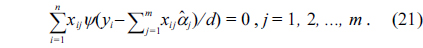
By setting to zero the partial derivative of
where, ψ(z) =
In this article, we will integrate robustness analysis with the fuzzy varying coefficient regression model. The main procedure is as follows:
Step 1: Utilize the robustfit function of Matlab toolbox to perform robust analysis and remove the outliers, according to the result of the robustness analysis.Step 2: Construct a fuzzy varying coefficient regression model and use the fuzzy cross-validation method to determine the optimal value of the smoothing parameter.Step 3: Determine the objective function according to the definition of distance Eq. (6), and solve the least squares problem for the parameter estimation of response variables.Step 4: Evaluate our approach, by comparing it with Shen et al.'s approach [20] according to AGOF, which will be introduced in Subsection Ⅲ-B.
>
B. GOF of Gaussian Fuzzy Numbers
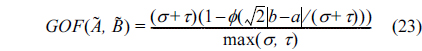
In order to evaluate the fit performance of our approach, we next introduce an index named GOF for describing the nearness and overlap of two Gaussian fuzzy numbers. For two Gaussian fuzzy numbers
We utilize the proportion of the shadow area to the maximum of the area shaped by
Definition 3.
where,
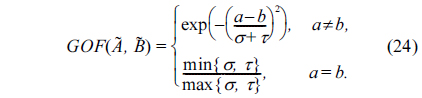
For simplicity of calculation, we define another GOF for
Definition 4.
In Section Ⅳ, for the purpose of evaluating the performance of our approach, we will use AGOF (average of all GOF for the observations with their estimates) to compare our approach with the approach proposed by Shen et al. [20].
Gross domestic product (GDP) is the market value of all officially recognized final goods and services produced within a country in a given period. In economics, GDP is a sum of consumption, investment, government spending, and exports. In this article, we think that the dominant explanatory variables to determine GDP are the total amount of urban and rural savings deposit, the total financial expenditure, fixed assets investment, and sum of imports and exports, which are denoted by
The dataset shown in Table 1 consists of 29 observations of the total amount of urban and rural savings deposit, the total financial expenditure, fixed assets investment, sum of imports and exports, and GDP of China from 1981 to 2009, in which the GDP is assumed to be a Gaussian fuzzy number.
[Table 1.] Observations of gross domestic product (GDP) from 1981 to 2009 (unit: CNY 10,000)
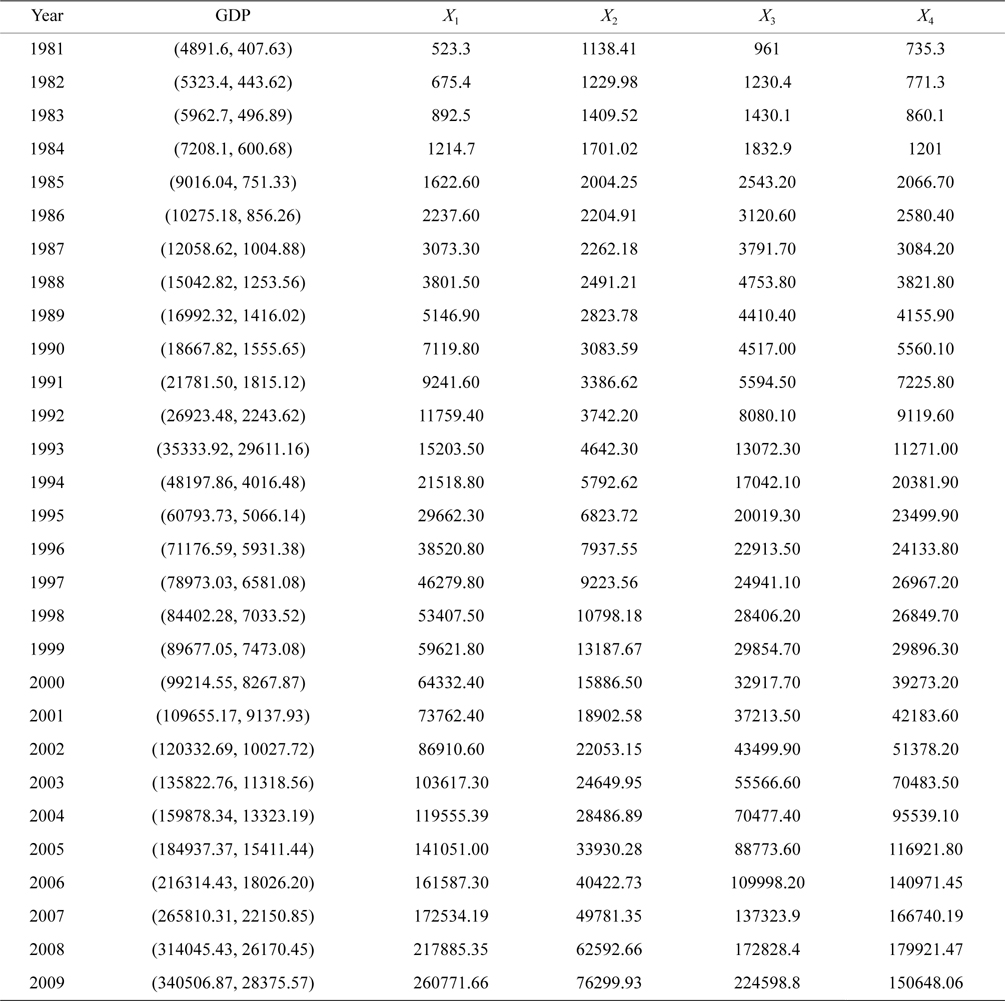
Observations of gross domestic product (GDP) from 1981 to 2009 (unit: CNY 10,000)
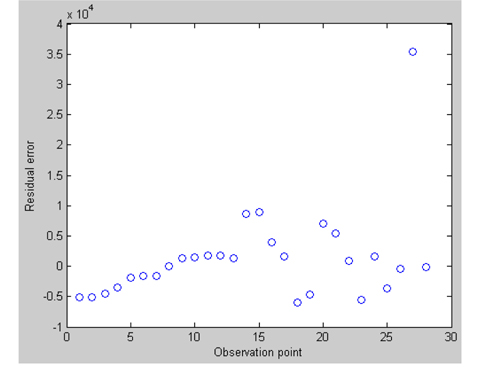
First, we utilize the robustfit function in Matlab to analyze the robustness of this dataset; the diagram of residual errors is given in Fig. 1.
The residual of the 27th observation is 3.54 × 10⁴, which is obviously much larger than that of the other observations, so we think it is an outlier and should be removed. Next we will construct the fuzzy varying coef-ficient regression model after removing the 27th observation, and estimate the parameters.
Next, we set the variable
With the selected optimal value of
[Table 2.] Comparison between the observations and estimates of GDP (unit: CNY 10,000)
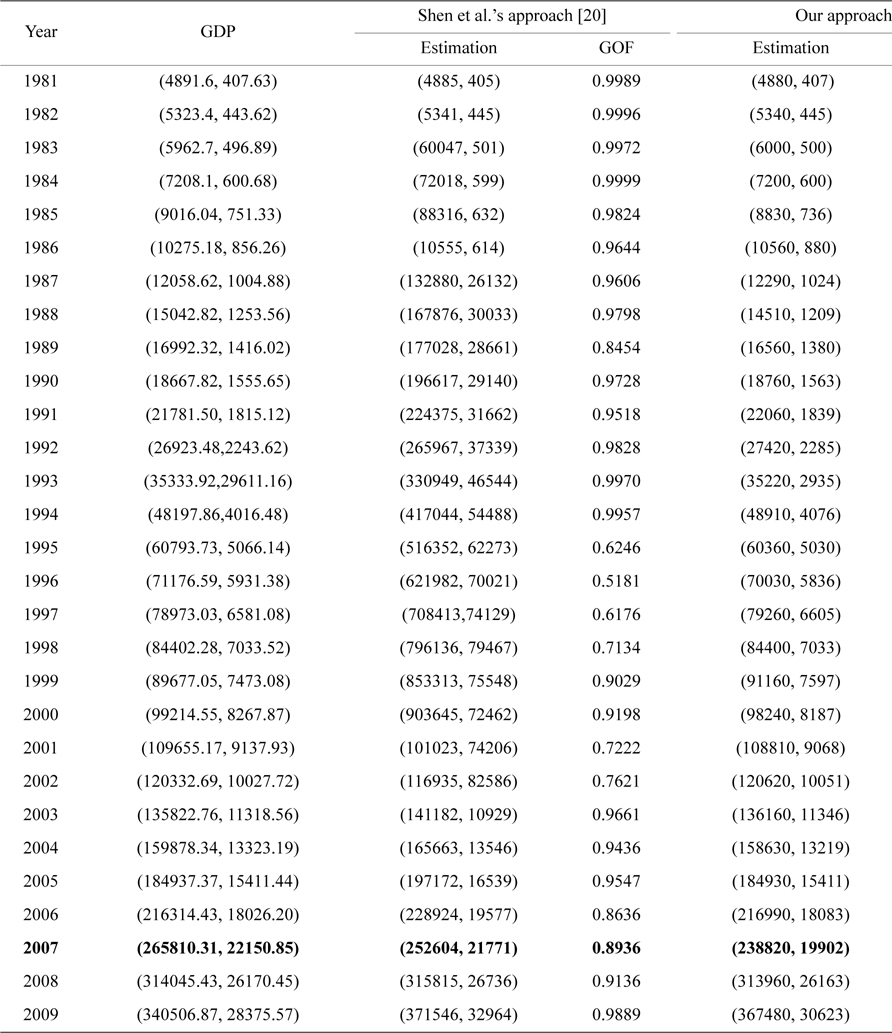
Comparison between the observations and estimates of GDP (unit: CNY 10,000)
For comparison, the fit values of Shen et al.'s method and our method are shown in the third and fifth column in Table 2, respectively, with their GOF shown in the fourth and sixth column, respectively. As is noticed, the AGOF of Shen et al.'s method is 0.8943, while the AGOF of our method is 0.9934. The larger value of AGOF for our method demonstrates that the fit performance of our approach is better than the approach proposed by Shen et al. [20].
The aim of our study is to propose a methodology for dealing with the dynamic fuzzy function relationships between the response variable and a set of explanatory variables, while simultaneously avoiding the impact of outliers in the dataset. Our methodology can improve the feasibility and effectiveness of the fuzzy regression model. Specifically, the contribution of this work can be summarized in two points. First, it has provided a dynamic model to deal with the data varying with a covariate, especially for the sampling data having approximately a Gaussian contribution. Second, with the help of robust analysis, the proposed model is free from the irregular data or outliers, after removing the outliers. From the robustness standpoint, a suitable index for characterizing the outliers needs to be studied to improve the robustness of the fuzzy regression model in future work.