Inspection of the retinal blood vessels can reveal early stages of hypertension, diabetes, arteriosclerosis, cardiovascular disease, and stroke [1]. It allows the patients to take action while the disease is still in its early stages. One nontrivial task in the diagnosis of retinopathy is the segmentation of retinal blood vessels [2]. However, since the vascular network is complex and the number of images is large, the manual segmentation of retinal blood vessels can become a time-consuming process that entails training and skill. An automated segmentation method provides consistency and accuracy, and reduces the time taken by a physician or a skilled technician for hand mapping. Therefore, an automated reliable method for vessel segmentation would provide valuable computer-assisted diagnosis for ophthalmic disorders.
Feature characterization and extraction in retinal images is, in general, a complex task [3]. Accurate blood vessel segmentation is a difficult task for several reasons. The challenges include low contrast; the presence of noise influence, mainly due to its complex acquisition; and anatomic variability, depending on the particular patient. The variability of vessel width, brightness, and tree-like shape make the task more difficult. For example, two close vessels are often considered as one wide vessel. In contrast, a vessel with central light reflex may be misunderstood as two vessels [4]. Further challenges faced in automated vessel segmentation include the presence of low-contrast small vessels, and the appearance of a variety of structures in the image, including the optic disk, retinal boundary, lesions, and other pathologies [5].
Many methodologies for retinal vessel segmentation have been reported. Reviews and surveys of these methods can be found in [6, 7]. All these approaches for detecting retinal blood vessels can be classified into techniques based on match filtering, morphological processing, vessel tracking, pattern recognition, multiscale analysis, and model-based algorithms [8]. Matched filters for retinal vessel segmentation exploit the piecewise linear approximation, and the Gaussian-like intensity profile of retinal blood vessels [9]. Vessel segments are searched in all possible directions, using a two-dimensional matched filter. Mathematical morphology exploits the fact that the vessels are linear, connected, and their curvature varies smoothly along the crest line to highlight the vessels in the monochromatic retinal image [10]. Vessel tracking methods track the vessels, starting from a set of reliable seed points, using local information of the vessel network [11]. The multiscale approaches for vessel extraction are based on scale-space analysis, separating out information related to the blood vessels having varying width [12]. Modelbased methods utilize the vessel profile models and active contour models, and have been introduced for accurate estimation of vessel width. An example is the tramline filter proposed by Hunter et al. [13], where two parallel edges at variable distance from each other are expected to detect a vessel locally. The tramline filter consists of three parallel lines, where the inner line is aligned within a blood vessel, and the outer two lines are just on either side of the vessel; the filter gives a strong response. Thus, the tramline is more suited to the detection of vessel centerlines than to segmentation of the vessels. Similar to the tramline filter, a line detector is proposed by Ricci and Perfetti [14]. The line detector evaluates the average pixel intensity along basic lines passing through the target pixel at different orientations, and selects the line with the highest average pixel intensity, so as to detect vessels from the retinal images. The basic line detector with long lines is effective in dealing with the vessels with central reflex. But its length is fixed; when two vessels are very close, it will merge them.
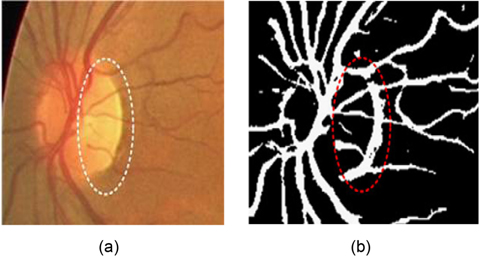
This drawback can be avoided by using the generalized multi-scale line detector proposed by Nguyen et al. [4]. They use variable lengths of aligned lines, instead of a fixed one, to achieve a multi-scale line detector. The longer length line detectors are effective in dealing with central reflex, but tend to merge close vessels, and produce false responses at vessel crossovers. The shorter length line detectors can improve these situations, but introduce background noise to results. In order to preserve the strength and overcome the drawback of each individual line detector, Nguyen et al. [4] assign the same weight for each line detector with different length, and linearly combine all line responses at different scales to get the vessel responses. Clearly, the contributions of line responses at different scales to final segmentation are not equal. The longer length line detectors can get more vessel responses than the shorter ones. Simple assignment of the same weight for each scale to combine all the line responses will introduce much background noise to final segmentation. Nguyen et al.’s multiscale line detector gives false responses around the optic disk and pathological regions, such as dark and bright lesions. An example is illustrated in Fig. 1.
To overcome the drawbacks mentioned above, this paper proposes an effective retinal blood vessel segmentation methodology. Exploiting the properties of piecewise linearity and connectedness of the retinal vessel, we have introduced multi-director morphological filters with rotating structuring elements to enhance the vessels in the ocular fundus image. Later, an improved multiscale line detector is proposed to produce the vessels response. Our method is quantitatively and qualitatively evaluated using two publicly available data sets, DRIVE [15] and STARE [16]. In comparison with Nguyen's multiscale line detection method and the basic line detection, the algorithm attains excellent performance. Receiver operating characteristic (ROC) analysis is also used on the three detectors. From the area under the ROC curve and the accuracy, we can see that our approach works extremely well, while approximating the average accuracy of a human observer without a significant degradation in sensitivity and specificity.
The rest of the paper is organized as follows. Section Ⅱ is the preliminary knowledge about line detection; two line detectors for retinal vessel segmentation are briefly mentioned. In Section Ⅲ, we illustrate our proposed methodology in detail. Experimental results on the images of the DRIVE and STARE databases are presented in Sec-tion Ⅳ. Finally, Section Ⅴ presents the conclusion of this paper.
Multiscale line detection proposed by [4] is built upon the basic line detector, which is first used as a means for vessel-background classification by [14]. In this section, we first review the basic line detector, and then introduce multiscale line detection, which linearly combines all line responses at varying scales to produce the final segmentation for a retinal image.
The retinal vasculature appears as piecewise linear features with variation in width and their tributaries visible within the retinal image. The basic line detector employs the morphological attributes of retinal blood vessels to produce vessel responses. It works on the inverted green channel of original RGB images, where the vessels appear brighter than the background. First, a square sub window of size
where, the window size
The basic line detector principle is that if the target pixel belongs to the vessel, then the line response will be large due to alignment of the candidate line along the direction of the vessel. In contrast, the line response is low for a background pixel, because the difference between the pixel intensity of the candidate line and square sub-window is small. In this basic line detector, the window size is chosen in such a way that if the square sub-window is placed on the image, and the center of this window corresponds to the center of the vessel, then this window contains approximately the same number of vessel and background pixels. Therefore, it is often set as twice the typical vessel width in retinal images. For example, it has been shown that
The basic line detector has been shown to be effective when dealing with vessels with central light reflex. However, there are three drawbacks of using it in vessel detection: 1) it tends to merge close vessels; 2) it produces an extension at crossover points; and 3) it produces false vessel responses at background pixels near strong vessels (vessels with high intensity values in images where vessels appear brighter than the background).
>
B. Multiscale Line Detection
To overcome the three drawbacks of the basic line detector mentioned above, Nguyen et al. [4] proposed a generalized multiscale line detector, which uses a variable length of aligned lines in spatial scale. The generalized multiscale line detector is defined as [4]:
where, 1 ≤ L ≤ W, and are defined as in Eq. (1). By changing the values of
In multiscale line detectors, the line responses at different scales are different. The longer length line detector can detect large diameter blood vessels, and be able to deal with central reflex, because the candidate line includes only a small number of central reflex pixels, which would not have been much affected, so the central reflex pixels have a high vessel response. The shorter length line detector detects close vessels more effectively.
In order to maintain the strength and eliminate the drawback of each individual line detector, the final vessel responses are obtained by the linear combination of line responses computed by using line detectors at different scales. The response at each image pixel is defined as:
where is the number of scales used, is the response of the line detector with line length
Our proposed methodology for retinal blood vessel segmentation comprises of 4 consecutive stages: 1) image preprocessing for background homogenization and the removal of noise; 2) vessel enhancement using multidirector morphological filters with linear structuring elements; 3) improved multiscale line detection for getting vessel response; and 4) post-processing for removing artifacts. Note that when the RGB components of the colored retinal images are visualized separately, the green channel shows the best vessel/background contrast; whereas the red and blue channels show low contrast and are very noisy [15]. Therefore, the green channel is used for processing by our method.
Independently from the component derived from the original color retinal images, our proposed segmentation method works on the inverted green channel (
Our multiscale line detection responds strongly to high contrast edges. It may lead to false detection around the borders of the camera's aperture. In order to reduce this effect, an iterative algorithm developed by [17] is used to remove the strong contrast between the retinal fundus and the region outside the camera’s field of view (FOV). The result of the iterative process is illustrated in Fig. 3(b).
Retinal images often contain background intensity variation, since the illumination is reduced, while the distance to the optic disk is increased. Consequently, background pixels may have different intensity for the same image. We can see this in Fig. 3(a), where the intensity values of some background pixels are comparable to that of brighter vessel pixels. This makes it difficult to segment retinal vessels. With the purpose of removing these background lighting variations, a background homogenization method proposed by [18] is described, as follows.
First, a 3 × 3 mean filter is applied to smooth occasional salt-and-pepper noise. Then, the resultant image is convolved with a Gaussian kernel of dimensions
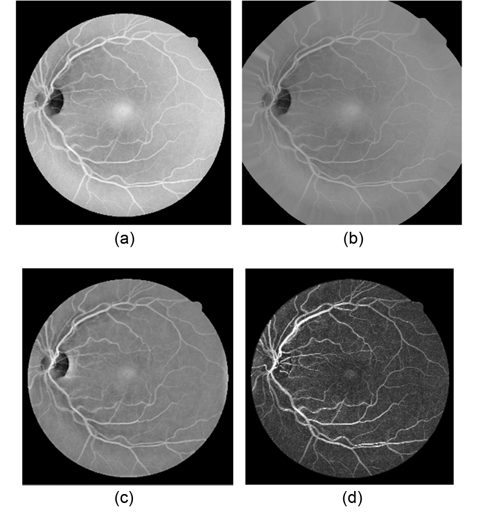
The purposes of vessel enhancement are to eliminate the influence of the optic disk and to increase vascular contrast from the background of the retinal image. In our segmentation method, morphological operators with directional structuring elements are applied to enhance the vessel contrast in the homogenized image
The retinal vessels appear as linear bright shapes in the monochromatic image
where
where
>
C. Improved Multiscale Line Detection
In this section, we propose an improved multiscale line detection, to obtain the final vessel measure from the enhanced retinal vessels. In Nguyen et al.'s multiscale line detectors, different line detectors have different line responses. The line detector with longer lines can successfully recognize central reflex pixels as vessel pixels, because the candidate line includes only a small number of central reflex pixels; hence the average intensity of pixels in the candidate line is not much affected, and the central reflex pixels have a high vessel-ness measure. The shorter length line detectors detect close vessels more effectively, but introduce background noise into the image.
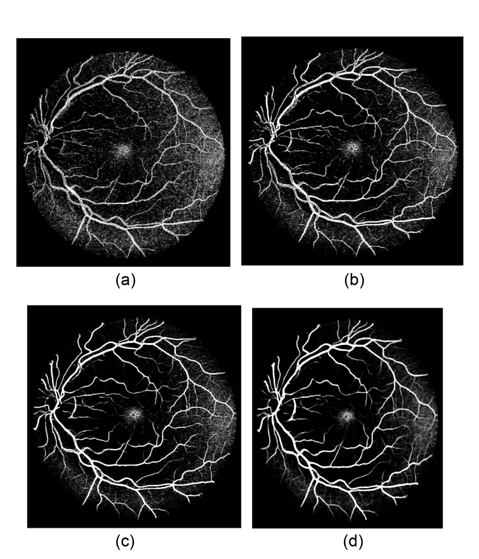
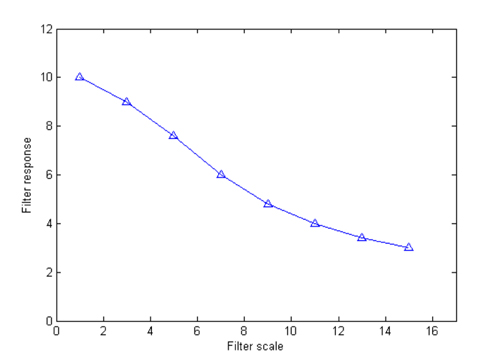
Fig. 4 illustrates the vessel responses using line detectors at different scales. Here we can see that the longer length line detectors produce more vessel responses. Although the shorter length line detectors can provide more vessel details, they are sensitive to noise. The variances of line responses at different scales to image noise are depicted in Fig. 5, which demonstrates that the smaller scale filters produce higher noise responses. In order to maintain the strength and eliminate the drawback of each individual line detector, line responses at different scales are linearly combined to produce the segmentation for each retinal image. We assign different weights for each scale, and the response at each image pixel is defined as:
where
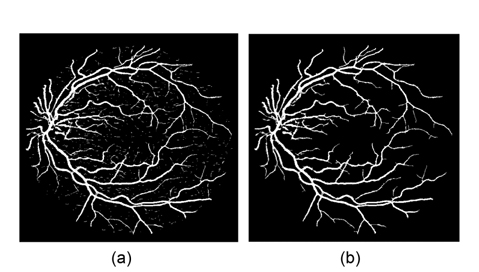
The combined line response image is a soft classification, where each value represents the probability of each pixel of belonging to the vessel class. A single threshold is enough to segment the soft classification, and produce a binary segmentation (Fig. 6(a)). There are many small isolated regions misclassified by threshold segmentation as blood vessel pixels. To improve segmentation performance, the removal of falsely detected isolated vessel pixels is processed. In order to remove these artifacts, the pixel area in each connected region is measured. In artifact removal, each region connected to an area below 25 is reclassified as non-vessels. An example of the final vessel segmented image after this further processing stage is shown in Fig. 6(b).
We evaluated our retinal vessel segmentation methods on two publicly available data sets. Both the DRIVE database and the STARE database have been widely used by researchers to test their vessel segmentation methodologies, since they provide manual segmentations for performance evaluation.
The DRIVE database [15] contains 40 color fundus images, which have been divided into a test set and a training set, both containing 20 images. Each of the twenty training images has been carefully labeled by an expert, by hand, to produce ground truth vessel segmentation. For the test cases, two manual segmentations are available; one is used as a gold standard, and the other can be used to compare computer generated segmentations with those of an independent human observer. The images were acquired using a Canon CR5 non-mydriatic 3CCD camera with a 45° FOV. Each image was captured using 8 bits per color plane at 768 by 584 pixels. The FOV of each image is circular with a diameter of approximately 540 pixels. For this database, the images have been cropped around the FOV. For each image, a mask image is provided that delineates the FOV
The STARE database [16] contains 20 colored retinal images, with 700 × 605 pixels and 8 bits per RGB channel, captured by a TopCon TRV-50 camera at a 35° FOV. Two manual segmentations by Hoover and Kouznetsova [16] are available. The first observer marked 10.4% of the pixels as vessel, the second one 14.9%. The performance is computed with the segmentations of the first observer as a ground truth. The comparison of the second human observer with the ground truth images gives a detection performance measure, which is regarded as a target performance level.
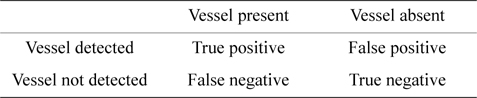
In order to quantify the algorithmic performance of the proposed method on a fundus image, the resulting segmentation is compared to its corresponding ground truth image. Any pixel that is identified as a vessel in both the ground truth and the segmented image is marked as a true positive (TP). Any pixel that is marked as a vessel in the segmented image, but not in the ground truth image, is counted as a false positive (FP), as illustrated in Table 1.
[Table 1.] Vessel classification

Vessel classification
In this paper, our algorithm is evaluated in terms of sensitivity, specificity, and accuracy. Sensitivity is the ability of an algorithm to detect the vessel pixels. Specificity reflects the ability to detect non-vessel pixels. The accuracy is measured by the ratio of the total number of correctly classified pixels (sum of TPs and TNs) by the number of pixels in the image FOV. Taking Table 1 into account, these metrics are defined as:
Since more than 80% of pixels in a retinal image FOV are background, the accuracy is always high, and there is only a small discrimination in the accuracy values of different methods. In this paper, a Local Accuracy is introduced as an additional measure, according to [4]. Here, only vessels and background pixels around the true vessels are evaluated for accuracy measurement. To achieve this, the ground truth segmentation image is dilated using a morphological dilation operator with a structure element of size
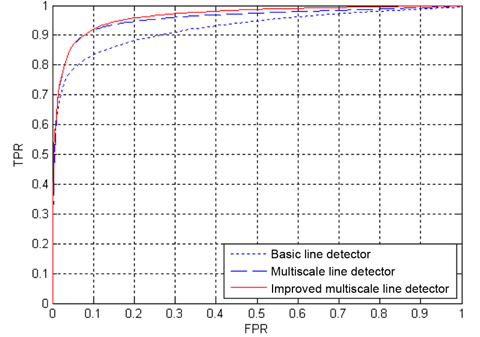
In addition, algorithm performance is also measured with ROC curves. An ROC curve plots the fraction of vessel pixels correctly classified as vessels, namely the true positive rate (TPR), versus the fraction of non-vessel pixels wrongly classified as vessels, namely the false positive rate (FPR). TPR represents the fraction of pixels correctly detected as vessel pixels. FPR is the fraction of pixels erroneously detected as vessel pixels. The area under the ROC curve (AUC) measures the ability of the classifier to correctly distinguish between vessel and nonvessel pixels. The closer the curve approaches the top-left corner, the better is the performance of the system. For both databases, TPR and FPR are computed, considering only pixels inside the FOV.
>
C. Vessel Segmentation Results
In this section we first report qualitative results that are aimed at giving a visual feeling of the quality of the retinal blood vessel tree generated by our method. We then report comparative, quantitative results, using several performance parameters and the standard ROC method. We compare our improved multiscale line detection with the other two line detectors: basic line detector of Ricci and Perfetti [14] and multiscale line detector of Nguyen et al. [4].
The parameter setting of our method on these experimental databases is simple. Since the vessel width in these images is around 7–8 pixels,
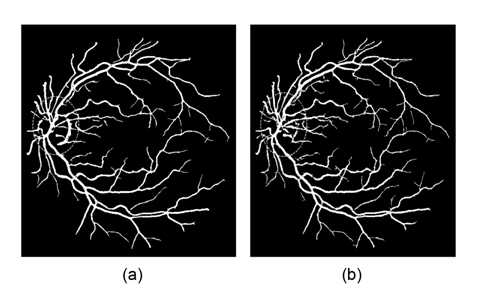
Figs. 7(a) and (b) show the segmentation results of one image in the DRIVE data set obtained by Nguyen et al.'s method and our method, respectively. Here we can see that both methods have the ability to recognize the vessels with the center of central reflex, and can segment these close vessels. Compared to Fig. 7(a), our results (Fig. 7(b)) show two improvements: 1) most of the FP results around the optic disk are detected, as shown by the green circle area; and 2) the vessel blood tree gained from our methods includes more small vessels. An explanation for these improvements is the multidirectional morphological tophat transform incorporated in our method, which enhanced the vessel, and removed the influence of the optic disk.
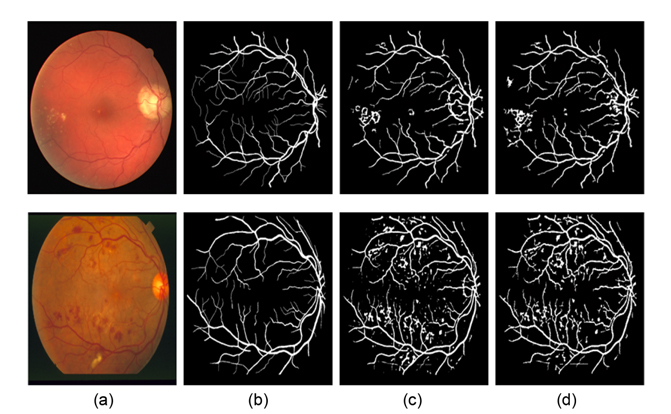
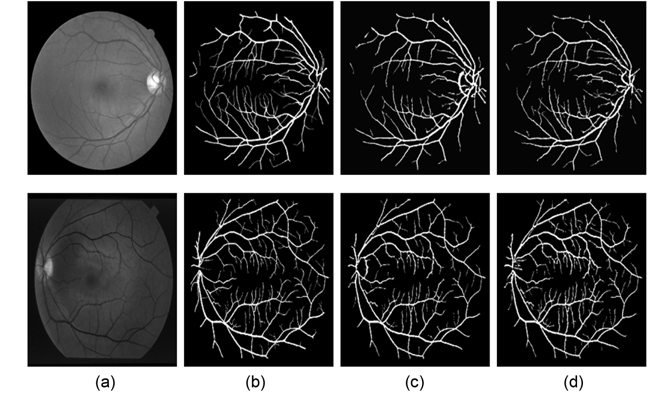
Vessel segmentation results of one image each from the DRIVE and the STARE databases are illustrated in Fig. 8. The figures illustrate the green channel of the fundus image, the manually segmented images from the first human observer, the segmented results of Nguyen et al.'s method, and the vessel tree yield from our method. Compared to the results of Nguyen et al.'s method, our vessel tree not only removes the optic disk, but also includes more small vessels. The improved multiscale line detector proposed in our method sets different weights to each line response, according to the lengths of the line detectors. The weight of the shorter line detectors is lower, so the vessel responses include less background noise, which could yield segmentation results with more vessel details, after simple post-processing.
Fig. 9 illustrates another two segmentation results of one pathological retinal image each from the DRIVE and the STARE databases. Compared to Nguyen et al.'s method, our proposed method can obtain more details of retinal vessels, even in the area of the optic disk and pathological lesions. Since the multidirectional filters can remove every isolated round and bright zone whose diameters are less than the length of the linear structuring element pixels, the influence of the optic disk and pathological lesions for vessel detection is decreased.
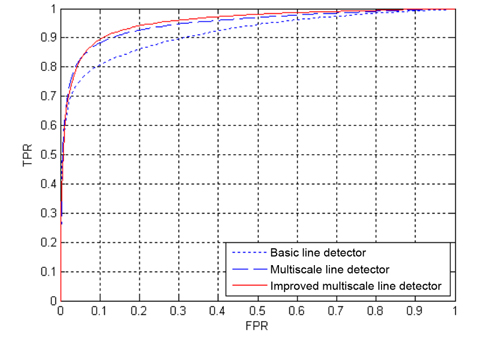
The ROC curves of the three line detection methods for the two databases are depicted in Figs. 10 and Figs. 11, where the AUC values of our proposed method are 0.9618 and 0.9576 for the DRIVE and STARE databases, respectively. The ROC curves of the basic line detector are obtained from the line detector with line length
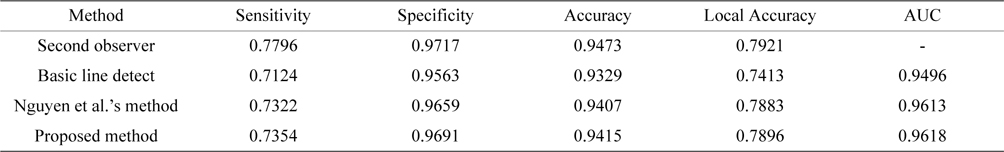
Tables 2 and Tables 3 present the average performance of the three line detectors on both DRIVE and STARE data sets. Since the segmentation results of the basic line detector are not available for comparison, we implemented the unsupervised method, denoted as individual line detection with line length
[Table 2.] DFE performance comparison of different line detector methods (DRIVE databases)

DFE performance comparison of different line detector methods (DRIVE databases)
[Table 3.] Performance comparison of different line detectors methods (STARE databases)
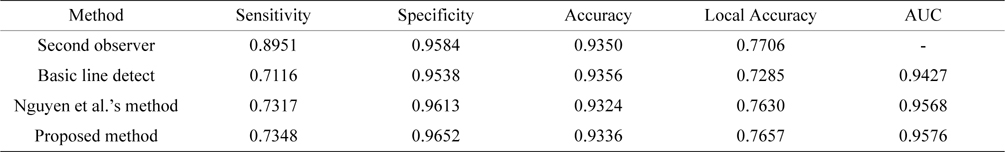
Performance comparison of different line detectors methods (STARE databases)
Our proposed method belongs to an unsupervised segmentation method, which doesn't require ground truth segmentations for training models. Statistics of the running time of the proposed method to segment a DRIVE or STARE image are implemented on a PC Intel Core i5 3.2 GHz CPU and 8 GB RAM. The method is implemented in MATLAB, and no optimization is performed. The image preprocessing phase, including vessel enhancement phase, spends 1.26 seconds on average, and the time to detect vessels by improved multiscale line detection is 2.72 seconds, so it takes 3.98 seconds on average to segment a DRIVE or STARE image, using our proposed method. Being an unsupervised method, it is effective enough, and the execution time could be reduced further by some optimization of our proposed method.
In this paper, an effective retinal blood vessel segmentation method has been proposed. A multidirectional tophat transform with rotating structuring elements was used to emphasize the vessels. The multidirectional filters have enhanced all vessels, whatever their direction, including small or tortuous vessels. Every isolated round and bright zone whose diameters were less than the length of the linear structuring element pixels have been removed, so the influence of the optic disk and pathological lesions for vessel detection have been decreased. Then, an improved multiscale line detector was proposed to yield vessel responses. Setting different weights to different scale line detectors, our improved multiscale line detector included less background noise into the line responses, which could yield segmentation results with more small vessels. Experimental results have shown that our method can segment these close vessels, and has the ability to deal with these centers of central reflex vessels. Being an unsupervised method, our method has produced comparable accuracy. The demonstrated effectiveness and robustness, together with its simplicity, make the proposed blood vessel segmentation method a suitable tool for being integrated into a computer-assisted diagnostic system for ophthalmic disorders. The majority of the vessels that have not been segmented effectively are those around pathological lesions. To segment those vessels is the subject of ongoing work.

![False vessel detection around the optic disk in Nguyen et al. [4]'s multiscale line detector: (a) original image and (b) segmented image. Adapted from Nguyen et al. [4] with permission.](http://oak.go.kr/repository/journal/13271/E1EIKI_2014_v8n2_119_f001.jpg)
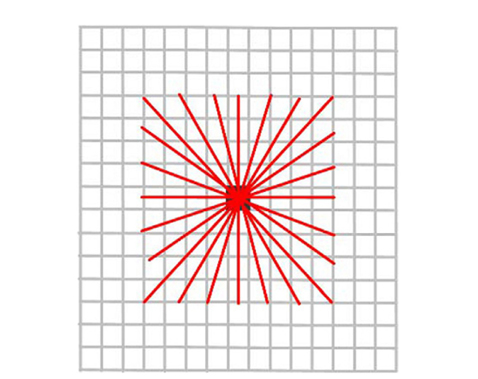
![A generalized line detector with W = 15 and L = 9. Adapted from Nguyen et al. [4] with permission.](http://oak.go.kr/repository/journal/13271/E1EIKI_2014_v8n2_119_f002.jpg)