Olive flounder Paralichthys olivaceus is one of the most important fishery and aquaculture species with a selective breeding program in Korea. Stock-enhancement programs for olive flounder have been carried out for several years, and hatchery-reared offspring are released into the wild as a way to increase the biomass of depleted fishery stocks. To ensure responsible stock-enhancement programs, the genetic diversity of both wild populations and hatchery strains should be scrutinized using molecular markers. The Genetic and Breeding Research Center (Geoje, Korea) runs a breeding program to increase olive flounder aquaculture production, and a family characterized by fast growth and disease resistance has been created. Traits such as weight, shape, and disease are controlled by more than one locus (O’Connel and Wright, 1997). The development of a genetic linkage map is a prerequisite for mapping quantitative trait loci and for marker-assisted selection (Cho et al., 1994).
Because microsatellite markers have high levels of polymorphism, co-dominant inheritance, genome-wide distribution, and high reproducibility, they are the most popular and powerful molecular markers in population genetics and can be used to construct genetic linkage maps (Liu and Cordes, 2004). In recent years, microsatellite markers have become one of the most commonly used molecular markers in population and evolutionary biology research, and are applied widely in studies of biological breeding, genetic linkage maps, genetic diversity, and phylogeny (Goldstein and Pollock, 1997). Seventy-nine microsatellite markers have been developed previously for P. olivaceus (Kim et al., 2003, 2009). However, further P. olivaceus polymorphic microsatellite markers are required to facilitate genome-mapping studies. In this study, we identified 65 new microsatellite loci isolated from a P. olivaceus genomic library.
A partial genomic library enriched with GT repeats was constructed using a slight modification of the procedures described by Hamilton et al. (1999). Genomic DNA was extracted from P. olivaceus muscle tissue using the TNES-urea buffer method (Asahida et al., 1996). DNA was digested with the enzymes AluI, RsaI, and HaeIII (New England Biolabs, Ipswich, MA, USA), and DNA fragments of 300-800 bp were isolated and ligated to SNX/SNX rev linker sequences. Linker-ligated DNA was polymerase chain reaction (PCR) amplified using SNX as the primer, and PCR products were hybridized to biotinylated (GT)10 probes attached to streptavidin-coated magnetic beads (Promega, Madison, WI, USA). Then, the enriched fragments were amplified again. The products were digested with NheI and ligated into the XbaI-digested pUC18 vector (Pharmacia, Uppsala, Sweden), followed by transformation into E. coli DH5α-competent cells. Positive clones with repeats were identified by PCR with (GT)10 and M13 primers. A negative control with no template was included in each PCR. The PCR products were analyzed in 1.5% agarose gels, and clones producing two or more bands were considered to contain a microsatellite locus. Plasmid DNA from the positive clones was purified using Acroprep 96-well filter plates (Pall Co., Port Washington, NY, USA). All positive colonies were sequenced using the M13 forward or reverse primer with a BigDye Terminator Cycle Sequencing Ready Reaction Kit and an ABI 3130xl automated DNA sequencer (Applied Biosystems, Foster City, CA, USA).
Primers were designed from the unique sequences flanking microsatellite motifs using OLIGO 5.0 software (National Biosciences, Plumouth, MN, USA). PCR conditions were initially optimized using DNA samples originally used for microsatellite isolation to establish whether the desired size product was amplified by changing the annealing temperature, the primers, and MgCl2 concentrations as well as the amplification profiles. Suitable microsatellite loci were genotyped to test the level of genetic polymorphism using 30 P. olivaceus individuals collected from the East Sea in Korea. The PCR reactions were performed in 10-μL volumes containing 10-ng genomic DNA, 1× PCR buffer, 1.5 mM MgCl2, 0.2 mM of each dNTP, 3 pmol of each primer, 0.5× Band Doctor, and 0.5 U of f-Taq DNA polymerase (Solgent, Solon, OH, USA). The forward primers were end-labeled commercially with the dyes 6-FAM, NED, or HEX (Applied Biosystems). The reactions were amplified using a PTC-200 thermocycler (MJ Research, Waltham, MA, USA) with an initial denaturation at 95℃ for 15 min, followed by 35 cycles of 30 s at 95℃, 30 s at 58℃, and 30 s at 72℃, and a final 30-min extension at 72℃. The lengths of the PCR products were determined with an ABI 3130xl Genetic Analyzer (Applied Biosystems) using the GeneScan-400HD (ROX) size standard (Applied Biosystems).
The number of alleles per locus, polymorphism information content (PIC), and observed and expected heterozygosity at each locus were calculated using CERVUS 3.03 (Marshall et al., 1998). Deviations from Hardy-Weinberg equilibrium (HWE) and linkage disequilibrium were estimated using GENEPOP 4.0 (Raymond and Rousset, 1995), and adjusted P-values for both analyses were obtained using a sequential Bonferroni test for multiple comparisons (Rice, 1989). We also estimated FIS values (Weir and Cockerham, 1984) that are used to determine HWE departures within a population. The presence of null alleles was examined using MICRO-CHECKER 2.2.3 (Van Oosterhout et al., 2004).
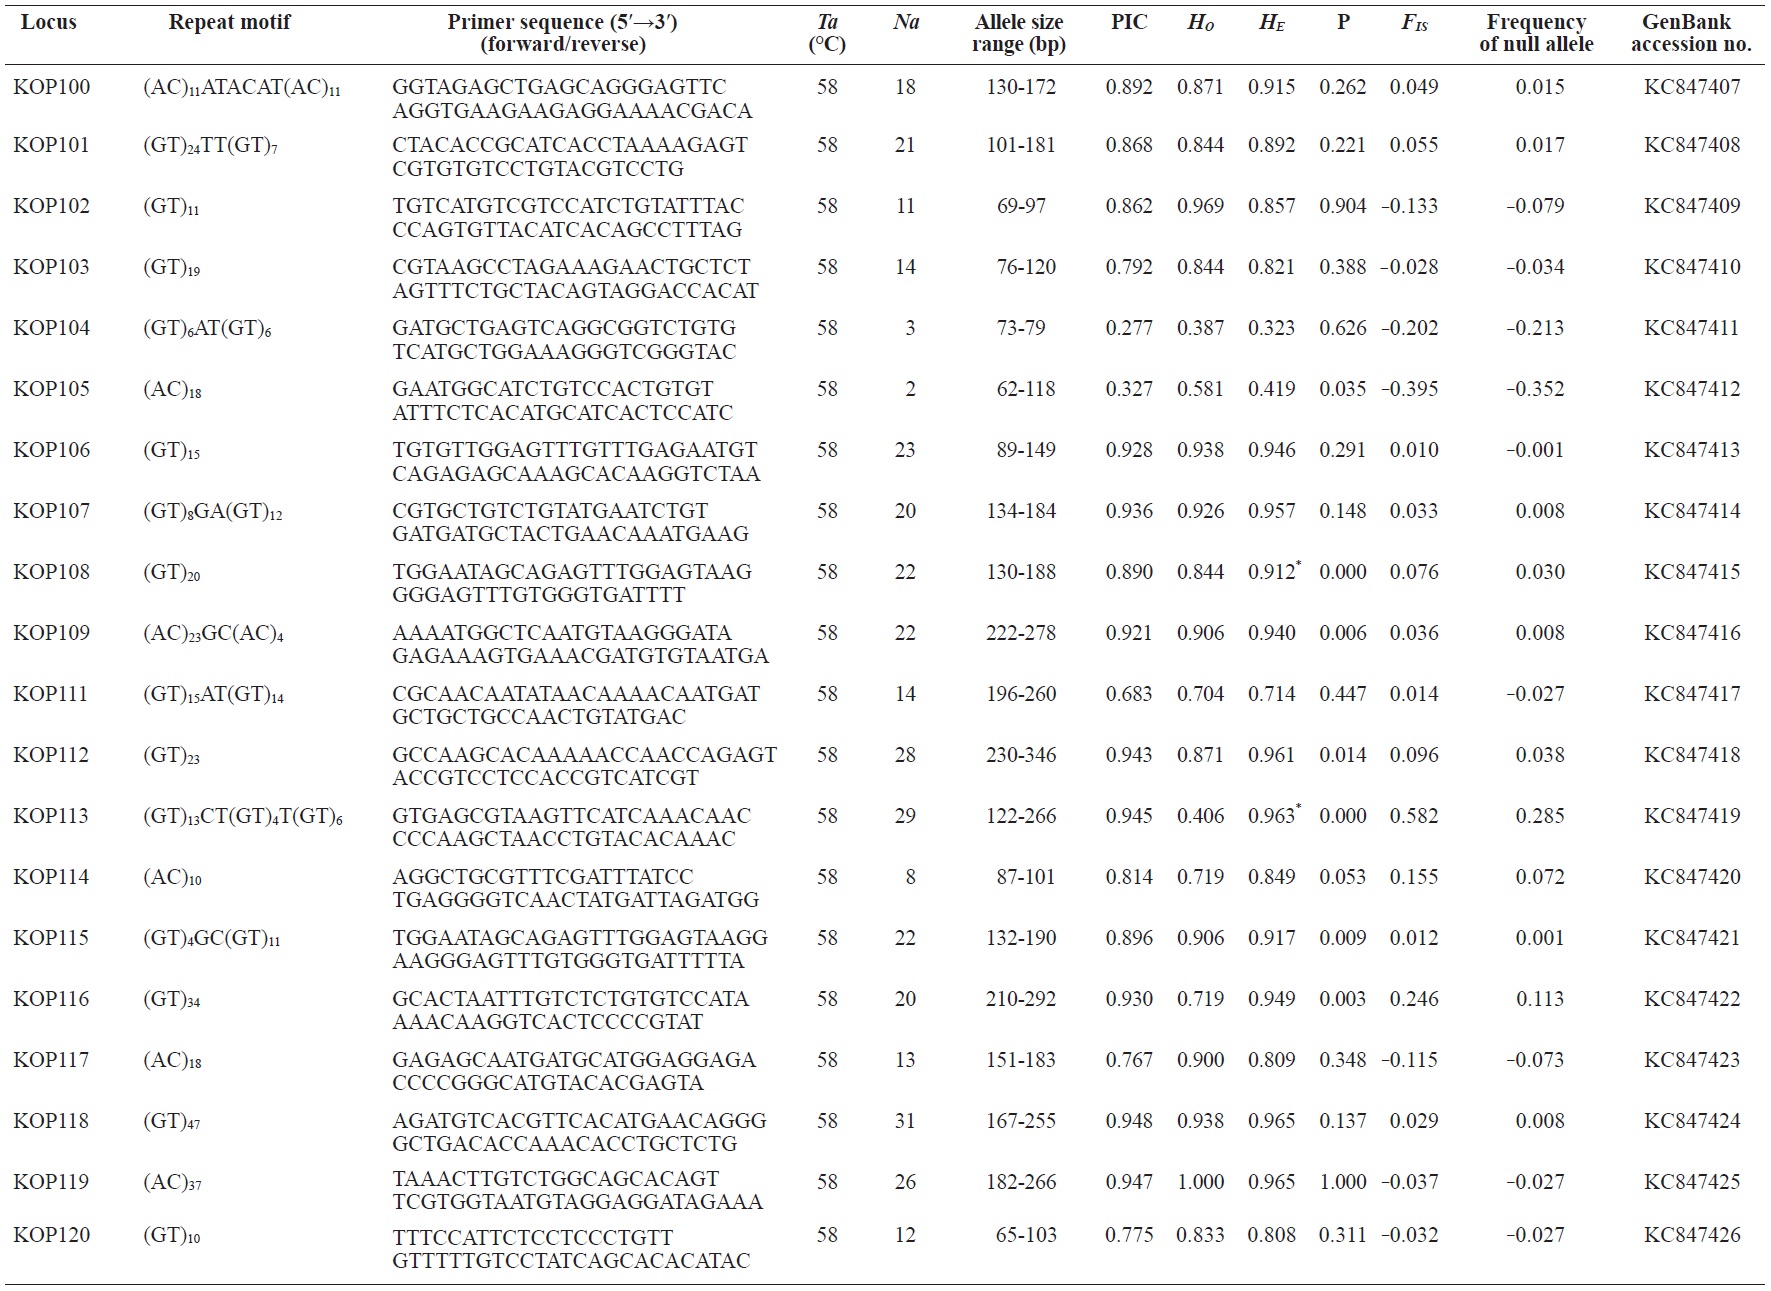
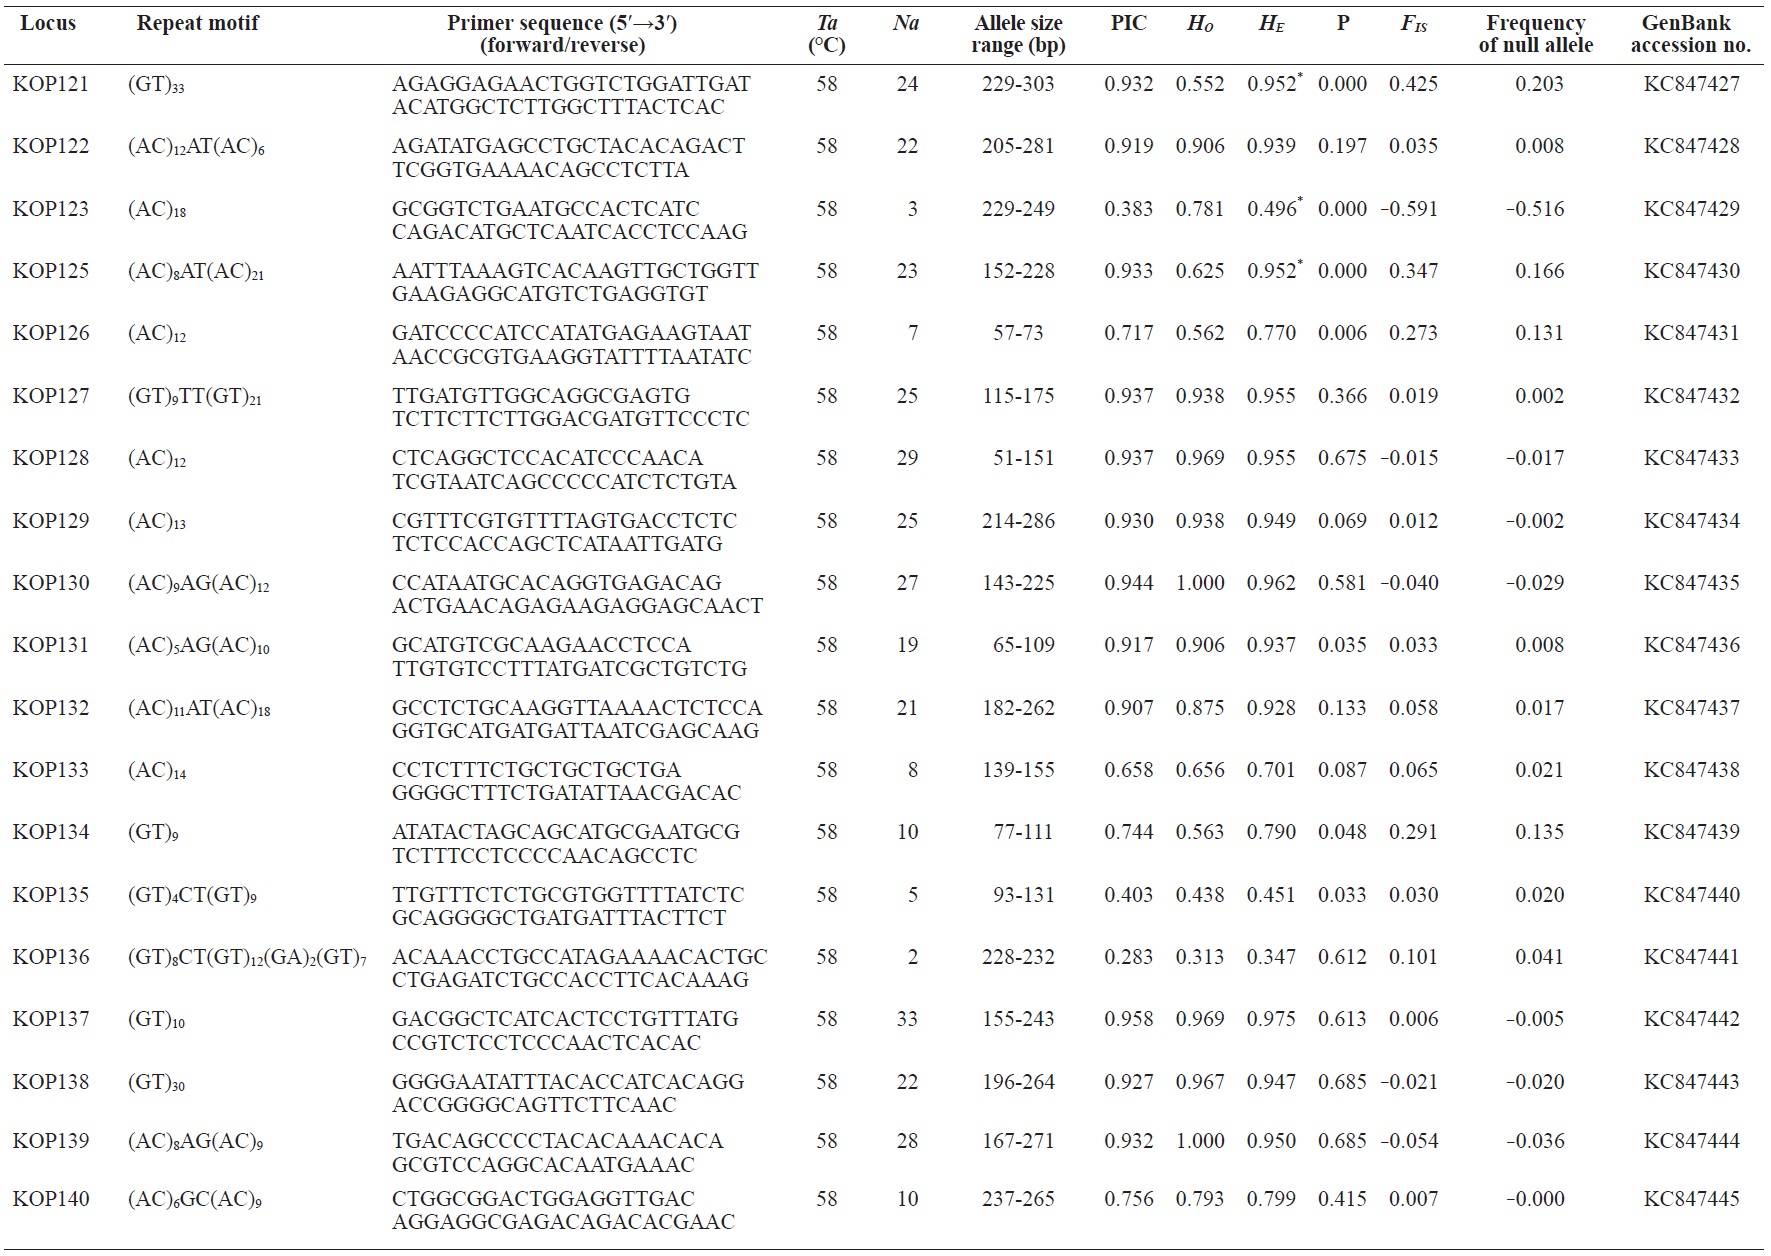
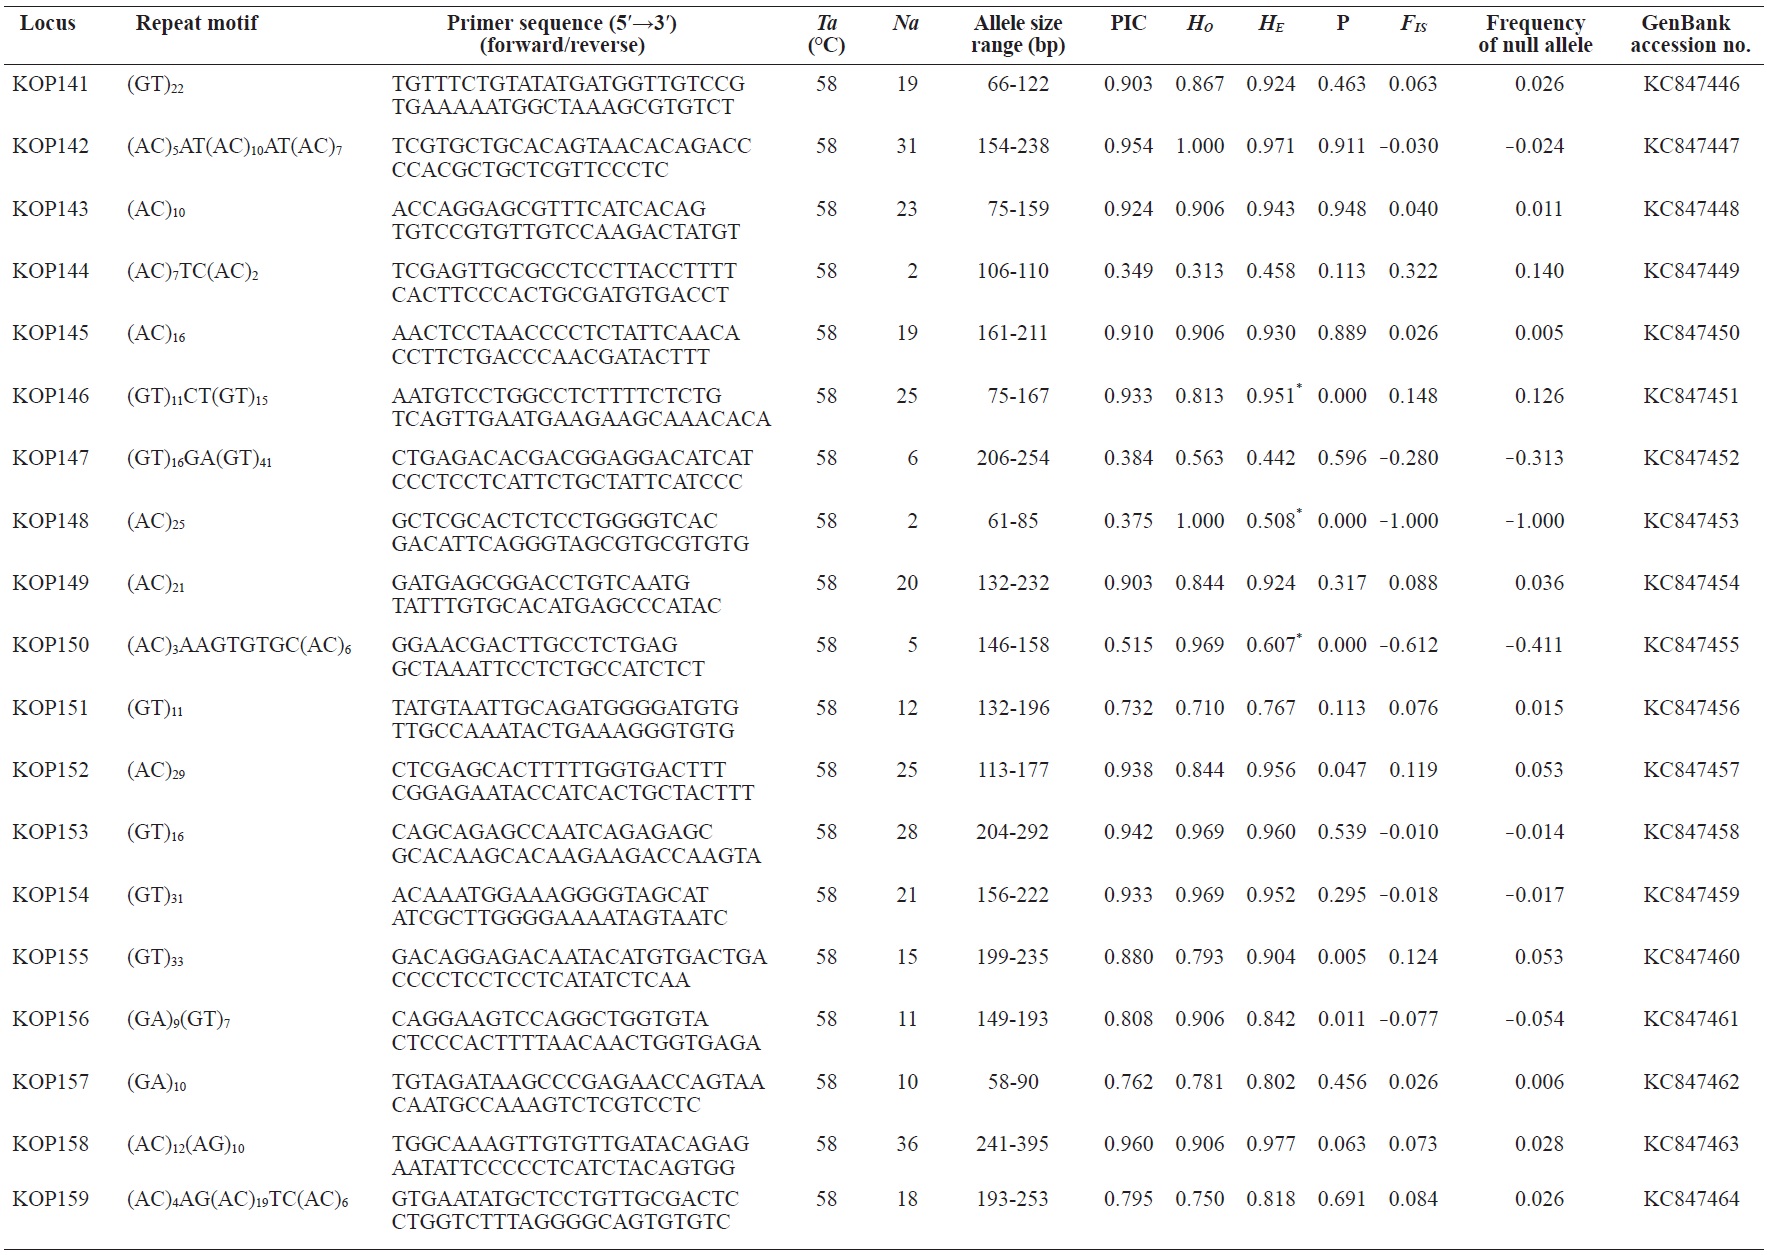
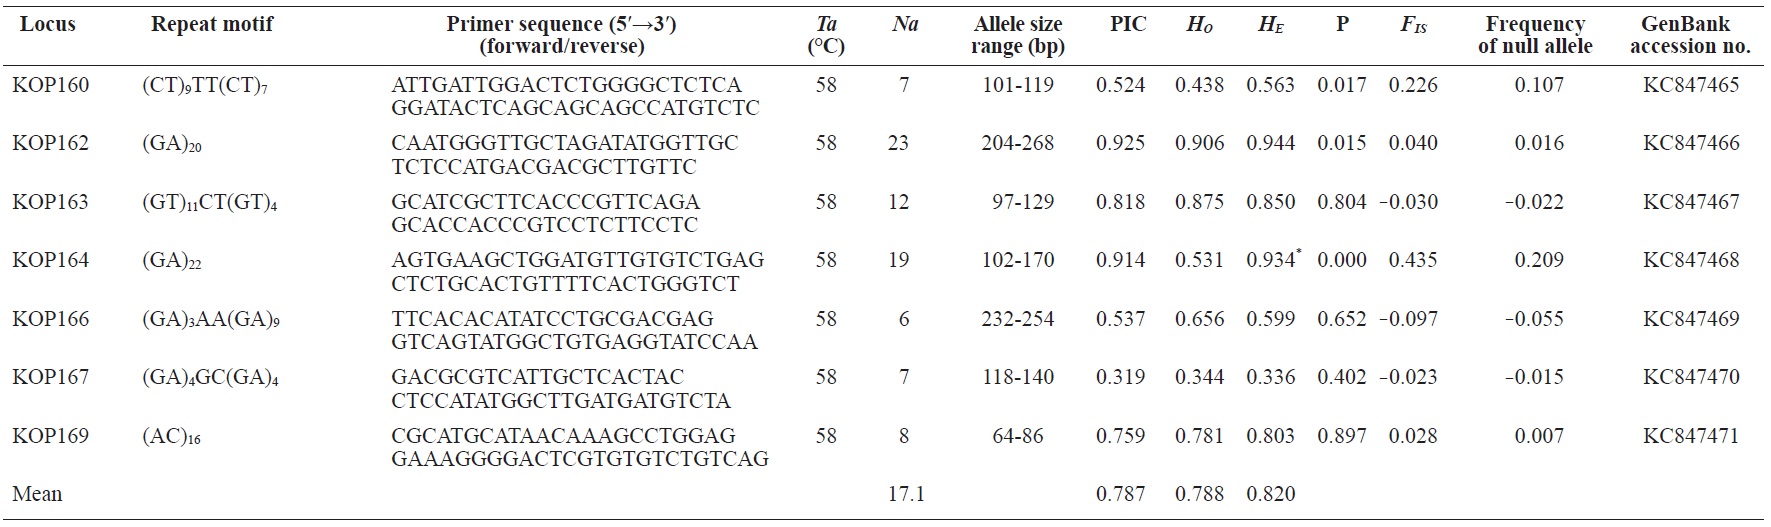
In total, 800 white colonies with inserts were randomly selected and screened for the repeat using PCR, which yielded 425 (53.1%) true positive clones. These were sequenced producing 330 (41.3%) sequences containing simple sequence repeats, of which 184 (23%) were eliminated because they possessed no flanking sequence. A total of 146 (18.3%) sequences containing microsatellites were obtained, and primers were designed to amplify microsatellite-containing regions of the genome. Only 98 of the 146 primer pairs successfully amplified the target region, and the remaining pairs either failed to amplify or produced nonspecific bands. Finally, we chose 70 primer sets because they produced clear and reliable bands at high temperatures, and we tested polymorphisms in 30 P. olivaceus individuals collected from the East Sea in Korea. Sixty-five loci were polymorphic (Table 1), and another five loci were monomorphic. The repeat motif, product size, and annealing temperatures at each of the 65 microsatellite loci are presented in Table 1. Conventional protocols for isolating microsatellites are cost, time, and labor intensive, and the efficiency of microsatellite isolation is low, ranging from 0.045% to 12% (Zane et al., 2002). Several enrichment techniques have been developed to overcome these challenges (Zane et al., 2002).
We constructed a microsatellite enrichment library for olive flounder using (GT)10 biotin-labeled probes, and 78% (330/425) of the positive clones contained microsatellite repeats. This efficiency is lower than that in tilapia (96%) (Carleton et al., 2002) but higher than that in cutlassfish (48%) (An et al., 2010).
The 65 new polymorphic microsatellite loci developed in P. olivaceus varied widely in their degree of polymorphism (Table 1). The number of alleles observed per locus ranged from 2 to 33 (mean, 17.1). Observed heterozygosity ranged from 0.313 to 1.000 (mean, 0.788), expected heterozygosity (HE) was 0.323-0.977 (mean, 0.820), and PIC was 0.277-0.960 (mean, 0.787). Heterozygosity, also referred to as gene diversity, is a suitable parameter for investigating genetic variation. For a marker to be useful for measuring genetic variation, it should have a heterozygosity of at least 0.3 (Takezaki and Nei, 1996). The HE range of the markers analyzed here was between 0.323 and 0.977; thus, the markers were appropriate for measuring genetic variation. The PIC value is related to the availability and utilization efficiency of a marker; the higher the PIC value of a marker is in a population, the higher the heterozygote frequency is and the more genetic information it provides (Arora et al., 2004). Genetic markers showing PIC values>0.5 are normally considered informative for population genetic analyses (Botstein et al., 1980). In this study, all 65 microsatellite loci were highly polymorphic. The mean PIC value across all loci was>0.5, which could provide sufficient information to assess of genetic diversity and construct genetic maps.
Nine loci (KOP108, KOP113, KOP121, KOP123, KOP125, KOP146, KOP148, KOP150, and KOP164) deviated from HWE in the tested population after sequential Bonferroni correction (P<0.0008) (Table 1). Six of these loci (except KOP123, KOP148, and KOP150) exhibited a significant deficiency of heterozygotes. Analysis with MICROCHECKER indicated the possible occurrence of null alleles at six of the loci (KOP113, KOP121, KOP125, KOP134, KOP146, and KOP164). In addition to the loci with deviations from HWE, null alleles were detected in three loci (KOP116, KOP126, and KOP134). In all cases, evidence for the presence of null alleles was relatively weak and, thus, insufficient to confirm a significant departure from HWE following Bonferroni correction. The estimated null allele frequencies ranged from 0.126 (KOP146) to 0.285 (KOP113). Moreover, four of the loci (KOP113, KOP121, KOP125, and KOP164) showed high estimated null allele frequency together with a highly significant positive FIS (heterozygote deficiency), strongly suggesting a causative relationship. Furthermore, no significant linkage disequilibrium between loci pairs was detected after Bonferroni correction (P<0.0008), except in two pairs (KOP102-KOP157 and KOP107-KOP112). These markers will be useful for population genetics, parentage analysis, association studies, and construction of a P. olivaceus linkage map.