Glyceraldehyde-3-phosphate dehydrogenase (GAPDH; EC 1.2.1.12) is an essential, glycolytic enzyme to convert glyceraldehyde-3-phosphate to 1,3-bisphosphoglycerate, and this catalytic pathway for energy production is highly conserved in most aerobic organisms. However, in addition to the housekeeping role of GAPDH in the carbohydrate metabolism, a number of studies have already demonstrated that mammalian GAPDHs should be closely involved in diverse nonglycolytic cellular pathways such as stress response, apoptosis and neurodegenerative disorders (Sirover, 2005; Tristan et al., 2011).
Both mammals and teleosts express two functional forms of GAPDHs (GAPDH-1 and GAPDH-2), and molecular phylogenetic studies have suggested undoubtedly that both isoforms of teleostean GAPDHs reveal the potential orthology to their corresponding counterparts of mammalian GAPDH isoforms (Kim and Nam, 2008; Sarropoulou et al., 2011). However, previous studies have also highlighted that teleost GAPDH-2 might have a different evolutionary history from that of mammalian GAPDH-2, and also that the physiological roles of teleostean GAPDH-2 might have been diversified from that common to mammalian orthologue (Manchado et al., 2007; Cho et al., 2008). For example, teleost GAPDH-2 lacks the Pro-rich N-terminal peptide that is typical of mammalian GAPDH-2 and, unlike mammalian GAPDH-2 showing the spermatogenic cell-specific expression (Bunch et al., 1998; Welch et al., 2000, 2006), transcripts of teleostean GAPDH-2 are found in a wide array of tissues (Cho et al., 2008).
Recently, teleost GAPDHs have also been begun to be reported for their potential involvements in nonglycolytic functions. They include the modulatory roles in the innate immunity (Cho et al., 2008, 2011) and embryonic development (Manchado et al., 2007; Sarropoulou et al., 2011). However, in contrast to rich information on mammalian GAPDHs, the functional analysis of fish GAPDHs has been still limited, in which the expression characteristics in the nonglycolytic pathways have been exemplified in only a few species as above. Moreover, at the genomic levels, the information on organizational features of both gapdh isoforms in teleost genomes has been insufficient so far.
In the present study, we describe the genomic organization of the two gapdh genes exploited from the mud loach (Misgurnus mizolepis; named gapdh-1 and mlgapdh-2), a commercially important, aquaculture-relevant freshwater species in Korea, and scrutinized the patterns for tissue- and developmental stage-dependent expression of the both gapdh isoforms. In addition, the acute immune response of the two gapdh isoforms at mRNA levels was also examined by using the lipopolysaccharide (LPS) challenge.
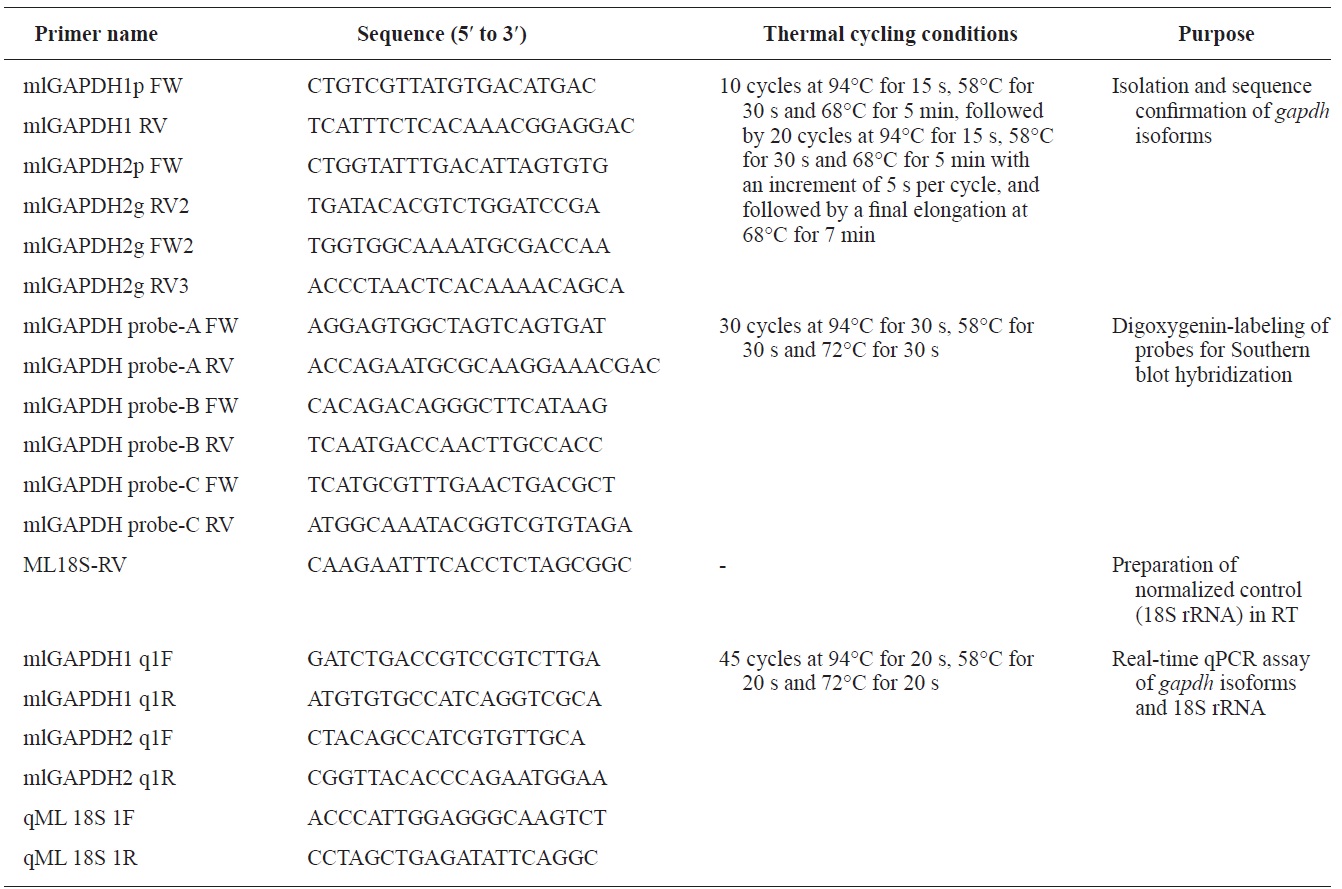
Genomic sequences of the gapdh-1 and mlgapdh-2 genes were isolated using Expand High Fidelity PCR System (Roche Applied Science, Manheim, Germany). Primer pairs (mlGAPDH1 FW/RV for gapdh-1and mlGAPDH2 FW/RV for mlgapdh-2 that had been designated based on the cDNA sequence of each isoform were used for PCR isolation. Information on the oligonucleotide primers and the thermal cycling conditions used in this study is provided in Table 1.The amplified products were TA-cloned and at least nine PCR clones were sequenced for each isoform at both directions. To compare the genomic organizations of mlgapdh isoforms with their potential orthologues, genomic gapdhs sequences published in literatures or public databases were compiled. Also we deciphered gapdh genomic sequences from other teleost genomes available in Ensembl Genome Browser (http://www.ensembl.org). Blast and text searches were carried out. Because the Ensembl Genome Database often contains unfinished draft regarding sequence annotations and assemblies, we edited and/or re-annotated the exon-intron organization for each gapdh genomic sequence based on the comparison with transcribed sequence, which is available in either Ensembl, other databases or published literatures.
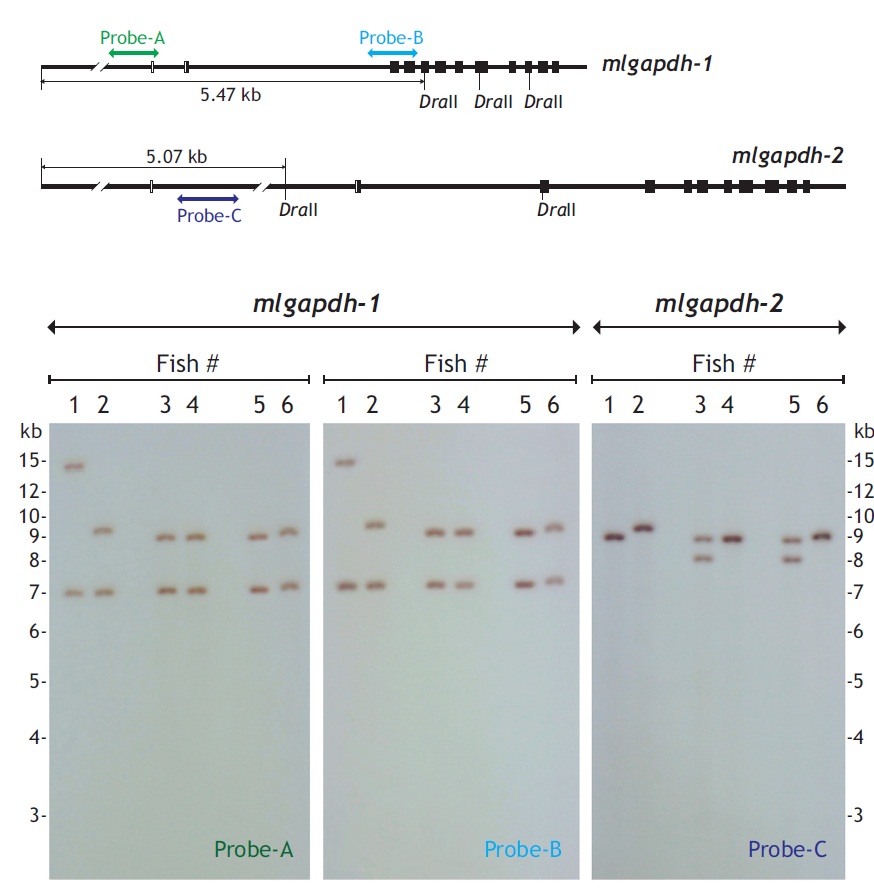
Genomic Southern blot hybridization was used to examine the organization and presence patterns of the mlgapdh-1 and mlgapdh-2 isoforms in the mud loach genome. DraII-digested 5 μg genomic DNA was separated on a 1% agarose gel, transferred to nylon membrane with the capillary transfer method, and hybridized with a digoxygenin-labeled probe. The genomic region targeted by each probe (labeled probes A, B, and C) is shown in Fig. 3. All procedures, including probe labeling, hybridization, stringent washing, and signal detection, were performed with the DIG DNA Labeling and Detection Kit (Roche Applied Science, Mannheim, Germany), according to the manufacturer’s manual.
First, to examine the tissue-specific expression of each mlgapdh isoform, a quantitative real-time reverse transcription (RT)-PCR assay was conducted with 12 tissues (brain, eye, fin, gill, heart, intestine, kidney, liver, muscle, spleen, ovary, and testis). The tissue samples were obtained surgically from healthy six-month-old individuals (n = 16; mean body weight [BW] = 19.6 ± 4.8 g). Tissue samples from the 16 individuals (eight females and eight males) were subjected to total RNA extraction for the quantitative PCR (qPCR) assays.
Second, to examine the expression patterns of the mlgapdh transcripts in developing embryos and early larvae, the pooled eggs from two females were artificially fertilized with sperm from three males, according to the procedure described by Kim et al. (1994). The fertilized embryos were placed in an incubator at 24 ± 0.5℃ and approximately 300 embryos were sampled at 0 (just after fertilization), 2 (32-cell stage), 4 (early-blastula stage), 6 (early-gastrula stage), 8 (late-gastrula stage), 12 (3-4-myotome stage), 16 (16-17-myotome stage), 20 (23-24-myotome stage), and 24 (tail beating) h post-fertilization (HPF). After hatching (28 HPF; day 0), about 110 larvae were also sampled at 1, 2, 3 and 4 days posthatching (DPH) for RNA preparation. The embryogenesis and early ontogenesis of the mud loach were described in detail by Kim et al. (1987).
Third, to examine the potential differential expression of the mud loach gapdh genes in response to endotoxin exposure, we performed LPS (Escherichia coli 0111:B4; Sigma-Aldrich, St Louis, MO, USA) challenge. Six mud loaches (average BW = 16 ± 4 g) were given intraperitoneal injections of LPS (suspended in phosphate-buffered saline [pH 7.4] at a dose of 0, 2, or 5 μg/g BW). The injected fish were transferred to one of three replicate rectangular cages (40 × 60 × 30 cm3 = W × D × H) installed in a large tank (2 × 4 × 1 m3 = W × D × H) containing 500 L of tap water at 25 ± 1.0℃. After 24 h, the liver was removed from each fish and subjected to gene expression assays.
Total RNA was purified using the RNeasy Midi Kit (Qiagen, Hilden, Germany), including the DNase I treatment step, according to the manufacturer’s protocol. Total RNA (2 μg) was reverse transcribed using the Qiagen Omniscript Reverse Transcription System (Qiagen), using an oligo-d(T)20 primer (1 μM final concentration) and a mud loach 18S rRNA primer (ML18S-RV; 0.05 M final concentration) (Nam et al., 2011). The reaction conditions were according to the manufacturer’s protocol. The RT product (cDNA sample) was diluted twofold (for gapdh cDNAs) or tenfold (for 18S rRNA) with sterile distilled water and then the diluted cDNA sample (1 μL) was used as the template for the thermal cycling reaction. Standard curves for gapdh-1, mlgapdh-2, and 18S rRNA were prepared with five log-dilutions of each positive plasmid sample, and PCR efficiencies of> 90% were confirmed before the assays. Real-time PCR amplification (25 μL reaction volume) was performed using the 2× iQ™ SYBR Green Supermix (Bio-Rad, Hercules, CA, USA). The PCR primer pairs were mlGAPDH1 q1F/1R (amplicon, 263 bp), mlGAPDH2 q1F/1R (amplicon, 273 bp), and qML18S 1F/1R (amplicon, 274 bp) for gapdh-1, mlgapdh-2, and 18S rRNA, respectively. The threshold cycle number (Ct) used was the default setting in the iCycler iQ™ Real-Time PCR Detection System (Bio-Rad). To determine the basal expression levels of the mlgapdh isoforms in adult tissues (including LPS-stimulated tissues) and developing embryos/larvae, the expression of each mlgapdh isoform in each sample was normalized to the 18S rRNA level of the same sample. The relative expression levels were calculated according to a method described previously (Schmittgen and Livak, 2008). All assays were performed in triplicate. Differences in the relative expression levels among samples were assessed by analysis of variance (ANOVA) followed by Duncan’s multiple range test with a significance level of P = 0.05, using the SPSS software ver. 10.1.3 (SPSS Inc., Chicago, IL, USA).
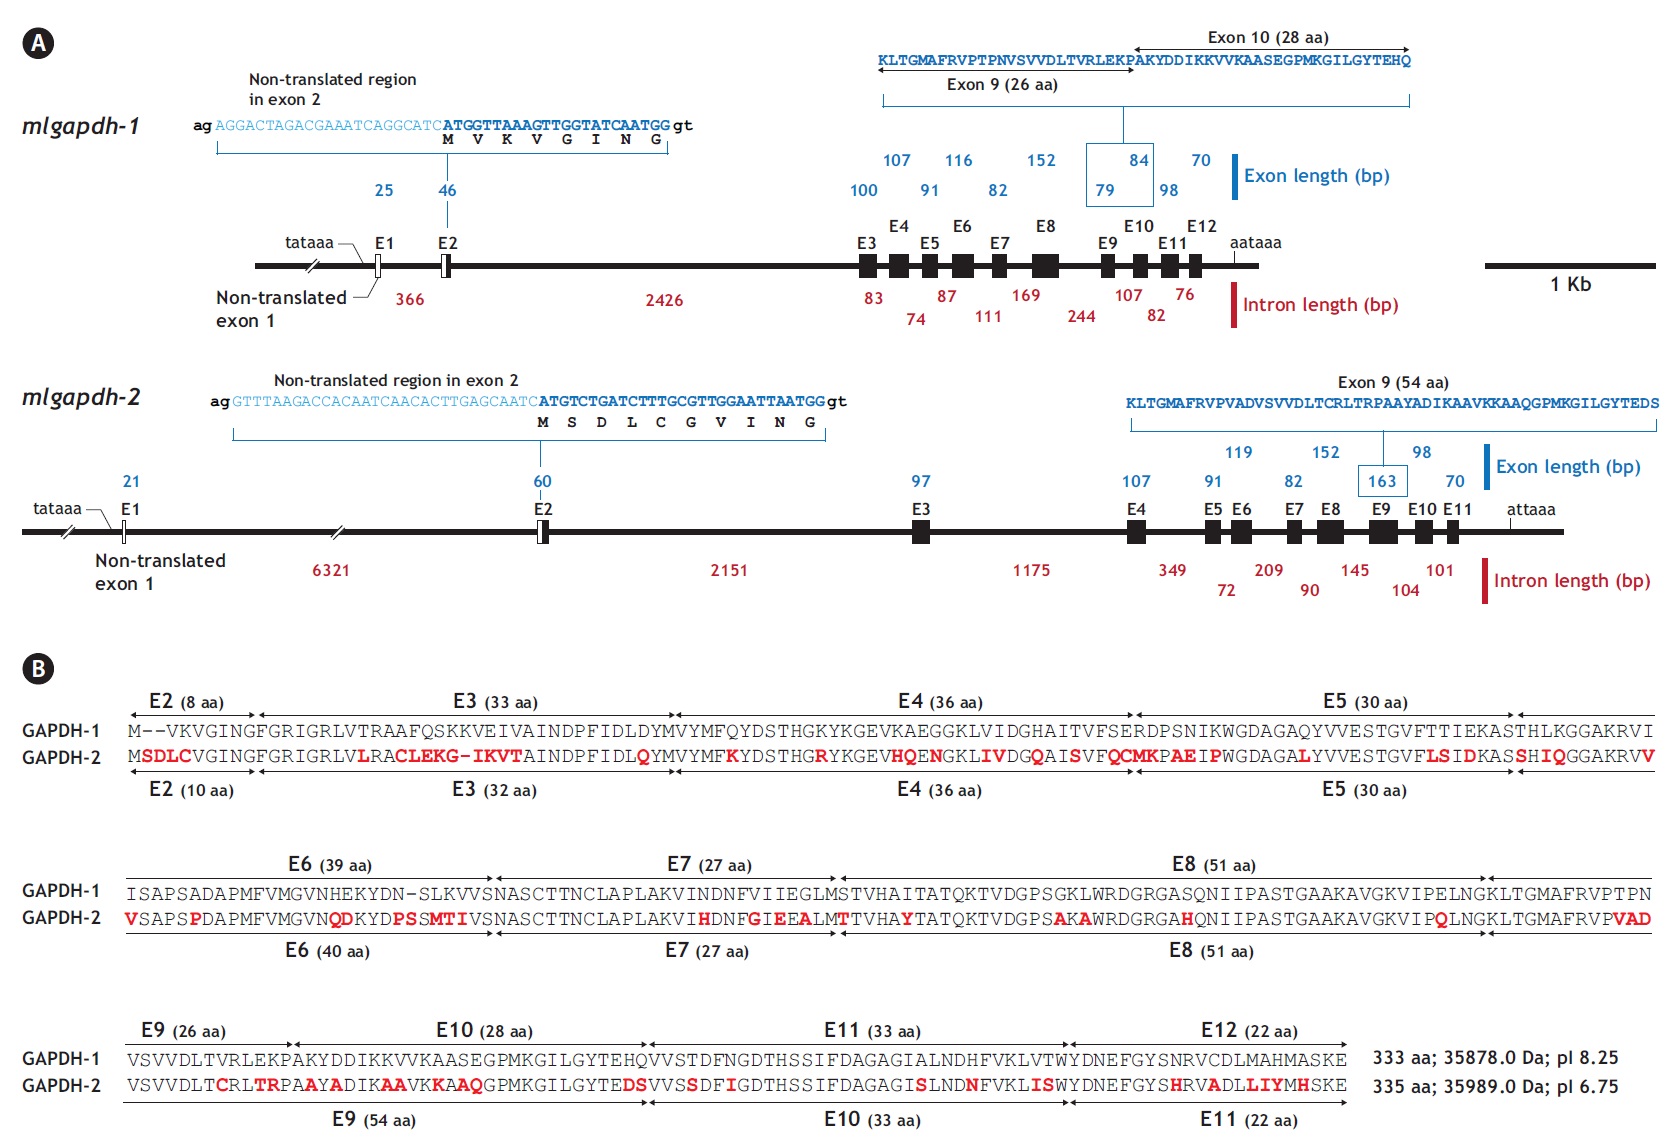
The two mlgapdh isoform genes have different genomic structures. Based on a comparative analysis of the cDNA (JN230712 for gapdh-1 and JN230713 for mlgapdh-2)
and genomic sequences, mlgapdh-1 (JN230716) has 11 translated exons (exons 2-12) and one non-translated exon (exon 1; NTE1). The NTE1 (25 bp) of mlgapdh-1 begins 43 bp after the putative TATA signal and the length of intron 1 is 366 bp. In the first translated exon (exon 2), the ATG translation initiation site occurs 23 bp from the 5′ end of exon 2. Intron 2 (between exons 2 and 3 of mlgapdh-1) is significantly larger (2,426 bp) than the other introns. In contrast, mlgapdh-2 (JN230717) has 10 translated exons (exons 2-11) and an NTE1 (21 bp). Intron 1 (between NTE1 and exon 2) in mlgapdh-2 was markedly longer (6,321 bp) than in mlgapdh-1 (366 bp). The intron that interrupts exons 3 and 4 of mlgapdh-2 was significantly longer (1,175 bp) than that in mlgapdh-1 (83 bp). Based on a pairwise alignment of the two isoforms, exon 9 of mlgapdh-2 is separated in mlgapdh-1 (exon 9 and exon 10). Except for this exon separation (the conversion of exons 9 and 10 in mlgapdh-1 into exon 9 in mlgapdh-2), the numbers of amino acids encoded by the other exons were similar in mlgapdh-1 and mlgapdh-2 (Appendix 1).
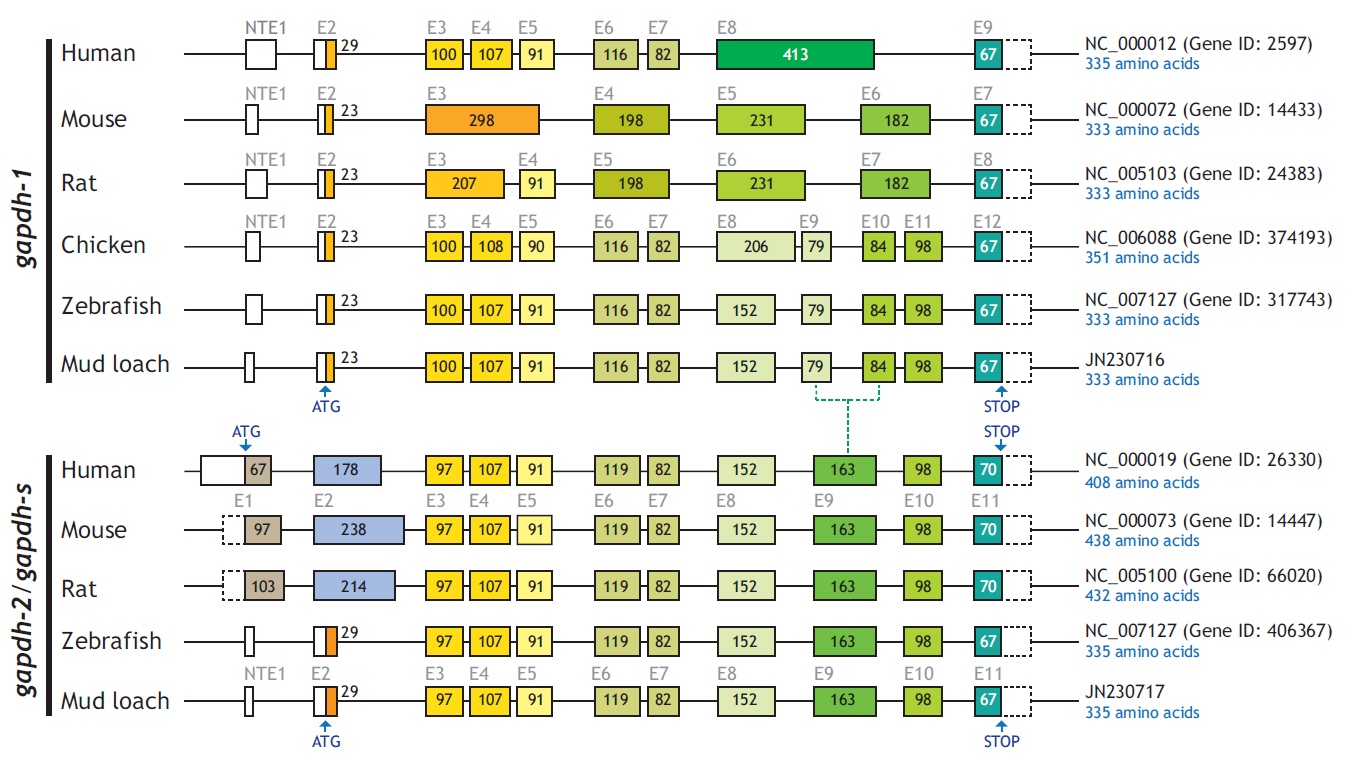
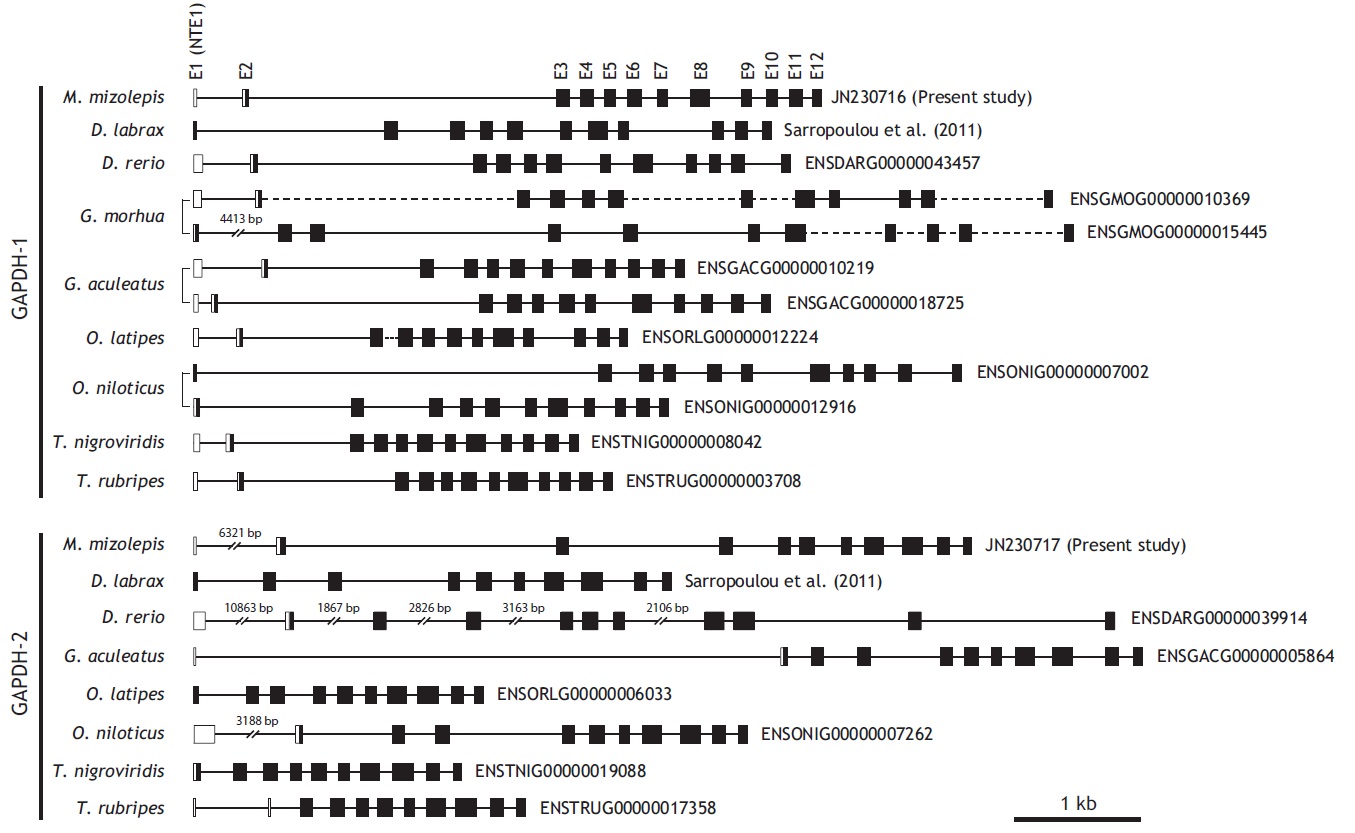
From bioinformatics mining, we detected two copies of gapdh-1 in several teleost species such as the Atlantic cod Gadus morhua, stickleback Gasterosteus aculeatus and Nile tilapia Oreochromis niloticus, whereas only one copy of gapdh-2 was seen in all fish species searched (Fig. 1). Comparisons of the genomic organizations of the gapdh isoforms among teleosts indicated that fish share conserved genomic organization features for both isoforms, although the lengths of non-coding regions vary markedly. In terms of similarly, many teleostean gapdh genes possessed non-translated exons based on our bioinformatics analyses. Although non-translated exons have not been clearly identified in several fish gapdh genes, due to incomplete sequence information in the database, they likely also have a non-translated exon. The numbers of amino acids encoded by each gapdh gene were largely homogenous regardless of fish species. However, further extension of the comparisons with other representative vertebrate orthologs (fish, human, mouse, rat, and chicken) showed that the exon-intron organization varied among species, although they encoded similar total numbers of amino acids (333-351). The number of exons varies among those species (seven in mouse to 12 in fish and chicken), and several of the exons seen in the lower vertebrates have merged into fewer but larger exons in mammals (Fig. 2). This suggests that vertebrate gapdh-1 genes might have evolved from a common ancestor through exon shuffling or rearrangement.
[Fig. 2.] Schematic diagrams to show exon-intron organization of gapdh genes from representative vertebrates. Two teleost species (mud loach and
zebrafish) were selected for comparison with other vertebrates. Horizontal lines are the flanking regions and introns (not drawn to scale), while exons
(E) are shown as boxes. Coding regions are filled with colors while non-coding regions and non-translated exon 1s (NTE1s) are in blank. Numerical figure
provided for each translated exon is the length (bp) of coding nucleotide sequence. Translation start site (ATG) and stop codon are indicated by vertical
arrows. Accession code and the number of amino acids encoded for each gapdh sequence are indicated at the right side. In the comparison among
gapdh-1 orthologues, the three exons 3, 4, and 5 of human, chicken and fish gapdh-1s are merged into either two (exons 3 and 4 in rat) or one (exon 3 in
mouse) larger exon(s) in murine gapdh-1s. As similarly, two exons 6 and 7 in human, chicken and fish gapdh-1s appear in a larger, merged exon in murine
gapdh-1s (exon for mouse and exon 5 for rat). On the other hand, the largest exon of human gapdh-1 (exon 8) is divided into multiple smaller exons in
other orthologues (two exons for murine gapdh-1s [exons 4 and 5 for mouse and exons 6 and 7 for rat], and four exons 8-10 for chicken and fish gapdh-1s).
However such an exon rearrangement (i.e., merge/separation) is not observable between gapdh-2 (or gapdh-s) orthologues.
Unlike the gapdh-1 genes, the mammalian and fish gapdh-2 genes have the same numbers of exons (11 exons), although there are significant differences in the deduced lengths of the polypeptides of the mammalian and teleost GAPDH-2 proteins because of the long proline-rich N-terminal domain in the mammalian GAPDH-2 proteins. However in contrast to mammalian gapdh-2 genes, the fish gapdh-2 genes may have an untranslated exon, although a non-translated exon-1 has not been found in all teleost gapdh genes, likely due to the errors in sequencing and/or annotation in the Ensembl database. The identification of the NTE1 in teleost gapdhs was not highlighted yet in a recent study of two perciform species (Sarropoulou et al., 2011). Despite this difference, the mammalian and teleost gapdh-2 genes have identical or similar numbers of nucleotides (and amino acids encoded) in each of the remaining exons (exons 3-11) (Fig. 2). No distinct genomic isoform of gapdh-2 has been identified in the chicken, although adult chickens are known to express diverse transcript variants of gapdh, including alternatively spliced and alternatively initiated forms (Mezquita et al., 1998). Together, these data suggest that evolutionary divergence patterns of the two gapdh paralogs differ among the various taxonomic groups.
Genomic Southern blot hybridization patterns were polymorphic for both gapdh-1 and mlgapdh-2 in six unrelated individuals (Fig. 3). The first blot of gapdh-1 probed with probe-A produced two hybridization bands for all six individuals, and four different hybridization patterns were observed (hybridization bands at approximately> 14.0/7.0 kb, 9.5/7.0 kb, 9.0/7.0 kb, and 7.2/9.2 kb). The second blot for gapdh-1 probed with probe-B showed the same hybridization pattern as probe-A. In contrast, the hybridization analysis of mlgapdh-2 using probe-C showed that four of the six individuals displayed only one hybridization signal (a ~9.0-kb band for fishes #1, #4, and #6, and a 9.5-kb band for fish #2), whereas the other two individuals (fishes #3 and #5) displayed two hybridization bands (at 8.0 and 9.0 kb).
If each of gapdh genes existed as a single copy in the mud loach genome, we would expect a Southern blot hybridization of DraII-digested genomic DNA to show a single band larger than 5.4 kb (for gapdh-1) or 5.1 kb (for mlgapdh-2). However, two hybridization bands were detected in all six individuals (for gapdh-1), and in two of the six individuals (for mlgapdh-2). Because each fish showed similar hybridization intensity between the two bands for gapdh-1, the present result suggests of the presence of one additional gapdh-1 copy in the mud loach genome, as observed in several other teleosts (Sarropoulou et al., 2011) (see also Fig. 1). The size differences in the two hybridization bands among individuals (particularly for fish #1) could result from polymorphism in the DraII-restriction sites among individuals; further analysis with a larger number of fish samples is needed to further explore this explanation. However, for mlgapdh-2, the hybridization pattern was not identical to that of gapdh-1, in terms of the signal intensities of the two hybridization bands in any given individual (for example, fish #3 or #5 in the blot), which were much weaker than the signal from the single hybridization band of fish #1, #2, #4, or #6. This suggests that polymorphism in mlgapdh-2 may have resulted in allelic differences in the restriction sites recognized by DraII, rather than from variability in the gene copy numbers among individuals. This would also be consistent with our bioinformatics analysis, showing only one copy of gapdh-2 in all teleost species examined. Together, our Southern blot results suggest that the mud loach possesses two paralogous copies (i.e., subisoforms) of gapdh-1 and one of gapdh-2 in its genome and also that both isoforms may represent an allelic difference in the restriction sites of DraII, depending on the individuals. It is also known that mammalian genomes often contain multiple pseudogene copies (50-364 copies) of duplicated gapdh genes, which have been acquired through retrotranspositional activity (Garcia-Meunier et al., 1993; Liu et al., 2009). Currently, it is unclear whether the additional copy of gapdh-1 undiscovered yet is functional.
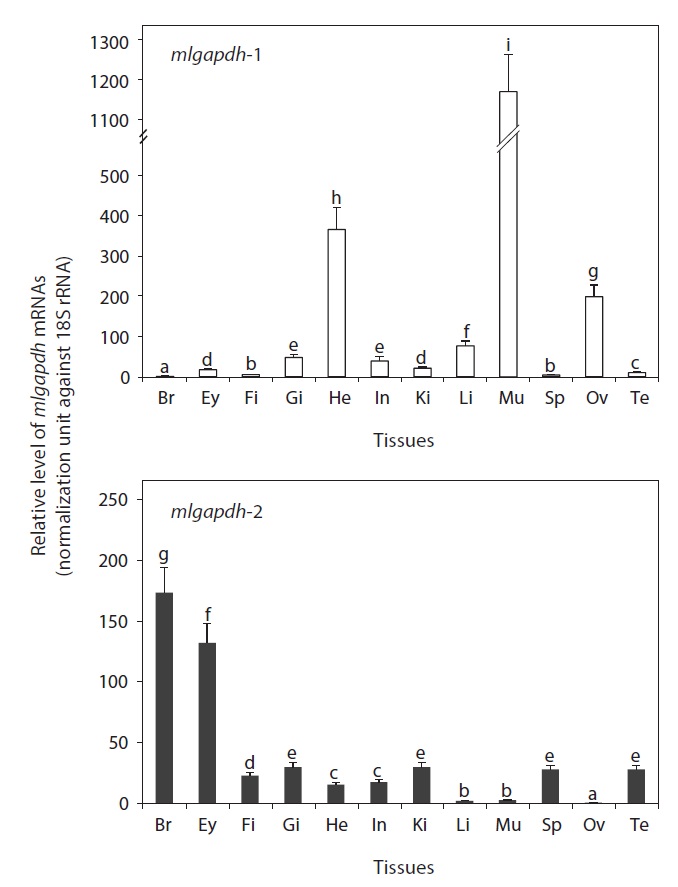
As expected, the mRNAs of both mlgapdh isoforms were detected ubiquitously in all tissues examined, but the basal mRNA levels were variable among tissues and between isoforms (Fig. 4). The gapdh-1 transcripts were present predominantly in skeletal and heart muscles (P<0.05).
[Fig. 4.] Tissue distribution patterns and basal expression levels of mud
loach gapdh isoform transcripts as assessed by qPCR analysis based on
the normalization against 18S rRNA expression. Tissues examined are the
brain (Br), eye (Ey), fin (Fi), gill (Gi), heart (He), intestine (In), kidney (Ki),
liver (Li), muscle (Mu), spleen (Sp), ovary (Ov), and testis (Te). Mean ± SDs
(from triplicate assays) with different letters were significantly different
based on ANOVA followed by Duncan’s multiple ranged tests at P = 0.05.
The ovary also contained higher amounts of gapdh-1 transcripts versus other tissues (P<0.05). The liver, gills, and intestine showed moderate levels of mlgapdh-1 transcripts, whereas other tissues examined showed weak or minimal expression. In contrast, the highest levels of mlgapdh-2 transcripts were found in the brain, followed by eye (P<0.05). The other tissues examined, including the gill, kidney, spleen, testis, and fin, showed moderate levels of mlgapdh-2 transcripts, whereas the heart and intestine harbored low levels (P<0.05). The tissues such as ovary, liver, and skeletal muscle contained very low levels of mlgapdh-2 transcripts (P<0.05). From a comparison of the basal mRNA levels of mlgapdh-1 and mlgapdh-2 in specific tissues, the transcript levels of mlgapdh-1 in muscle and ovary were up to 450-fold higher than those of mlgapdh-2 (P<0.05). The mlgapdh-1 transcript levels were also 40 and 23 fold higher than the mlgapdh-2 levels in the liver and heart, respectively (P<0.05). Conversely, the expression of mlgapdh-2 was significantly higher than that of mlgapdh-1 in the brain, eye, fin, spleen, and testis (P<0.05).
The ubiquitous detection in all tissues examined is consistent with the protein’s essential housekeeping roles in cellular energy metabolism. However, the basal expression levels of the two isoforms were variable among tissues. The mlgapdh-1 mRNA was strongly predominant in muscle tissues (skeletal muscle and heart), as is mammalian gapdh-1 (Welch et al., 2000). The tissue distribution patterns observed in this study were similar to previous reports that gapdh-1 genes are strongly expressed in high-energy-requiring tissues, such as the skeletal muscle and heart, whereas the gapdh-2 genes are consistently most strongly expressed in the brain (Manchado et al., 2007; Cho et al., 2008). Although only three studies have quantitatively assayed gapdh isoforms among tissues, the expression patterns were fairly consistent in three distantly related species: rockbream (Oplegnathus fasciatus, Perciformes) (Cho et al., 2008), Senegalese sole (Solea senegalensis, Pleuronectiformes) (Manchado et al., 2007), and mud loach (M. mizolepis, Cypriniformes) (this study). This suggests that the tissue-specific roles of the two GAPDH isoforms may be broadly conserved in the teleost lineage, although the number of fish species examined must be increased. The mud loach testis showed higher expression of mlgapdh-2 than mlgapdh-1, consistent with previous findings for flatfish gapdh-2 (Manchado et al., 2007). However, the potential roles of the GAPDH-2 isoform in spermatogenesis and/or male fertility remain to be explored (Miki et al., 2004).
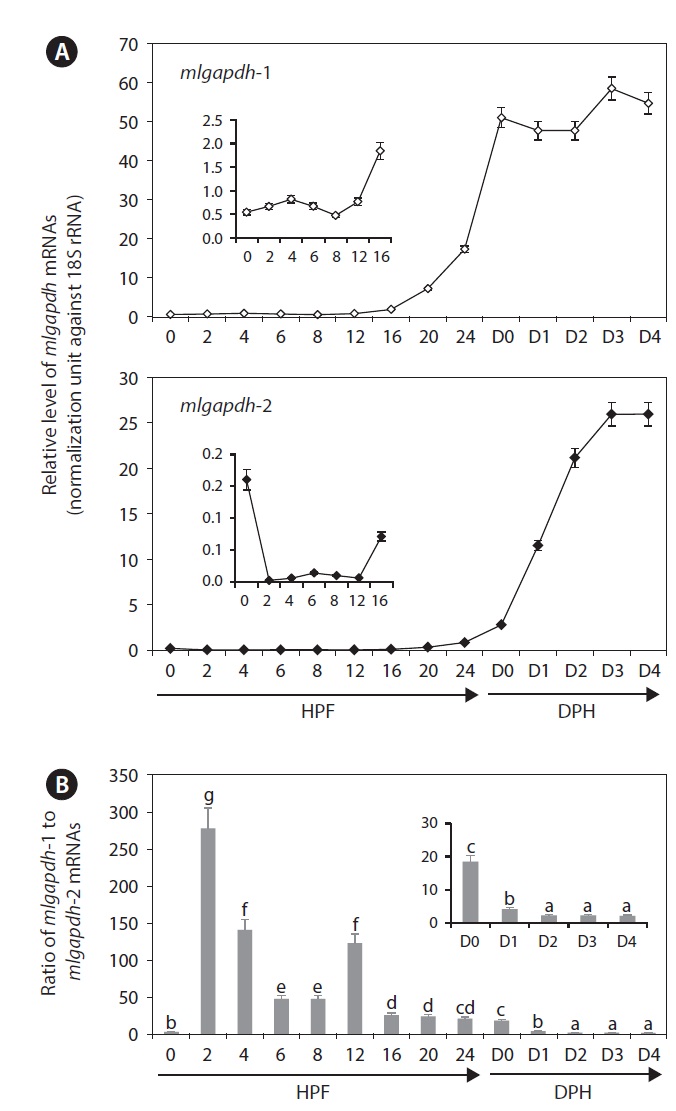
Both gapdh isoforms were dynamically regulated in developing mud loach embryos and early larvae. Overall, the levels of mlgapdh-1 and mlgapdh-2 transcripts increased gradually with embryonic development, and then increased sharply from around hatching (Fig. 5). The mRNA levels of gapdh-1 were relatively constant until 12 HPF, began to increase from 16 HPF, and then increased rapidly in subsequent stages (P<0.05). At hatching (day 0), the amount of gapdh-1 transcripts was ~ 100 fold higher than the initial level in the fertilized eggs. Thereafter, the level remained constant until day 2 (2 DPH), and then increased slightly at days 3 and 4 (P<0.05). In contrast, the mlgapdh-2 transcript levels decreased upon fertilization (P<0.05) and were maintained at low levels until 12 HPF. Like mlgapdh-1, the expression of mlgapdh-2 was initially activated at 16 HPF (P<0.05), and then increased continuously until 3 DPH (day 3), when they stabilized. During embryonic development, the expression of mlgapdh-1 transcripts was higher than that of mlgapdh-2 transcripts, regardless of the developmental stage. The ratios of mlgapdh-1 expression to mlgapdh-2 expression ranged from 2 (during D2-D4) to more than 270 (at 2 HPF), when the relative ratio decreased gradually with embryonic development and as early ontogenesis progressed, except at 0 and 12 HPF.
In this study, the relative levels of gapdh-1 transcript were always higher than that of mlgapdh-2 transcripts
throughout embryogenesis and ontogenesis, suggesting that MLGAPDH-1 may be more closely associated with the early development and ontogeny of this species than MLGAPDH-2. The expression of the mlgapdh-1 isoform was initially upregulated from 16 HPF (corresponding to the heart-beating stage) (Kim et al., 1987), increased sharply at hatching, and was maintained thereafter at a relatively constant level. This finding is consistent with high energy demand during hatching and larval development, including during muscle differentiation.
Manchado et al. (2007) also reported the differential regulation of the gapdh isoforms during the metamorphosis of flatfish larvae, in that the expression of gapdh-1, but not gapdh-2, was significantly modulated, perhaps in response to the energy demands during the metamorphic stage. In contrast, the activation of mlgapdh-2 during development occurs slightly later than that of mlgapdh-1, and the increase in mlgapdh-2 is prominent only after 24 HPF, suggesting that the role of MLGAPDH-2 is important during the larval stage rather than in the early embryo. Meanwhile, the functional involvement of GAPDH (especially GAPDH-1) as a maternal gene with high expression levels in unfertilized eggs has also been reported in perciform species (Mommens et al., 2010; Sarropoulou et al., 2011).
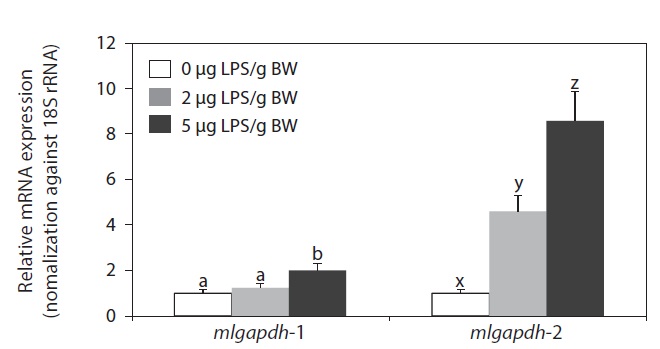
LPS injection upregulated the expression of both mlgapdh isoforms in the liver, but the patterns of upregulation differed (Fig. 6). The mlgapdh-1 transcripts were induced only in fish injected with the higher dose (5 μg LPS/g BW; P<0.05) and the degree of induction (up to twofold) was less than that observed for mlgapdh-2. In contrast, mlgapdh-2 transcripts were induced significantly in those tissues by both dose levels of LPS (2 μg and 5 μg LPS/g BW; P<0.05). Furthermore, the increase in mlgapdh-2 transcripts was dose-dependent (five- and ninefold after doses of 2 and 5 μg LPS/g BW, respectively, relative to that in non-challenged fish).
As shown in Fig. 6, the inducibility and responsiveness of mlgapdh-2 were greater than those of mlgapdh-1. Although few quantitative comparisons of the expression of the gapdh isoforms in response to a given stimulatory treatment have been made in fish, several studies of the utility of gapdh as an internal control for assessment of gene expression in fish have reported the possible modulation of gapdh transcripts by various stimulatory factors (Tang et al., 2007; Mitter et al., 2009; Dang and Sun, 2011). Such differential inducibility between isoforms could be related, at least in part, to the different patterns of transcription factor-binding motifs in their 5′-flanking regulatory regions. The 5′-flanking region of mlgapdh-2 contains more copies of several immunity- or stress-related motifs/elements than does mlgapdh-1 (Cho et al., 2011). Collectively, our results are consistent with previous reports of the modulated expression of gapdh in aquatic animals in response to bacterial and/or viral challenges (Cho et al., 2008; Booth and Bilodeau-Bourgeois, 2009), and with the upregulation of gapdh genes in a rat model of LPS-induced inflammation (Xie et al., 2006). Although we have not yet clarified the role(s) of inflammation-induced GAPDH proteins in the pathogenesis of infections in this species, LPS injection is known to cause severe inflammatory responses and tissue damage, triggering apoptosis (Gao and Kwaik, 2000; Bannerman and Goldblum, 2003; DeLeo, 2004; Li et al., 2005). Several previous studies of fish have also shown that LPS elicits typical apoptotic characteristics in vitro and in vivo (MacKenzie et al., 2006a, 2006b; Xiang et al., 2008).
In summary, two paralogous isoforms of the gapdh genes of the mud loach were isolated and characterized at the genomic level. Both mlgapdh-1 and mlgapdh-2 revealed the similar non-translated exons; however, the two isoforms have different exon-intron organizations. The mud loach apparently possesses two paralogous copies of mlgapdh-1 and a single mlgapdh-2. Gapdh-1 transcripts predominate in tissues that require a high energy flow, while gapdh-2 is expressed abundantly in the brain. Both isoforms are differentially regulated during embryonic and larval development, during which mlgapdh-1 expression is always higher than that of mlgapdh-2. In contrast, LPS challenge preferentially induced mlgapdh-2, rather than mlgapdh-1, transcripts in the liver. Therefore, mlgapdh-1 may be associated more closely with energy metabolism, whereas mlgapdh-2 is related more to stress/immune responses in the mud loach.


![Schematic diagrams to show exon-intron organization of gapdh genes from representative vertebrates. Two teleost species (mud loach and
zebrafish) were selected for comparison with other vertebrates. Horizontal lines are the flanking regions and introns (not drawn to scale), while exons
(E) are shown as boxes. Coding regions are filled with colors while non-coding regions and non-translated exon 1s (NTE1s) are in blank. Numerical figure
provided for each translated exon is the length (bp) of coding nucleotide sequence. Translation start site (ATG) and stop codon are indicated by vertical
arrows. Accession code and the number of amino acids encoded for each gapdh sequence are indicated at the right side. In the comparison among
gapdh-1 orthologues, the three exons 3, 4, and 5 of human, chicken and fish gapdh-1s are merged into either two (exons 3 and 4 in rat) or one (exon 3 in
mouse) larger exon(s) in murine gapdh-1s. As similarly, two exons 6 and 7 in human, chicken and fish gapdh-1s appear in a larger, merged exon in murine
gapdh-1s (exon for mouse and exon 5 for rat). On the other hand, the largest exon of human gapdh-1 (exon 8) is divided into multiple smaller exons in
other orthologues (two exons for murine gapdh-1s [exons 4 and 5 for mouse and exons 6 and 7 for rat], and four exons 8-10 for chicken and fish gapdh-1s).
However such an exon rearrangement (i.e., merge/separation) is not observable between gapdh-2 (or gapdh-s) orthologues.](http://oak.go.kr/repository/journal/12997/E1HKAL_2013_v16n4_291_f002.jpg)