Acidification of precipitation caused by human activities has become one of the most serious problems in natural ecosystems (Berg and Laskowski 2006). Acid rain influences on terrestrial plants performances include cation-loss or nutrient-loss from leaves (Proctor 1983, Liu et al. 2007), change in the gas-exchange rate through stomata on leaves (Evans et al. 1982, Hermle et al. 2007), germination (Lee and Weber 1979, Raynal et al. 1982), and plant growth (Wood and Bormann 1974, Neufold et al. 1985, Reich et al. 1987). In addition, acid rain is known to change the soil chemical status and function of the decomposer community, often leading to imbalances in nutrient cycling, litter decomposition, and productivity of the ecosystem (Pennanen et al. 1998). It resulted in poor soil fertility, and the harmful effects on plant growth by leaching of toxic soluble Al (Wood et al. 1984, Matzner et al. 1986, Osonubi et al. 1988), and releases such as Ca, Mg, and K from the solid phases of soil into soil solution (Batty and Younger 2007, Zhang et al. 2007).
In terrestrial ecosystems, the litter decomposition carried out by microorganisms is one of the most important processes in decomposer subsystem. In particular, strong reductions in microbial activity are easily detected when low pH acid rain is applied (Bååth et al. 1979, Bewley and Parkinson 1985, Fritze 1992, Myrold and Nalson 1992, Rousk et al. 2009). The essential nutrient (K and Mg) released from plant litter were found to be affected by low pH (Holvland et al. 1980, Batty and Younger 2007, Berg and Laskowski 2006), while decomposition of plant litter showed no significant effect of the acid rain. In addition, Ouyang et al. (2008) suggested the mineralization of soil organic C was not related to pH level. On the other hand, Berg and Laskowski (2006) demonstrated that such changes in litter, leaving larger recalcitrant remains, may lead to changed decomposition patterns, which should decrease the extent of organic matter decomposition in ecosystems and cause a higher humus accumulation rate.
Most studies on the effect of acid rain noted that the species of acid-tolerant fungi and bacteria have shown increased activity in plant litter decomposition in terrestrial environments (Gross and Robbins 2000, Reith et al. 2002), and the effects of the pH gradient on microbial community structure and the patterns were demonstrated (Frostegård et al. 1993, Bååth and Arnebrant 1994, Bååth et al. 1992, 1995, Pennanen et al. 1998, Bååth and Anderson 2003, Stemmer et al. 2007, Högberg et al. 2007, Rousk et al. 2009).
Several techniques have been used to identify fungal and bacterial groups in soil. One of the most commonly used methods is the selective inhibition technique (Anderson and Domsch 1973) based on inhibition of the substrate-induced respiration (SIR) using antibiotics that inhibit bacterial and fungal respiration (Bååth and Anderson 2003), thymidine incorporation technique (Bååth and Arnebrant 1994), and by analysis the ester-linked phospholipid fatty acids (PLFAs) composition of the soil, since different subsets of the community have different PLFA patterns (Bååth et al. 1995). Frostegård and Bååth (1996) suggested that a fungal/bacterial biomass ratio could be estimated by using the PLFA 18:2v6,9 as a measure of fungal biomass and the sum of 13 bacteria specific PLFAs as a measure of bacterial biomass (Bååth and Anderson 2003, Frostegård et al. 1993).
The aim of the present study was to assess the effect of simulated acid rain on plant litter decomposition processes in a microcosm environment. The leaf litter samples were treated periodically with simulated acid rain, which was made using sulfuric acid, and retrieved for the determination of weight loss and microbial biomass, microbial community structure, and microbial activities on the decomposing litter. Microbial biomass and microbial community structures on the leaf litter were determined by SIR and PLFA methods.
>
Microcosm Design and Litter Decomposition
The study used 1 L colorless glass bottles with detachable lids which have 9 mm diameter holes filled with 300 g of clean quartz sand. The quartz sand contained 90% water holding capacity by adding deionized water to maintain constant moisture in the microcosm bottles. Approximately 4 g of litter samples were soaked in distilled water for 1 h, and then placed on top of the sand in the microcosm glass bottle, and incubated at constant 23℃ and 40% relative humidity.
The simulated acid rain of pH 3, pH 4, and pH 5 were made by dilution of sulfuric acid in deionized water. After 16 days of 10 ml fresh soil suspension solution addition, 10 ml of simulated acid rain of each pH level applied to each experimental treatment group, and additional artificial acid rain water supplied at twice a week as much as the same amount of evaporated water from the microcosm until the end of experiment. The four replicated litter samples were carefully retrieved from microcosm after 80 and 160, and 290 experimental days. Retrieval fresh litter samples from microcosm use to measure the mass loss measurement and microbial biomass and microbial community analysis.
Fungal, bacterial and total microbial biomass C (Cmic) were determined by the SIR technique of Anderson and Domsch (1978) with modifications by Beare et al. (1990). Four subsamples (0.5-1.0 g dry weight equivalent) of each litter sample were weighed into 100 ml serum bottles and incubated at 4℃ for 12 h with 2.5 ml microbial respiration inhibitor per gram of litter sample. Cycloheximide (16.0 g/l) and streptomycin (3.2 g/l) for fungal and bacterial respiratory inhibitors were used, respectively. Deionized water was added instead of microbial inhibitors for control treatment. All treatments had 2.5 ml/g glucose solutions (16.0 g/l) added as a substrate and were immediately flushed with CO2-free gas, sealed tightly, and incubated at 23℃ for 2 h. The CO2 concentrations in the bottles were measured by infrared gas analyzer (IRGA) after incubation.
Microbial biomass-C was calculated according to the equation of Beare et al. (1990) as follows:
Fungal biomass (μg C/g dry weight) = 231.5+ 17.3 (μg CO2-Cfungal g-1 dry weight h-1)
Bacterial biomass (μg C/g dry weight) = 188.3+15.5 (μg CO2-Cbacterial g-1 dry weight h-1)
Total microbial biomass-C (μg C/g dry weight) = -765.1 + 14.3 (μg CO2-Ctotal g-1 dry weight h-1)
>
Microbial Community Structure
PLFAs were extracted and analyzed according to the procedure described by Wilkinson et al. (2002). Fresh litter samples were freeze-dried and ground to less than 10 μm by blender. 250 ± 1 mg of freeze-dried litter sample was extracted by addition of 1.6 ml of potassium phosphate (50 mmol/l, pH 7.4), methanol (4 ml) and chloroform (2 ml) in 25 ml glass tubes. The tubes were vortexed for 30 s and sonicated for 2 min prior to incubation in a water bath at 37℃ for 30 min. The tubes were shaken for 2 h horizontally, and then the supernatant liquid transferred to a 50 ml separatory funnel, and chloroform (4 ml) and water (4 ml) were added to the separating funnel. The chloroform phase was collected, reduced in volume by rotary evaporation, and fractionated by chromatography on silicic acid (mesh size 200–400). Neutral lipids and glycolipids were eluted with chloroform (3 ml × 2) and acetone (3 ml × 2), respectively. Polar lipids were eluted with 3 ml × 2 methanol and collected in glass test tubes. The solvent was evaporated under a stream of oxygen-free N2, and the residue subjected to alkaline methanolysis by vortexing for 30 s in a mixture of 2 ml of 0.2 M methanolic KOH and toluene:methanol (1:1, v/v) solution, and followed by incubation at 37℃ for 30 min. After cooling, the mixtures were neutralized with 1 mol acetic acid and fatty acid methyl esters (FAMEs) extracted twice by 2 ml of chloroform:hexane (1:4, v/v). After evaporation of the solvent under oxygen-free N2, the FAMEs were re-suspended in chloroform:hexane (1:4, v/v) containing 15 μg nonadecanoic acid methyl ester (Sigma Chemical, Poole, UK) as an internal standard. FAMEs were quantified by gas chromatography mass spectrometry& Hewlett Packard HP6890 Gas Chromatograph (Hewlett Packard, Palo Alto, CA, USA) equipped with a DB-5MS column (0.2 mm [inner diameter] by 25 m& 0.25 μm film thickness). A splitless injection was employed (injector at 300℃), and the oven was maintained at 60℃ for 1 min after injection. The oven temperature was then increased to 150℃ at 30℃/min and maintained for 4 min, followed by an increase to 250℃ at 4℃/min and held for 15 min. Finally, the oven temperature was increased to 300℃ at 25℃/min and held for 6 min. The transfer line was held at 280℃ throughout. Helium was used as the carrier gas (0.8 ml/min). FAMEs were identified by retention time and/or electron ionization mass spectrometry, HP6890 Mass Selective Detector (Hewlet Packard).
Bacterial biomass was estimated from the summed concentrations of the following PLFAs:
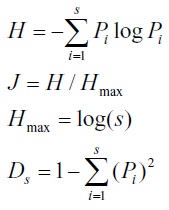
The Shannon–Wiener index (Shannon 1948), Simpson’s diversity (Simpson 1949) and Evenness were generally defined as follows: where
Differences between samples, in regard to litter mass loss, and microbial biomass were analyzed statistically using a one-way ANOVA followed by a Turkey’s Honestly Significant Difference (HSD) test. For each value, linear correlations of coefficients were provided. All statistical work was performed with SPSS ver. 17.0 (SPSS Inc., Chicago, IL, USA).
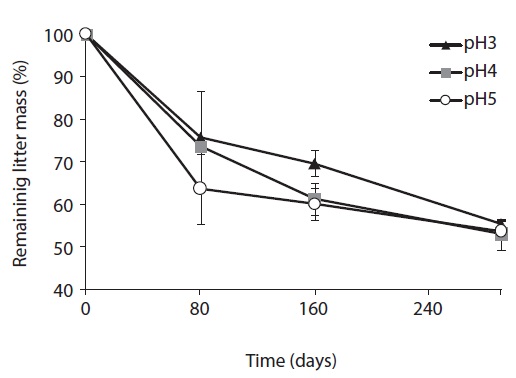
The litter decomposition was the slowest at pH 3 treatment, and the most rapid at pH 5 treatment in the early and mid-stage of decomposition (Fig. 1). In the early stage of litter decomposition, mass loss at pH 5 was 38.5%, and 26.7% at pH 3. The decomposition rate between pH 3 and pH 5 showed significant difference (
>
Microbial Biomass Determined by SIR
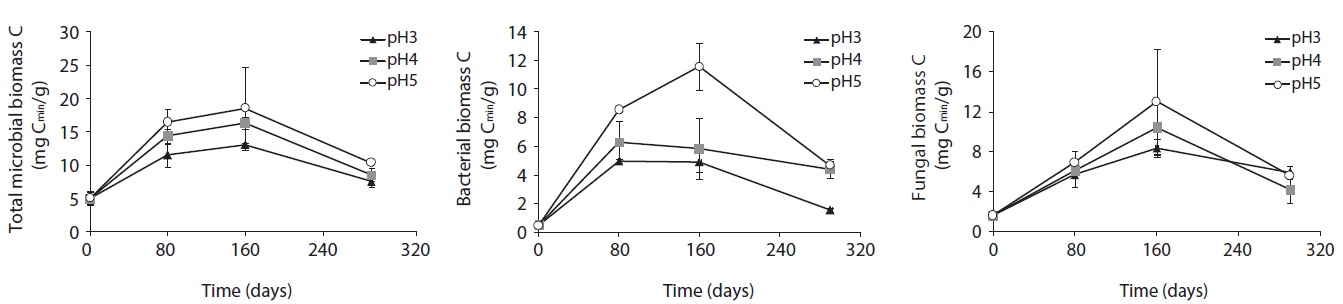
The microbial biomass, determined by SIR method, of decomposing litter samples treated with different acidity of artificial rain are presented in Fig. 2. The microbial biomass decreased with increasing acidity, showing the smallest at pH 3 and the largest at pH 5 treatment. The microbial biomass increased with decomposition proceeds and showed peaks at mid-stage decomposition and decreased at the late stage.
After 160 days decomposition, the mid-stage of decomposition, total microbial biomass-C was measured as 12.97 mg Cmic/g litter at pH 3, 17.39 mg Cmic/g litter at pH 4, and 23.25 mg Cmic/g litter at pH 5. Bacterial biomass increased from 4.95 mg Cmic/g litter to 8.94 mg Cmic/g litter from pH 3 to pH 5 at 80 days, and 4.88 mg Cmic/g litter to 11.57 mg Cmic/g litter at pH 3 to pH 5 at 160 days after treatment. Fungal biomass increased from 5.69 to 6.92 mg Cmic/g litter from pH 3 to pH 5 at 80 days, and then, after 80 days from 8.38 to 11.85 mg Cmic/g litter from pH 3 to pH 5. Unlike fungal biomass, bacterial biomass sharply increased at the initial decomposition stage, and slowly decreased or plateaued after the early stage of decomposition in low pH treatments.
Consequently, in the early decomposition period, the fungal biomass was the same as the bacterial biomass, especially at low pH; however, the fungal biomass dominated on the decomposing litter at the mid-decompositional stage. Although bacterial and fungal biomass decreased with decreasing acidity, the simulated acid rain affected bacterial biomass more than it did fungal biomass. In other words, fungal biomass was more stable in acidic conditions than bacterial biomass.
>
Microbial Community Structure on the Decaying Leaf Litter
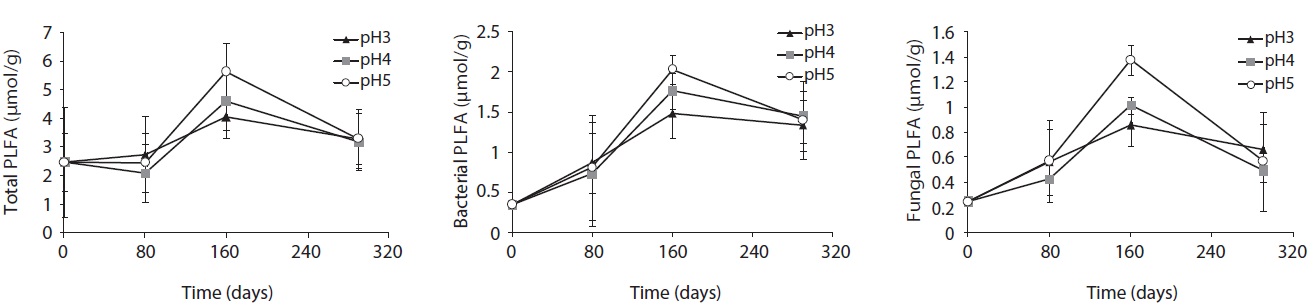
Microbial PLFA profiles of decomposing
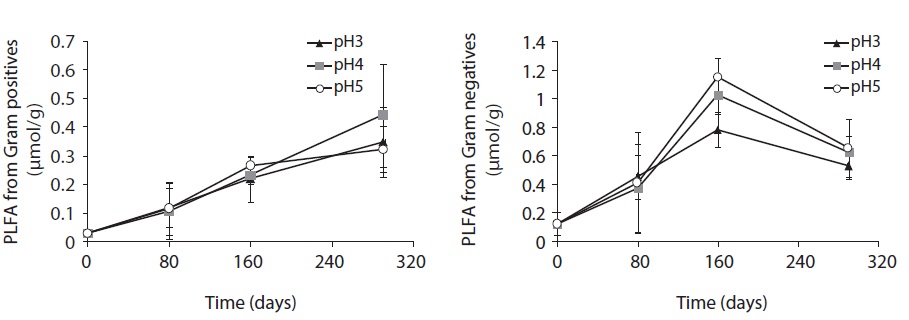
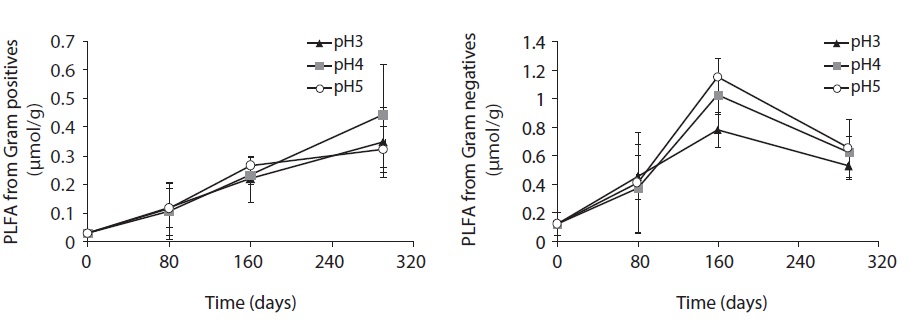
Each PLFA marker showed a different pattern of responses at different pH treatments and decomposition stages. PLFAs of gram positives almost linearly increased with increasing pH; however, the PLFAs of gram negatives also showed increasing patterns at the early and midstages of decomposition then rapidly decreased at the late stage (Fig. 4).
As the process of
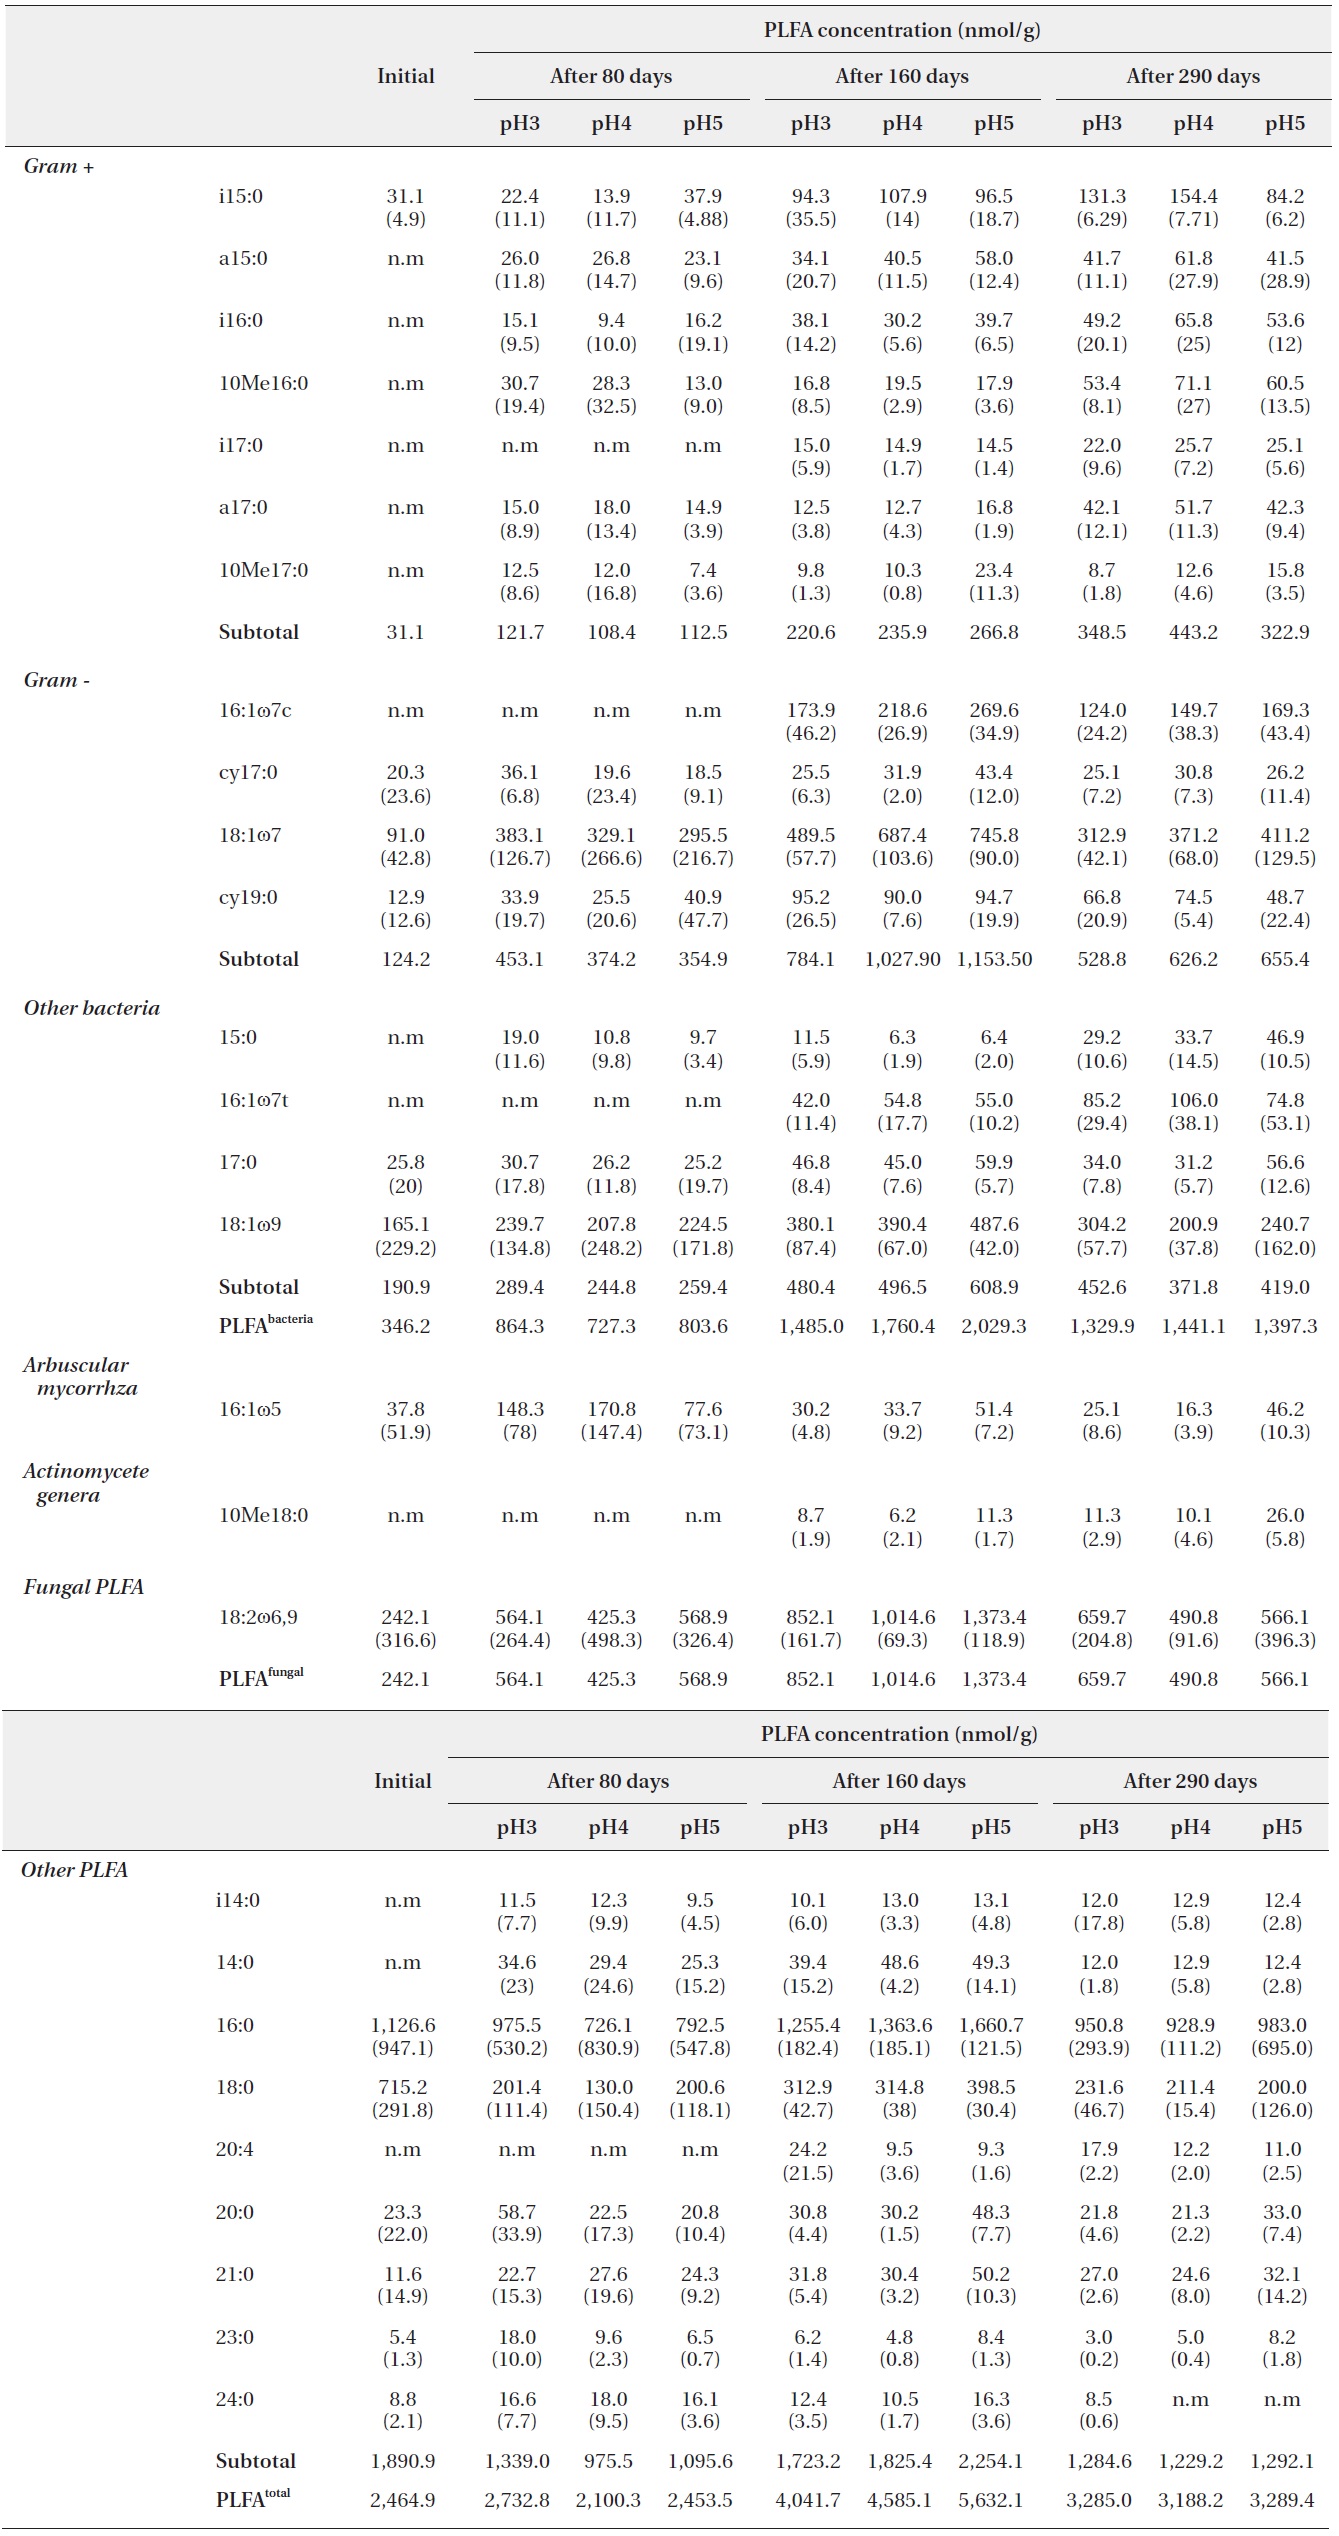
The number of PLFAs on the decomposing leaf litter samples was increased with decomposition processed
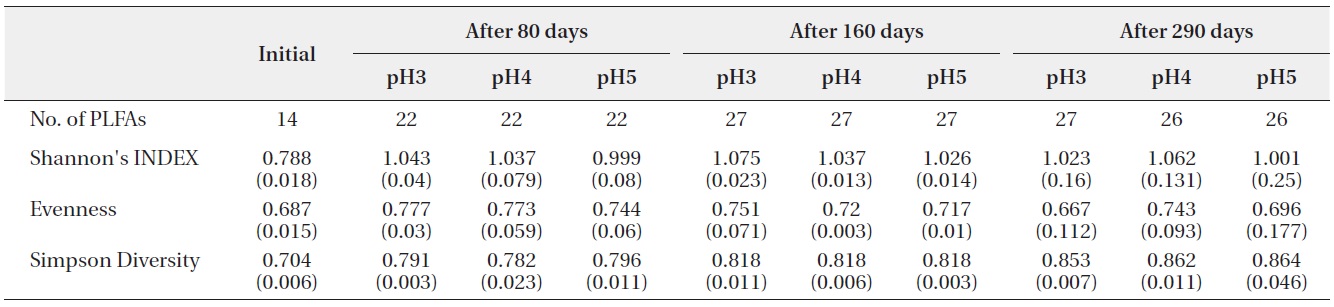
(Table 2). Fourteen kinds of PLFAs were presenting the initial decomposition litter sample just before the artificial rain treatment. The number of PLFAs was increased to 22 after 80 days, 27 after 160 days, and 26-27 after 290 days. However, the diversity indices and evenness indices at different pH treatment and between litter decomposition stages showed no significant differences although Simpson diversity indices slightly increased with decomposition time elapsed. These results suggested that there were large amounts of displacement of microbial taxa according to pH treatment and proceeds of litter decomposition.
Litter decomposition mainly performed by soil microbial activities plays very important roles such as nutrient cycling in the natural ecosystems. In addition, many processes of litter decomposition were influenced by physicochemical environments and chemical contents of leaf litter (Heal et al. 1997, Zimmer 2002, Sariyildiz and Anderson 2003).
The result of this study showed a remarkable decrease of leaf litter mass loss especially at early and mid-stages of decomposition with artificial acid rain treatment, confirming
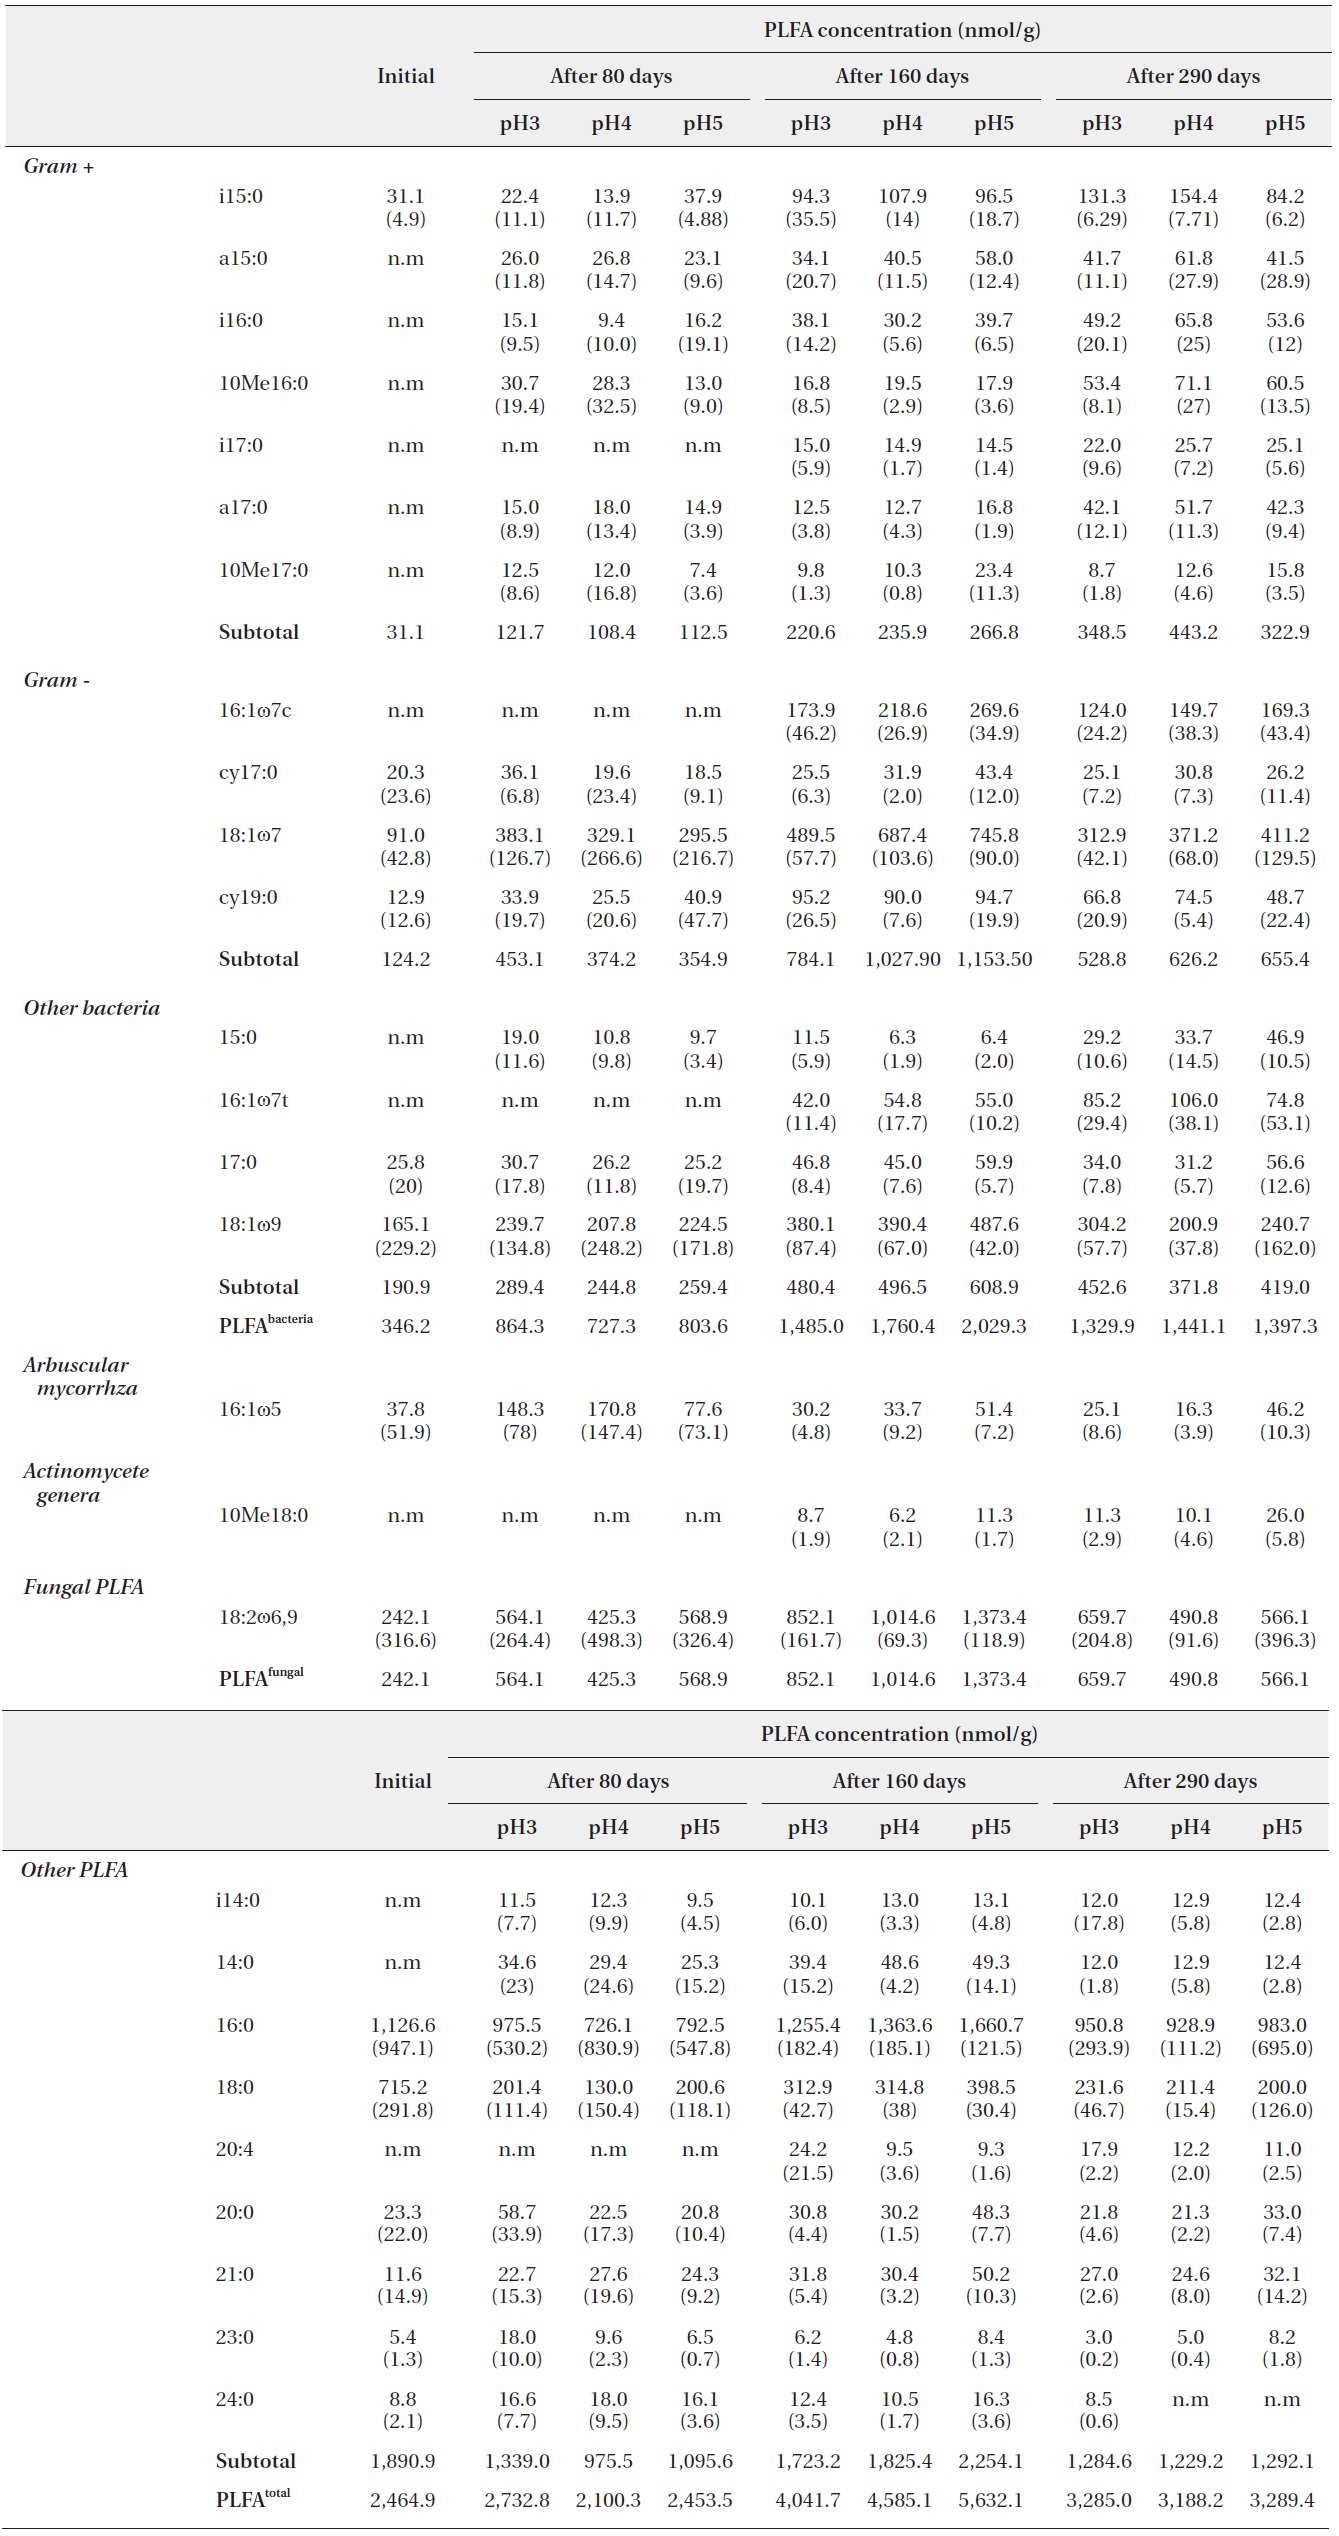
PLFA profiles of the decomposing S. alnifolia litter samples treated with simulated acid rain in the microcosm. Values are means of total PLFA concentrations (nmol/g), standard deviation in parentheses, and n.m is not measurable

Shannon?Wiener index, Simpson’s Diversity and Evenness (J) of PLFAs in microbial community on the decomposing S. alnifolia leaf litters. Values are means of four replicates, standard deviation are in parentheses
the results of Rechcigl and Sparks (1985), and Wolters (1991a, 1991b). These decreased litter mass losses suggested that acidification inhibits the growth or activities of micro-decomposers, Berg and Laskowski (2006) reported that acidification may affect the decomposition process directly through the effect of H+ ions on some decomposers and deterioration of soil conditions for others.
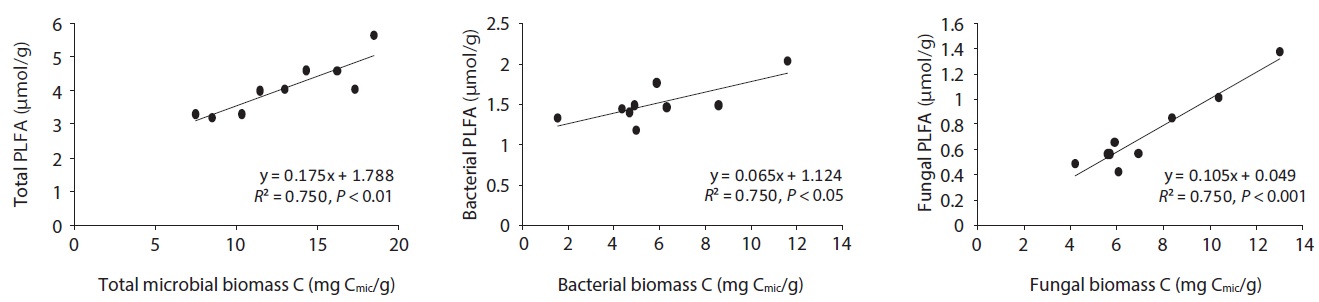
The microbial community structure on the decomposing litters is very complicated and highly sensitive to physico-chemical environmental changes; in addition, there are many methods for identifying soil microbial taxonomic groups and community structures. SIR and PLFAs were comparatively simple methods of quantifying microbial groups. Bååth and Anderson (2003) found good linear correlation between the total microbial biomass estimated with SIR and total amount of PLFAs, indicating that 1 mg biomass-C was equivalent to 130 nmol of total amount of PLFAs. The present results also showed that the
concentration of PLFAs had positive relationships with microbial biomass of SIR (Fig. 5). Total microbial biomass of SIR and total amount of PLFAs has
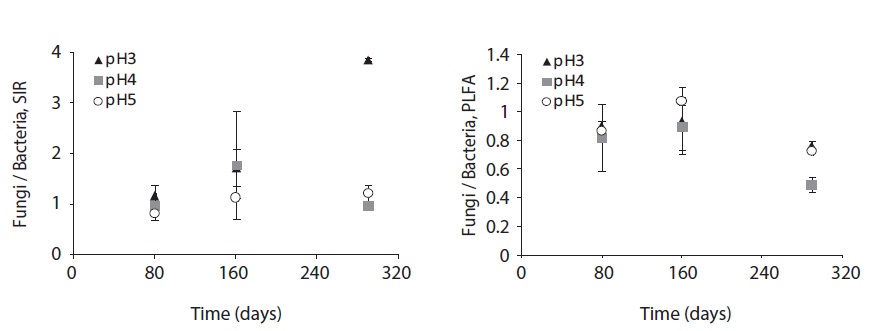
The fungal and bacterial composition determined by SIR and PLFA at the decomposing litter changed by acid treatment and litter decomposition stage (Fig. 6). The fungi/bacteria ratio by SIR and PLFA showed different pattern. These results might be due to the microbial state, for example sporulation, another nonliving deliberation such as humic acid (Nielsen and Petersen 2000), and the ability of response to the nutrient such as glucose (Bailey et al. 2002).
The SIR fungi/bacteria ratio increased throughout the decomposition process; however, at pH 4 the ratio decreased at the late decomposition process. On the other hand, the fungi/bacteria ratio by PLFA was below 1 at low pH treatments and decomposition stages, though the ratio dramatically decreased at the late stage of decomposition at pH 4 and 5 treatment.
The fungi/bacteria ratio by SIR was higher than that by PLFA which was always below 1. Especially in low pH treatment, the fungi/bacteria ratio increased dramatically. Bååth and Anderson (2003) argued that the fungi/bacteria ratio measured using the selective inhibition technique decreased significantly with increasing pH from about 9 at pH 3 to approximately 2 at pH 7. These results indicate that low pH facilitates respiration or growth of microbial groups that are not inhibited by fungal inhibition agent. On the other hand, the fungi/bacteria ratio by PLFA showed smaller differences between pH treatments as decomposition proceeded. This result demonstrates the fungal predomination at early stage of litter decomposition and bacterial predomination at later decomposition stages.
Bååth et al. (1995), Bååth and Arnebrant (1994), Pennanen et al. (1999), and Arao (1999) also reported that
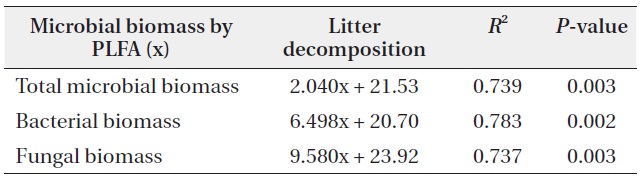
The relationships between litter decomposition and three microbial biomass parameters present in the decaying leaf litter from the different simulated acid rain pH treatments, taken at 23℃ and at constant humidity
when they increased the pH of soil by treatment with lime and ash, bacterial biomass and fungal biomass were decreased at higher pH levels while the fungal biomass decreased by a comparatively larger amount than bacteria at higher pH levels.
In addition, the PLFAs of each microbial group in the study differed in response to varied pH, similarly to in previous studies (Bååth et al. 1979, Mancinelli 1986, Bewley and Parkinson 1985, Esher et al. 1992, Fritze et al. 1992). Frostegård et al. (1993) found a three-fold increase in the fatty acid 16: 105 in the plots with the highest pH. An increase was also found for the fatty acids i14:0, 16:lω9, 16:lω7c, cy17:0, 18:107, i17:0, a17:0, cy19:0, 18:lω7, and 10Mel8:0 and no effect on 18:2ω6. In the present study, the PLFA of 16:lω7c, 18:107, i17:0, a17:0, 18:lω7, and 10Mel8:0 were also increased as pH increased.
The mass losses of
There were complementary relationships among microbial groups in the changing environment. Even though the microbial biomasses in the decomposing litter were the same among the different pH treatment, the microbial species composition (e.g., bacteria to fungi) could be different. Moreover, there is functional redundancy of microbial groups with the changes in environment (Rousk et al. 2009). Changes in species composition within community occurred by environmental changes because each species has its own tolerance range, the acid rain did not significantly change soil pH, and little impact on soil microorganisms and mineralization rate was found (Stemmer et al. 2007). However, most studies reported that there are complementary microbial shifts between bacterial and fungal groups (Rousk and Bååth 2007).
Consequently, the active microbial population dominating in a given soil system is adapted to the conditions of that system, including its pH (Berg and Laskowski 2006). The conditions of that decomposition subsystem are easily changeable by anthropogenic activities. Acid rain effects soil biotic processes such as CO2 production, microbial biomass in the organic layer, and leaching of NO3- (Wolter 1991a, 1991b, Lim et al. 2011); consequently, the soil acidification due to anthropogenic activities may be too fast for microbial communities to adapt to new, changed conditions (Berg and Laskowski 2006).