

The market approach is recognized as a reasonable valuation method. In technology valuation, this method is used to estimate the market value of intangible assets by performing comparative analysis of intangible assets of technology. These are subject to evaluation and technological intangible assets that are traded after analyzing similar technologies traded recently or in the past. Korean International Financial Reporting Standards (K-IFRS) have been applied to investment companies related to listing companies since 2011. The domestic valuation sector has faced as situation in which it should follow recommendations of the valuation method based on market value basis by focusing on present-centric price of market value rather than past-centric buying cost. Considering both international and domestic influence, the Ministry of Knowledge Economy developed a guideline for applying technology valuation standards and enforced it beginning 20 September 2011. Based on the Technology Transfer and Commercialization Promotion Act, the guidelines pursue objectivity and efficiency of valuation execution with the objective of facilitating valuation of the domestic market. According to the guideline, application of the market approach should precede others in cases where similar prices of technology of similarity are observed in the market at the time of valuation. This requires documentation in the form of a valuation report on other valuation approaches the reasons for which they are presumed suitable. Therefore, it is necessary to develop practice-oriented valuation models in line with various valuation purposes and measures to secure confidence in valuation outcomes based on cases of past technology transactions.
In reality, however, it is difficult to apply the market approach because of the unavailability of information on technology transaction cases in addition to the non-publication of trade conditions, which is because of characteristics of technology trade. Therefore, to utilize the market approach effectively, it is necessary to secure highly reliable information about cases based on technology transfers by relevant and private organizations both at home and abroad. Comparability issues between two technologies must be solved when there is insufficient information on transactions of similar technologies in which technology assets are subject to valuation. Hence, the establishment information of transactions satisfying international standards and active market conditions in the aftermath of IFRS introduction is necessary. Therefore, this study develops a methodology that is able to execute valuation by assessing the comparability of technology assets subject to valuation and existing trade information.
1. Market Approach to Technology Valuation
Smith (2009) suggested that the market approach is the most direct and trustworthy method when reliable transaction data on similar technologies are available. Frey and Oehler (2009) pointed out that it is not possible to secure relevant information because comparable transaction information is classified as confidential, such as valuation of patent technologies. These are intangible assets based on technologies so that, in reality, most valuations of patent technologies measure fair value by using non-observable input information on the income approach. In this vein, market participants have continuously made complaints above reliability demands for estimated fair values.
In a supportive study, Shin et al. (2005) pointed out that the application of the market approach would be difficult in technology valuation because it is practically impossible to identify transaction cases similar to the technology subject to valuation. This situation reflects the reality that the market approach is not considered the best selection method because of the limited resources allocated and the time used to identify available data and similar transaction cases for valuation.
In addition, in the case suggested by Chiesa et al. (2005), a patent technology was evaluated to determine which was more non-invasive in cardio surgery than other conventional products required for an aortic cannula, which minimize clotting in the aorta by adding flexibility at the end of the cannula in order to ensure the functionality of the heart. In this case, even though it opted for the market approach as a suitable valuation method, it estimated the potential unit price of new products based on products of conventional functions and potential market penetration volume for technology valuation. Hence, this method resembles the income approach. Therefore, in overcoming the major limitations of the market approach, it is difficult to identify cases for technology valuation through comparison with similar transaction cases.
Consequently, most valuations apply income approaches. Many studies focused on major valuation criteria such as the economic life expectancy of technology (Yu et al., 2005; Kim et al., 2011; Park et al., 2011; Kim et al., 2012), potential added value cash flow in the future (Kim et al., 2001; Seol, 2010; the Ministry of Knowledge Economy, 2011), discount rate (Sung, 2002, 2008; Ballwieser and Wiese, 2010; Hanlin and Claywell, 2010; Jun et al,, 2011), and technology contribution (UNIDO, 1983; Park et al., 2002; Korea Invention Promotion Association, 2003; Razgaitis, 2009).
Among the comprehensive guidelines for the market approach execution proposed by Pratt (2005), the U.S. Securities and Exchange Commission and the database of companies related to intellectual asset valuation and licensing (e.g., AUS Inc., Business Valuation Resources, LLC) are mentioned as a method to secure market transaction case data when searching methods and analysis for comparable market transaction cases. The Korea Invention Promotion Association (2005) laid the foundation for application of the market approach by conducting from 1996 to 2002 a survey and analysis on 203 current royalty technology transaction cases out of a total 751 technology introduction transaction cases according to industry and technology area. However, the figure is not sufficient for transaction cases in which the comparability of existing similar assets and the issue of comparability in transaction cases and confidentiality of analysis outcome remain unsolved.
Kang et al. (2011) proposed a method for the valuation of technology and similar patent technologies by simultaneously measuring the similarity of patent classification codes and text keywords based on similar patent claims. The method positioned them in identical domains and then visualized them in a two-axis mode. In addition, Kim et al. (2012) introduced the two-axis mixed similarity measurement model suggested by Kang et al. (2011) as a way to measure similarity to see whether conventional patents similarly subject to valuation were traded in the market or not. However, there were difficulties in the application of the effective market approach. A further limitation of this study was the difficulty in acquiring information about transaction prices. Even technology registered for patents did not have information on transaction prices, which was a consequence of licensing. Worse still was that a comparison of transaction cases could not be made when the technology subject to valuation was not protected by law (i.e., non-patent registration technology)
2. Application to Market Approach
Shin et al. (2005) proposed that the concept of the market approach is that it could be used for the valuation of future profits generated by a specific technology. The method uses the transaction prices normally formed by trade parties with sufficient information about the market value. In other words, it refers to a valuation method that compares and reviews the transaction prices of similar assets. This method is used by parties with intentions to purchase and sell. Smith et al. (2000) suggested the following conditions are necessary to apply the market approach: first, the existence of a market with active transactions of comparable assets; second, a transaction history of comparable assets; third, availability of information about transaction prices of comparable assets; and fourth, transactions of independent parties. These conditions are necessary to establish methods for performing information surveys and analyses of technology transaction cases. Therefore, to ensure the effective application of the market approach, a valuator needs both to judge the rationality of comparability and to adjust various factors of real transactions to enhance the similarities of the technologies subject to valuation and the existing cases of technology transactions.
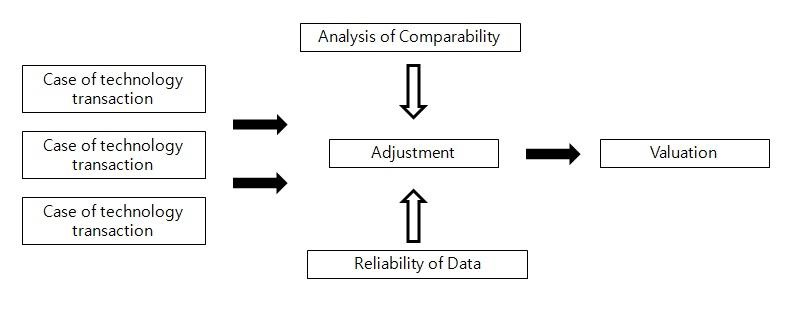
The general application procedures in the market approach are shown in Figure 1.
In these procedures, the selection of comparable subjects is important. Furthermore, confirmation of the homogeneity of the selected subjects and the technology subject to valuation is an important process in enhancing similarity. Here, adjustment to comparison with discount and surcharge might be required. Finally, licensing compensation should be compared under identical conditions by taking into account transaction conditions and structures.
2.1 Comparability
With regard to the application of the market approach to intellectual properties, securing comparability is difficult. The transaction prices of these assets do not have reference values as long as the comparability is secured even if the transaction prices of certain patents and trademarks are available. In a study on the comparability of intellectual properties, Smith et. al. (2000) and Hyun (2000) proposed important considerations, such as industry line, level of market share, profitability, new or old technology, level of entrance wall, generation capacity for income flow, possibility of legal protection, and economic life expectancy. Considering the extremely low possibility of available information about these factors, the practical applicability of this approach should be reconsidered.
2.2 Adjustment
With regard to valuations using the market approach, an active market of various asset transactions should be formed. The information about technology transactions (licensing compensation) that is secured from such active markets can enhance comparability and similarity with the technology subject to valuation. In addition, there is a high tendency of trade partners to sustain the confidentiality of their technology transactions because of business competition. Nevertheless, transaction contents should be available to the public so that the market approach can be applied effectively. In the application of the market approach to the technology trade market, there are practical difficulties in satisfying conditions for the open market. Because of these realistic limitations, many cases have difficulty identifying conventional trades with technology that is subject to valuation. Hence, adjustment procedures based on similar transactions are required. Factors that should be considered in the adjustment procedures include the timing of the technology transaction and adjustment considering the value change in the licensing compensation over time (Gordon et al., 2000). Hence, it is necessary to prioritize information about similar technology transactions that have occurred recently. Finally, adjustment is required for comparing discount and surcharge; here, identical trade conditions should be reflected in the valuation structure.
2.3 Valuation
The market approach uses representative valuation methods: the sales transaction method, relief from royalty method, comparative income differential method, rule of thumb, and market replacement cost method (Jho et al., 2012).
a) Sales Transaction Method
This method estimates the value of intangible assets subject to valuation based on actual market transactions, which refer to the transactions of comparable or basic intangible assets as an arm’s-length transaction. If data is available, the sales transaction method is the most direct and systematic valuation method.
This method is composed of three stages: 1) assessment of comparative economic advantages and disadvantages from the perspective of intangible assets subject to valuation and individual markets; 2) confirmation and quantization of differences and related adjustment factors between similar or comparative subjects (guideline) transactions and intangible assets subject to evaluation; 3) estimation of valuation multiples and reasonable application of the multiples to financial variables of intangible assets subject to valuation, such as sales volume, operation profit, cost, and market share. The valuation multiples are estimated from the value index using the sales transaction method.
b) Relief from Royalty Method
This is a mixture of the income, cost and market approaches. In the income approach, the estimated royalty income is capitalized so that it is calculated into the value amount. Because the cost approach estimates the technology subject to valuation in relation to opportunity cost of royalty, it reflects the aspect of royalty cost avoidance. The owner of intangible assets does not need to pay the royalty cost, which should be paid when it is licensed from any third party. The rationality used in the cost approach considers the royalty cost, which should be burdened without ownership of intangible assets subject to valuation as the estimated value. The market approach estimates the value of the technology subject to valuation based on realistic information about transactions by utilizing information about the license compensation (royalty rate) being traded.
The relief from royalty method estimates the value of the technology subject to valuation based on royalty income, which refers to the amount generated when the technology is licensed in a fair trade. To apply this method, royalty of fair trade and the license contract are analyzed. The selected license transaction should be reflected in investment risk and profitability comparable to the technology subject to valuation. Multiply the projected net revenues that would be generated during the expected remaining durable years by the license royalty rate of the selected comparable subject. The outcome is the estimated value of royalty profits generated with the assumption of licensing of the technology subject to valuation. The income flow of the estimated royalty means that it does not need to be paid because the intangible asset is owned and it is capitalized. Consequently, the capitalized income amount might be considered the value amount pursuant to the ownership of intangible assets.
c) Comparative Income Differential Method
A valuator compares profits generated by two similar businesses (one with tangible assets and the other without tangible assets) based on information collected from the market. When the businesses generate substantial profits while sustaining consistency, the valuation of intangible assets might be made by applying the comparative income differential method. This method is applicable in technical intangible asset valuation of franchise contracts, trademarks, and patents based on brand.
d) Rules of Thumb
This method applies to intangible asset transfer within a specific industry. When the rules of thumb are widespread and applied, valuators cannot ignore them. The main feature of rules of thumb is that there is no reliable evidence of how they are developed and to which extent they are based on suitable, real data.
The weakness of the rules-of-thumb method is that it cannot explain differences in the valuation of business characteristics and assets. Moreover, this method is not able to distinguish environmental changes in companies in various industries by period. Thus, valuations do not reflect environmental change factors over time. In general, intangible technical assets are traded or licensed according to conditions instead of cash in most industries. Prices decided by rules of thumb are not cash equivalent in most cases. Because transfer conditions other than cash are specific to each transaction, it is desirable to assess the possibility applying other valuation methods. The rulesof- thumb method should be applied only when there is no alternative.
e) Market Replacement Cost Method
This method is used to estimate the replacement cost of technical intangible assets in the open market. The traditional market replacement cost is estimated from the owner’s internal information. The external estimation is well aware of the replacement cost of the technical intangible asset. When the estimation according to objective fair trade is available, the estimation might be considered a reliable replacement cost for the technical intangible asset, as derived from the market. After estimating the replacement cost, this method follows the analytical procedures of the cost approach on obsolescence factors, distinguishing intangible technical assets subject to valuation from their replacement cost.
This study focuses on the development of the market approach for application to the sales transaction method and the relief-from-royalty method, which have potential for utilization among the valuation methods described above. To this end, the information about existing technology transaction cases is organized. An analysis model for the application of the sales transaction method is then developed and finally the comparative adjustment method is used to discount and surcharge technology contributions (royalty rate) according to information about past transaction cases derived from similar outcomes of analysis.
Ⅲ. Survey and Analysis on Technology Transaction Cases
This study is the survey and analysis of actual transaction cases in the market and classifies them by both industry technology classification and Korea Standard Industry Classification. The objective is to develop a technology transfer of transaction system for the technology market by developing a standard for each transaction type and royalties ratio (royalty rate–market price of technology). The royalty rate established by the industry line can be utilized as basic data for technology valuation using the market approach with respect to technology negotiation, documentary taxation data for reasonable technology transfer income, and damage calculation for violation of rights.
1. Survey Method and Survey and Analysis Procedures
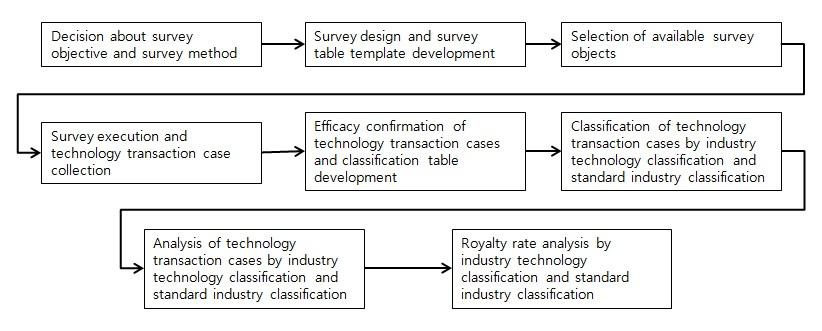
The survey subjects are public technology trade organizations (Korea Invention Promotion Association and Korea Technology Finance Corporation), private technology trade entities (12 companies) and technology transferrelated information listed in the register of patents as of August, 2012. Regarding the survey method, a survey of the sample public organizations and private technology trade entities was conducted from May 1 to August 30, 2012, as shown in Figure 2:
2. Survey Outcome and Analysis Method
A total of 1,131 cases were collected by surveying technology transaction cases from 15 relevant organizations. The survey was achieved through the cooperation of Korea Institute for Advancement of Technology (KIAT) and the survey result were obtained from the respondents in charge of technology valuation and trading in practice from each organization. For the survey on technology transaction cases, a survey table designed to fit the analysis contents of this study was used. In the execution process, the survey focused on the contents mandatory for this study because of difficulties in following the contents of the survey table. In addition, by defining in advance each classification table by industry technology classification, and standard industry classification, all the collected technology transaction cases were categorized by the tables. With regard to the classification table, the industry-line classification table, the industry-technology classification table, and the Korea Standard Industry Classification guidelines were used. Efforts were made to ensure meaningful outcomes of the analyses based on the survey tables.
The scope of comparable transaction information for technology transfer was determined with referring the performance survey from technology trade institutions managed by KIAT and the technology trade statistics provided by Korea Industrial Technology Association (KOITA). Also in order to obtain technology transfer information which market approach can be applied, the database for transaction information was built by filling out the form of technology transactions questionnaire survey and case information survey. This database provides the information such as license-out(license-in) company name, relationship between the contractor, license-out(license-in) technology title, patent registration(application) number, KSIC(Korea Standard Industrial Classification) code, application product name, duration of contract, transaction methods(transfer agreement, exclusive/non-exclusive license contract), method of payment and amount(transfer agreement, exclusive license contract and non-exclusive license contract), technology type(patent, industrial new design, design, semiconductor lay-out designs, technology capital goods, and information & know-how), degree of technology innovation, commercialization stage.
First, technology fee rate (royalties rate), standard information by industry technology classification, and standard industry classification were derived and the royalty rate was analyzed by individual industry technology and individual standard industry. Table 1 below shows the institutes and the total number of technology transactions surveyed by transaction type and private and public areas.
[Table 1] Technology transaction by organization

Technology transaction by organization
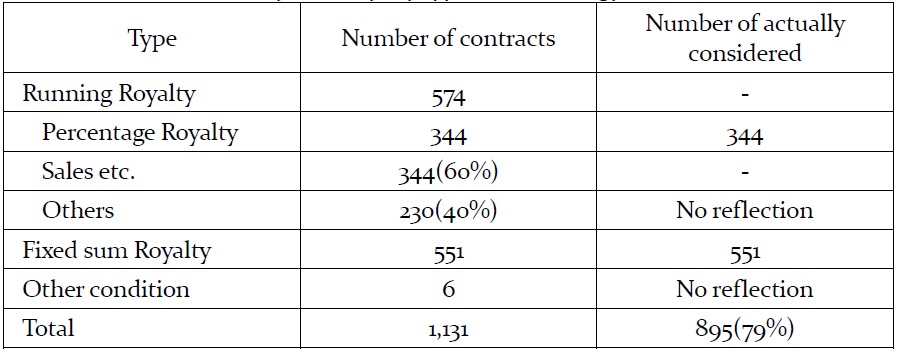
Finally, the technology transaction cases were analyzed and classified by payment condition type. Statistics were then developed. The payment condition types were analyzed according the classifications shown in Table 2 below. The royalty analysis of this study had final analysis objects of the sales volume, which were the criteria in most percentage royalty among running royalty cases.
[Table 2] Analysis of royalty type of technology transaction
Analysis of royalty type of technology transaction
Among the percentage of royalty cases, a total number of 344 technology transactions were based on the sales volumes.
Analyses of fixed-sum royalties and running royalties were conducted using industrial technology classifications and Korea Standard Industrial Classification (KSIC).
[Table 3] Industrial classification fixed-sum royalty and running royalty
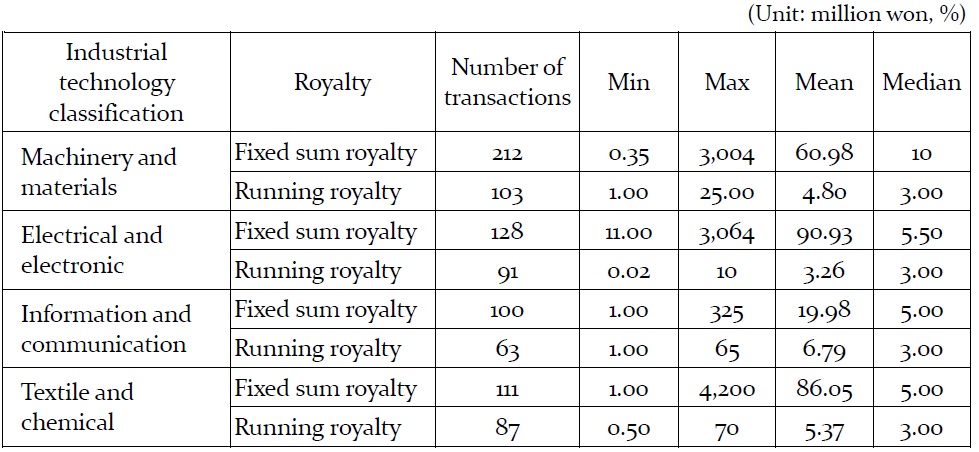
Industrial classification fixed-sum royalty and running royalty
[Table 4] Korea standard industrial classification fixed-sum royalty and running rate
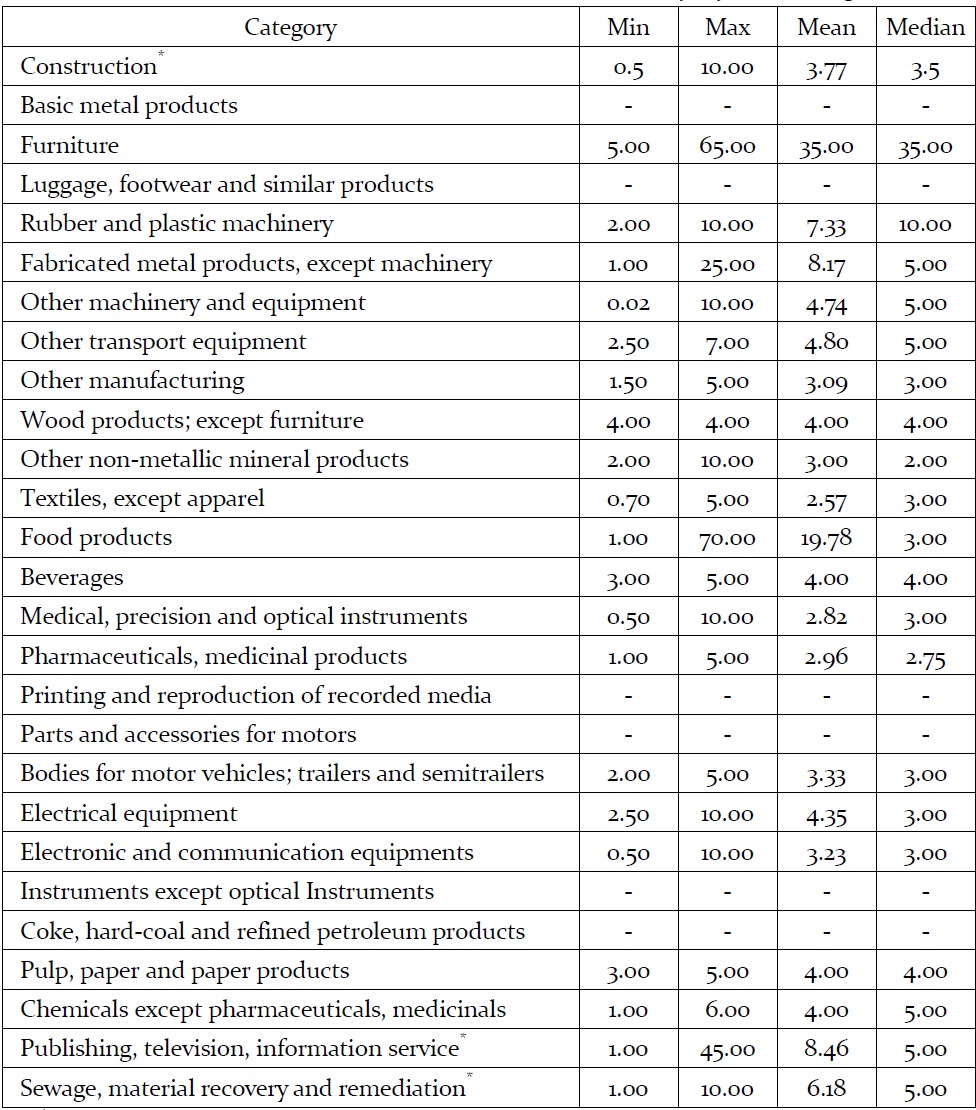
Korea standard industrial classification fixed-sum royalty and running rate
The statistical data were calculated based on four classifications: Machinery and Materials, Electrical and Electronic, Information and Communication, and Textile and Chemical, and 27 categories of large and middle classifications by KSIC. In particular, with regard to KSIC, statistics were calculated for industries with high numbers of technology transactions, such as construction, manufacturing, publication, movies, broadcasting and communication, information services, sewage and waste disposal, material recycling and environmental restoration.
In the case of the manufacturing industry, which has a relatively greater number of technology transaction cases, the middle category was used in the analysis. However, because the manufacturing industry has a variety of different businesses, there were many cases that did not fit each classification criterion. Hence, in these cases, the outcomes of fixed-sum royalty and running royalty analyses did not show relevant data. The outcomes are illustrated in Tables 3 and 4 below.
Based on the collected information, we identified the key factors to analyze the similarity between sales transactions which already had traded and target technology for valuating. And we also developed the method of similarity analysis according to each industrial technology classification. The above related contents will be introduced in the following paragraph.
1. Key Factors Required to Secure Comparability
The key factors and the outcome of applicability required to establish the comparability between sales transactions and target technology for taking valuation are presented in the following table 5.
Hyun (2000) proposed that the factor same as the standard industrial classification shown in table 5 had to be first considered important to establish comparability when considering the related data for sales transaction comparison. In addition to above elements, it was shown that the factors such as business type of license-out or license-in, relationship with license-in company, contract period, transaction method, payment amount(rate), technology type, degree of technology innovation, and commercialization phase can be used as the indicator for establishing comparability.
In case of the factor like license-in technology title, which is usually not open to public when technology transfer is trading between stakeholders and even if open, which cannot be usually applied as the indicator for establishing comparability since data type is qualitative(not quantitative). However, in the future if the related information same as the technology title is acquired more easily and also in terms of a systematic approach, the text-mining techniques for natural language processing are applied to check degree of similarity between traded technologies and target technology, the consideration for license-in technology title may be required as a fairly important factors.
[Table 5] Key factors to establish comparability
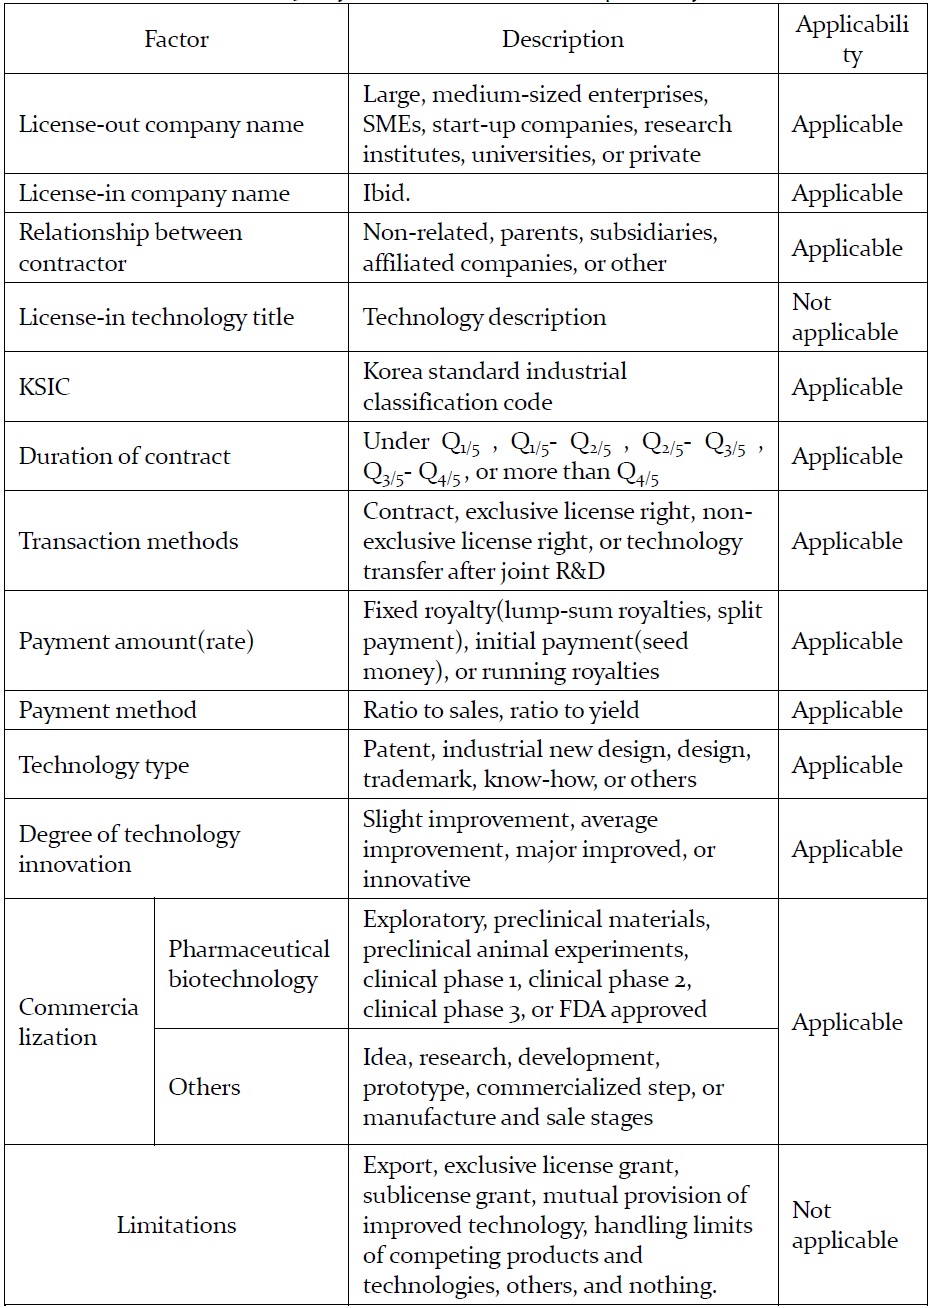
Key factors to establish comparability
The duration of contract was considered to be applicable as the indicator to secure comparability.
The factors such as duration of contract, payment amount(ratio), and commercialization stage were considered to be applicable as indicators to secure comparability but the factor such as limitations were not to be applicable since the royalties to be paid for necessary technologies could be correlated to factors such as the duration of the contract, the amount paid, and the commercialization stage as well as quantitative analysis could be available and factor like to limitations included a variety of qualitative data.
In order to rule out the influence factors having correlation within themselves, it should be analyzed in advance whether a relation of multicolinearity within independent variables for a factor analysis exists or not. As a result of this correlation analysis, the factors such as relationship with the contractor and payment method finally were excluded.
Especially, in this paper the method of a logistic regression analysis was applied to derive the significant factors affecting the relationship between the independent and dependent variables from sales transactions data. The main reason is that it cannot be assumed royalty distribution as a normal distribution and has an object to analyze the event-centric data like technology transfer agreements but not time series data, and lastly the reason not to use multinomial logistic model by classifying the royalty amounts into several categories is to resolve the limit that can only decide the significant factors after identifying rough royalty range of target technology in advance.
The significant factors were derived as the property variables for the similarity analysis through logistic regression analysis, and the set of dependent variable could be divided into higher or lower than the median value of transaction prices according to industrial classification based on the information of the royalty rate(amount) such as lump-sum and upfront dependent. The variable set for logistic regression analysis is displayed in the following Table 6.
The analysis outcome of logistic regression in fields of machinery and material, electric and electronic, information and communication, and textile and chemistry is shown in table 7 and finally the significant factors were derived according to each industrial category. When logistic regression was applied in this study, it was used that the forward option which adds one of significant independent variables to find the most appropriate model.
[Table 6] Variable set for performing logistic regression analysis
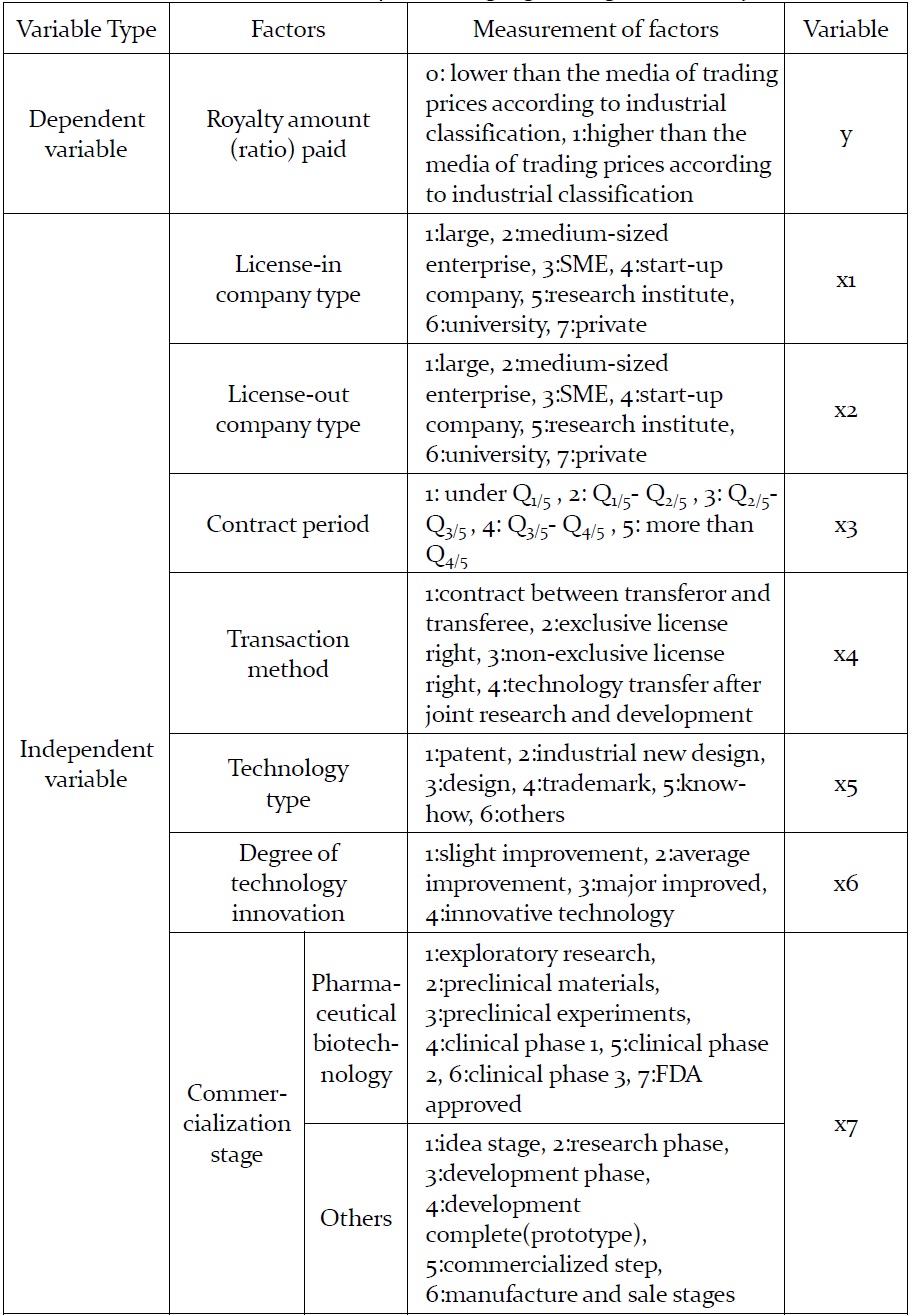
Variable set for performing logistic regression analysis
[Table 7] Significant factors by industrial category
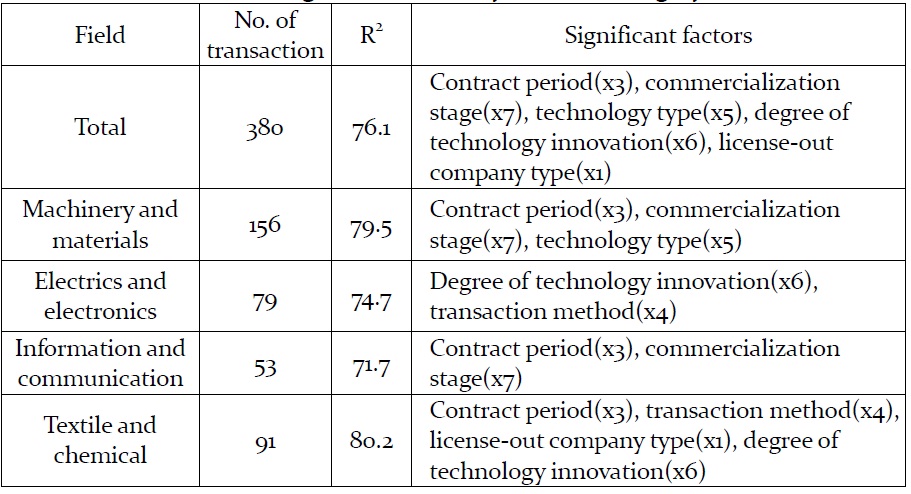
Significant factors by industrial category
3. Similarity between Sales Transactions and Target Technology
In order to analyze the association and similarity between each information of technology transaction already collected (A) and a new technology to be evaluated (B), the properties that both technologies to be compared hold should be identified and assigned their attribute values. In general, the similarity can be drawn not only by considering all of the attribute data but also by selecting collectively the attributes which can reflect the specific characteristics according to the categories by industry, products, or technology.
Based on the properties of the trade practices classified in accordance with the specific purpose (by industry, products, technology, etc.), the methodology for measuring the similarity can be utilized selectively, and generally two methods can be utilized that the Euclidean distance coefficient which calculates the distance between two objects within Euclidean space and cosine coefficient which checks the degree of match between the properties.
The technical properties for comparison in this study were utilized by considering the major influence factors that derived by main category of the industry classifications and the cosine coefficient that indicates the degree of match between the attributes was applied to verify the similarity between two objects including various attributes.
In order to assess the value of any particular technology licensing opportunity (a) on the basis of the major influence factors derived from the logistic regression analysis, we referred to the most relevant information with verifying the similarity between historical comparable cases (b) and technology licensing opportunities (a). It can be interpreted that the value of cosine coefficient is zero if the two objects(the target technology of valuation and sales transactions technologies) are completely different and is one if two objects having the same contents. As a result of the above interpretation, any particular technology licensing opportunity can be evaluated with reference to the information of past transactions having the value of cosine coefficient close to 1.
The major influence factors by each industry category shown in the Table 7 are expected to be somewhat difficult to be utilized as properties for comparing technologies by themselves since the technology trade cases are not enough to draw meaningful information and the data collected from existing sales transactions may include liquidation values of companies (or technologies). Consequently, the industry-specific properties for comparing the similarity between target technology and sales transactions were determined by considering the impact factors that derived from the entire and individual industry field together based on the results shown in the Table 7, and the final result is the below table 8.
[Table 8] Technology properties by industry classification
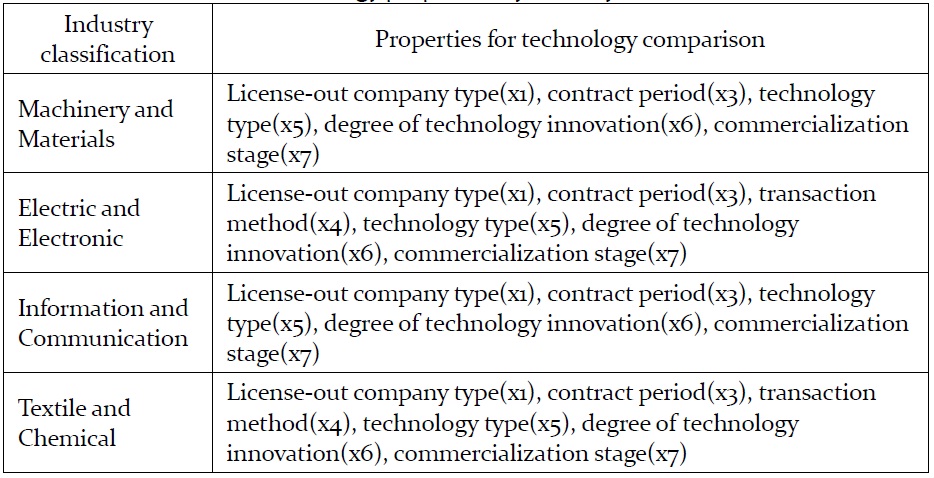
Technology properties by industry classification
The result displayed in the table 8 shows that the field of the Machinery and Material has the same properties with the sector of the Information and Communication and the attributes of the Electrical and Electronic are equivalent in field of the Textile and Chemical. Eventually it can be realized that the influence factors by each industry classification are not much different with those derived from the entire industry field. The below cosine coefficients are applied to each industry category.
- In cases of the Machinery and Materials and the Information and Communication:
- In cases of the Electrical and Electronic and the Textile and Chemical:
Where,
4. Deriving Sales Transactions Similar to Target Technology
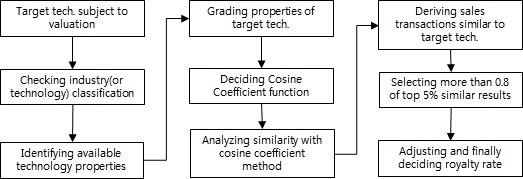
In order to draw sales transactions similar to the target technology to be evaluated, it should be identified whether the target technology can be classified as any industry of the fields such as the Machinery and Materials, the Electrical and Electronic, the Information and Communication, and the Textile and Chemistry, and the properties for measuring the similarity also should be determined according to the related category. After the available properties in accordance with the industry category of the target technology determined, then values of properties can be assigned with specific measures of each industry category. The properties by the industry category are described in the table 9.
After identifying the industry classification of target technology to be evaluated and assigning the related property values with referring to the above table 9, the value of cosine coefficient can be calculated through formulas described in section 4.3. At this moment it should be verified that the information with reference to royalty payments of similar transactions having a value of coefficient close to 1 and the final royalty of target technology can be produced by considering the maximum, average, and minimum royalty according to the transfer agreements or the exclusive/non-exclusive licenses derived from the similar trades.
[Table 9] Technology properties and specific measures by industry classification
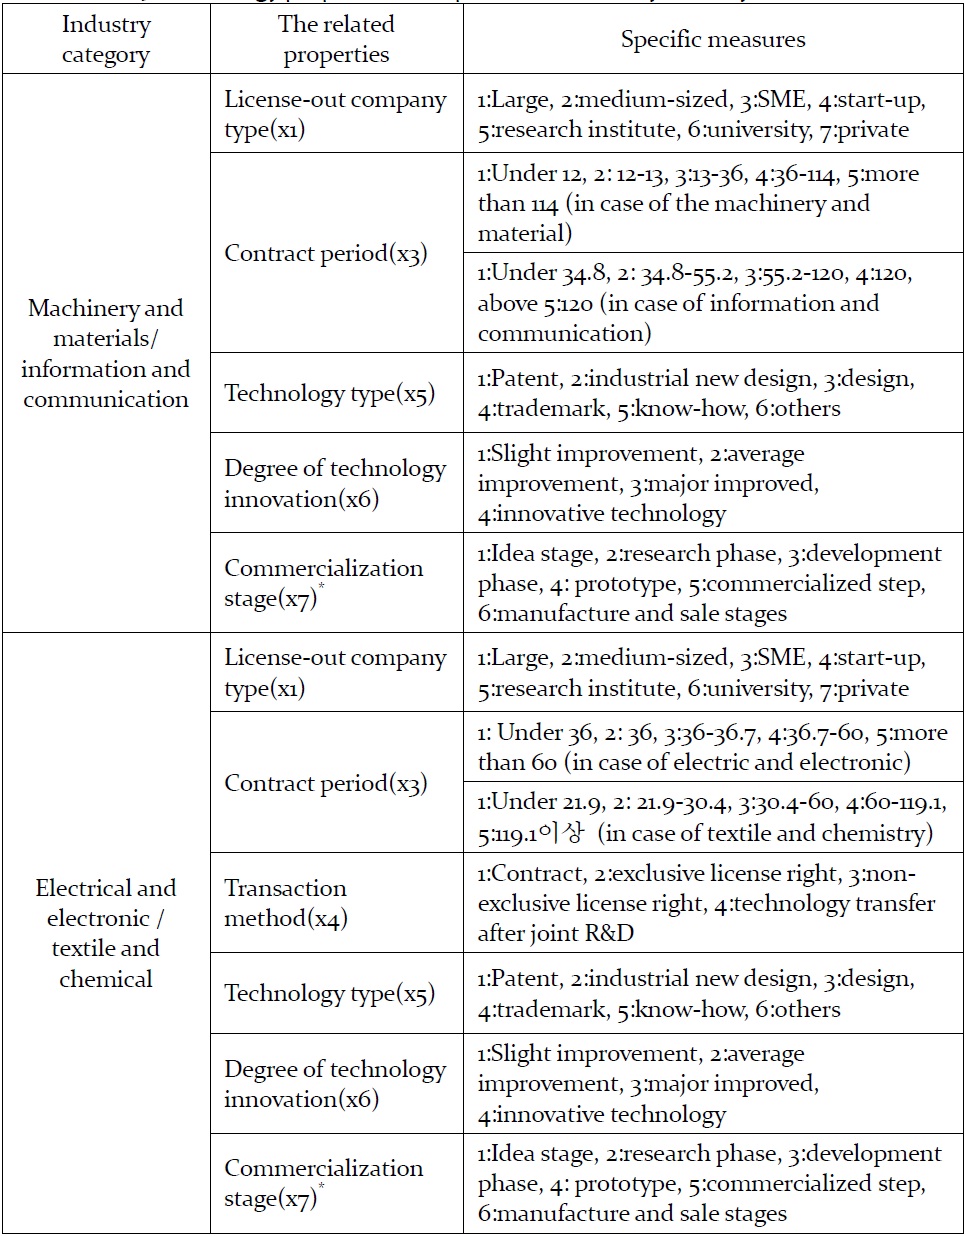
Technology properties and specific measures by industry classification
In practical point of view, it is necessary to refer to only the similar trades that rank the top 5% of the results on the similarity measure trades and have the coefficient value of more than 0.8. If the outcomes that meet the above conditions are too much to review, it is expected to have to adjust these ratios of condition slightly.
5. Adjustment of changes in the value and valuation
The adjustment work is generally required to calculate the final royalties based on the comparison of sales transactions and it is basically necessary to adjust the changes in value over a period of time. To accomplish this adjustment, it first should identify the results of the similarity measurement through the comparison of values of properties between target technology and collected existing cases for technology transfer and the work of comparison adjustment is performed based on the time property such as year of transaction. In other words, with referring to the practices occurred in the most recent transactions, the final royalties can be calculated through these adjustments for differences between practices and evaluation technology.
Besides the above adjustments, it additionally may be necessary to calibrate the final royalty since the condition of technology transaction or the specific contents between traded technologies and evaluation technology may be different. Therefore, we proposed the subsidiary adjustment method which utilizes the scoring method to confirm the final royalty. To do this, technology valuators need to select a list of relevant factors influencing royalty. In this regard Tom Arnold and Tim Headley (1997) published a useful, extensive list of 100 possible factors in an article in
Therefore, in this study proposed the subsidiary method which can produce the final royalty for technology transfer by utilizing the survey result from LES as royalty weights and the table 10 and 11 show an example for calculating the final royalty.
When the valuation ratio (or multiple) is produced by the process introduced in the table 10, the final royalty can be derived from multiplying the average royalty by this valuation ratio. Therefore, the below table 11 shows an example of the subsidiary method.
[Table 10] Example of scoring method for adjusting royalty
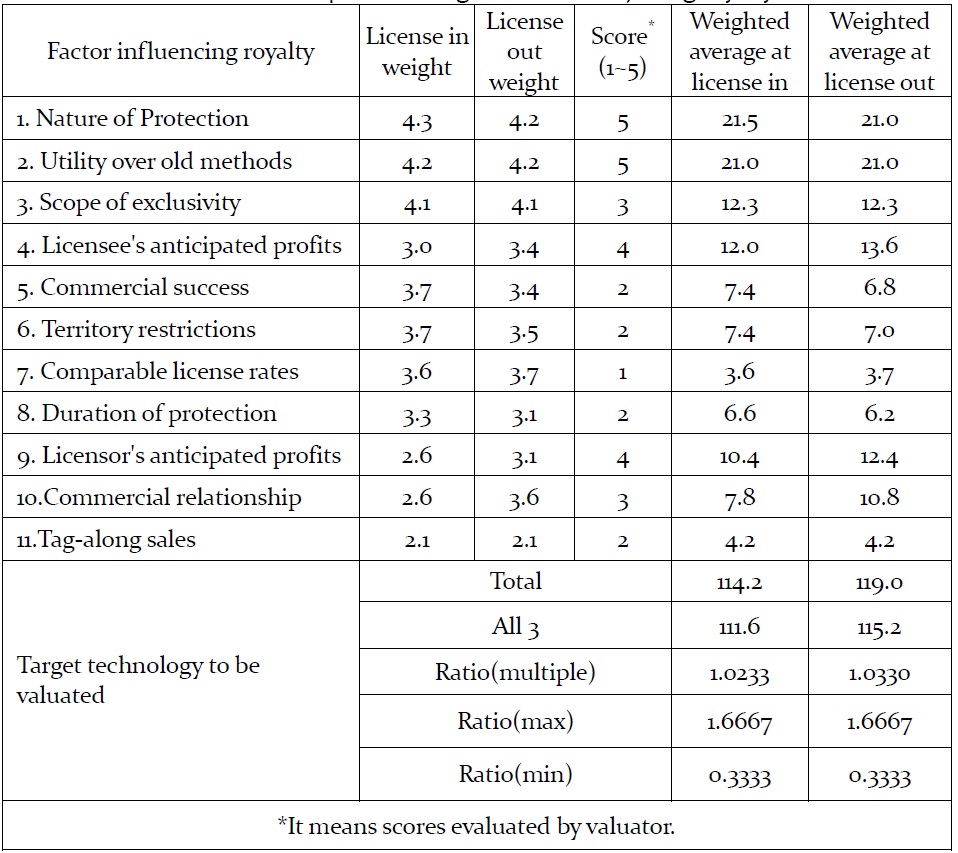
Example of scoring method for adjusting royalty
[Table 11] Example of subsidiary method for calculating final royalty
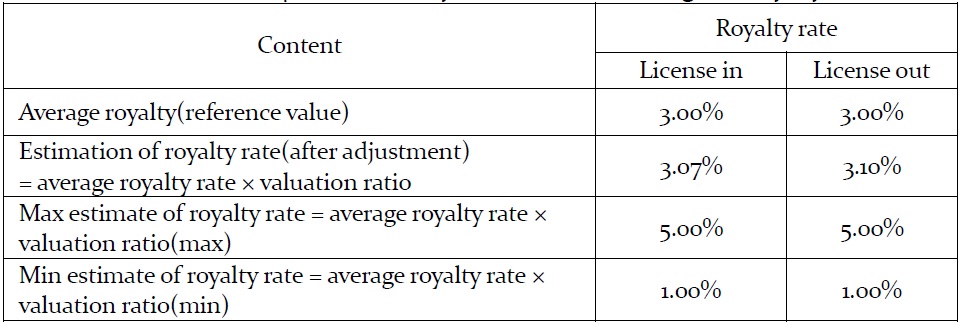
Example of subsidiary method for calculating final royalty
After adjusting the average royalty and the values of royalty range which derived from the results of similarity measure based on traded transactions, the estimate of final royalty rate was respectively revised to 3.07% (license in) and 3.10% (license out) and the estimate of royalty range also was calculated to 1.0 % and 5.0%. If the estimate of range is beyond the statistics of range (table 3 and table 4) analyzed from all of collected practices for technology transfer, it may be better to apply the latter but the former.
In conclusion, the process for technology valuation based on market approach with sales transaction comparison is shown in Figure 3.
The market approach in the technology valuation has been recognized as one of the reliable methods, but this approach has been realistic problems since the transactions of technology transfer were not enough to build systematic database. Thus, until now it has been hard to establish the criteria that can be utilized to promote fair trade for technology transfer.
The most important contribution in this study is that when calculating the average royalty with reference to the industry category through the market approach, it can not only provide very useful basic data and objective market information but also give objective evaluation criteria to valuation specialists and it was introduced that the methodology for verifying the similarity between technologies through the establishment of comparable sales transactions corresponding to conditions of active market and for confirming the weight in the relative value of evaluation technology through the establishment of classified value system according to the industry category. We also proposed the method to adjust royalty, which means that this method unlike the conventional method introduced in
The structure of the market approach has been established during the short study period and it was presented that information of average royalty rate derived by 26 standard industrial classifications and 4 industry categories, literature research, and application method in real practices. But it still remains lots of problems to resolve. This means that it is necessary to perform endless surveys about the transaction of technology transfer and to build the database of practices by field of industry and technology. Also the most important thing in the market approach is to determine royalty. In addition to the method presented in this study, however, it should be performed that the practical ways through in-depth study.
Finally, valuation practitioners should not have any expectation for guide or database that can be used to evaluate all of technology since the database or information available in all cases does not exist in reality. The most important implied in the market approach is the fact that any value close to market value exists in the process of understanding and obtaining the data based on market of technology transfer.
