Thermal conductivity is one of the most important material properties in determining the performance of any nuclear fuel, as the majority of the physical phenomena governing the fuel behaviour are thermally driven. U-Mo/Al dispersion fuels have shown potential for replacement of the Highly Enriched Uranium (HEU) fuels in many research reactors, but have the drawback that the U-Mo fuel particles chemically interact with the Al matrix forming a low thermal conductivity interaction layer of U-Al based intermetallic compounds, which results in fuel swelling and degradation of the fuel performance. The formation of the interaction layer is also thermally driven [1], and the resulting degradation in thermal conductivity of the fuel results in a positive feedback between the growth of the interaction layer and the fuel temperature.
Measuring the thermal conductivity of irradiated fuel is both difficult and expensive. To determine the thermal conductivity of two phase composite materials, such as a fresh U-Mo/Al dispersion fuel, the Maxwell-Eucken equation [2] is traditionally used. However, the equation cannot account for the growth of the third phase interaction layer. An additional complication is the formation of fission gas bubbles, which form within the fuel particles and collect at interfaces between the fuel, interaction layer and matrix [3]. Macroscopic fuel models, such as the DART model [4], the MAIA code [5] or the model by Ryu et al [6], use a theoretical expression derived for the magnetic permeability of multiphase materials by Hashin and Shtrikman [7], to account for this third phase and fission gas bubbles, but it is not clear that such a model can correctly account for the changing morphology of the fuel.
Previous finite element modeling efforts pertaining to fuel performance by Ding et al [8] have met with some success by treating the dispersed particles as regularly spaced equally sized spheres, but this technique is limited by the artificially imposed regular structure assumed for the material microstructure. This paper describes a finite element model of the U-Mo/Al dispersion fuel microstructure that accounts for the random distribution of the fuel particles positions and sizes (consistent with the fuel manufacturing specifications), and the presence of the irregular interaction layer around the particles and also the presence of fission gas bubbles. The microstructural model is executed for a range of compositions and of fuel loading, interaction layer thickness, and fission gas volume fraction, to yield values of the effective thermal conductivity that may later be used in macro-scale modeling for the fuel performance.
Coulson [9] developed a similar finite element based model, but unlike the Coulson model in which the fuel particles and interaction layer regions are individually meshed, in this model the microstructure is represented within a regularly meshed unit cell. The finite elements within the cell are assigned material properties according to whether their location corresponds to a fuel particle, interaction layer, matrix or fission gas bubble. This technique means that it is unnecessary to re-mesh the unit cell as the morphology evolves with time.
Here the focus is on the U-Mo/Al dispersion fuel; however the technique could readily be applied to other dispersion fuel types, and the general modeling methodology could be applied to composite materials in general.
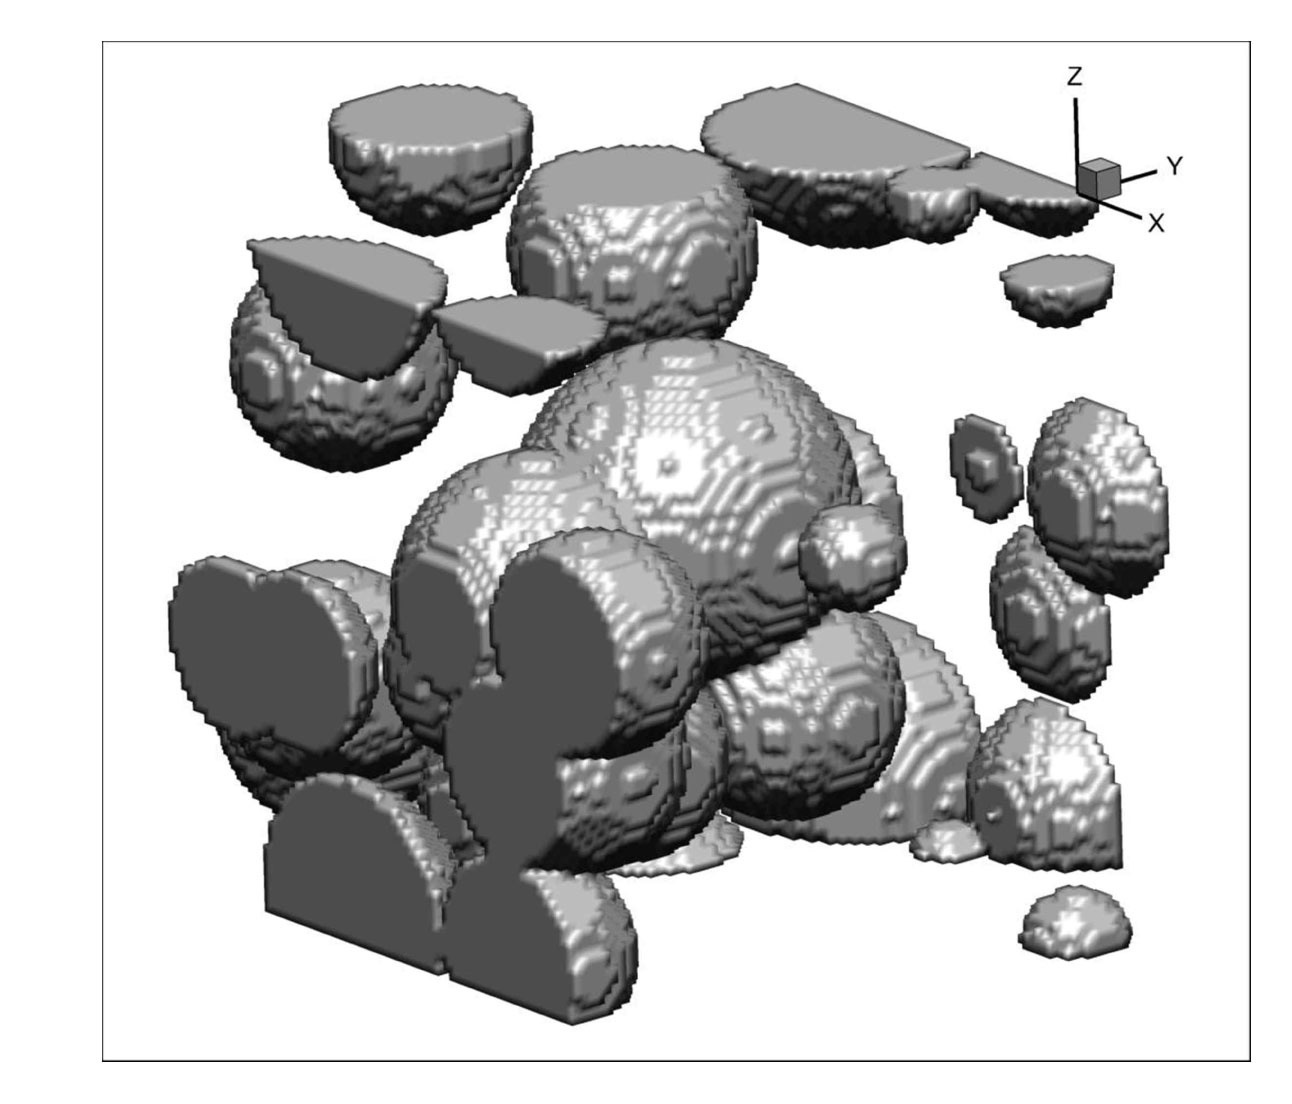
A finite element model is used to represent a small volume of fuel within a fuel element. This representative volume is termed the unit cell. The unit cell is constructed of hexahedral finite elements and the material properties of the elements are assigned in such a way as to be representative of the microstructure of the dispersion fuel, including U-Mo fuel particles, the Al matrix, the fuel-matrix interaction layer, and fission gas bubbles. The effective thermal conductivity of the unit cell is determined by applying a heat flux to one end of the unit cell and solving for the temperature field within the cell. Other boundary conditions such as heat generation within the fuel particles, and material regions, such as the interaction layer, may be readily applied and the influence on the thermal conductivity of the fuel determined. In the current work the ANSYS finite element package was used to obtain the thermal solution, however almost any of the commercially available finite element solvers could have been used.
The unit cell is illustrated in Figure 1. The unit cell is a rectangular prism representing a section of fuel of 0.45×0.45×0.9 mm, with the long axis in the x direction and short axis in the y and z directions. This unit cell contains three-dimensional eight-noded finite element bricks of 5.625×5.625×5.625 μm. Hence the model consists of 80×80×160 or approximately one million elements. An aspect ratio of 2:1 (2 in the
A fortran computer code was written to generate a number of virtual spherical fuel particles, with random coordinates within the unit cell. The diameters of the particles were also randomly generated with a normal distribution
about a mean of 112.5 μm with a standard deviation of 33.75 μm. A lower and upper diameter limit on the fuel particle sizes of 45 μm and 360 μm respectively, was also applied to ensure that extreme particle sizes were excluded from the model. Fuel particles were added to the model until the required fuel loading had been obtained. No restrictions were placed on the particle locations to prevent interpenetration of particles (i.e. the particles were allowed to overlap), although the fuel volume in the unit cell was calculated in such a way as to prevent the double accounting of fuel volumes in the interpenetrating regions. Restrictions were placed on the random x-coordinates of the particles to ensure that a particle free “buffer” region of 0.1125 mm existed at the two ends of the unit cell. This was required to enable the correct application of uniform boundary conditions of heat flux and temperature to the ends of the unit cell. This resulted in two “edge effect” regions that were excluded from the representative volume used in the calculation of the effective thermal conductivity. The geometry of the unit cell was assumed to be cyclic in the
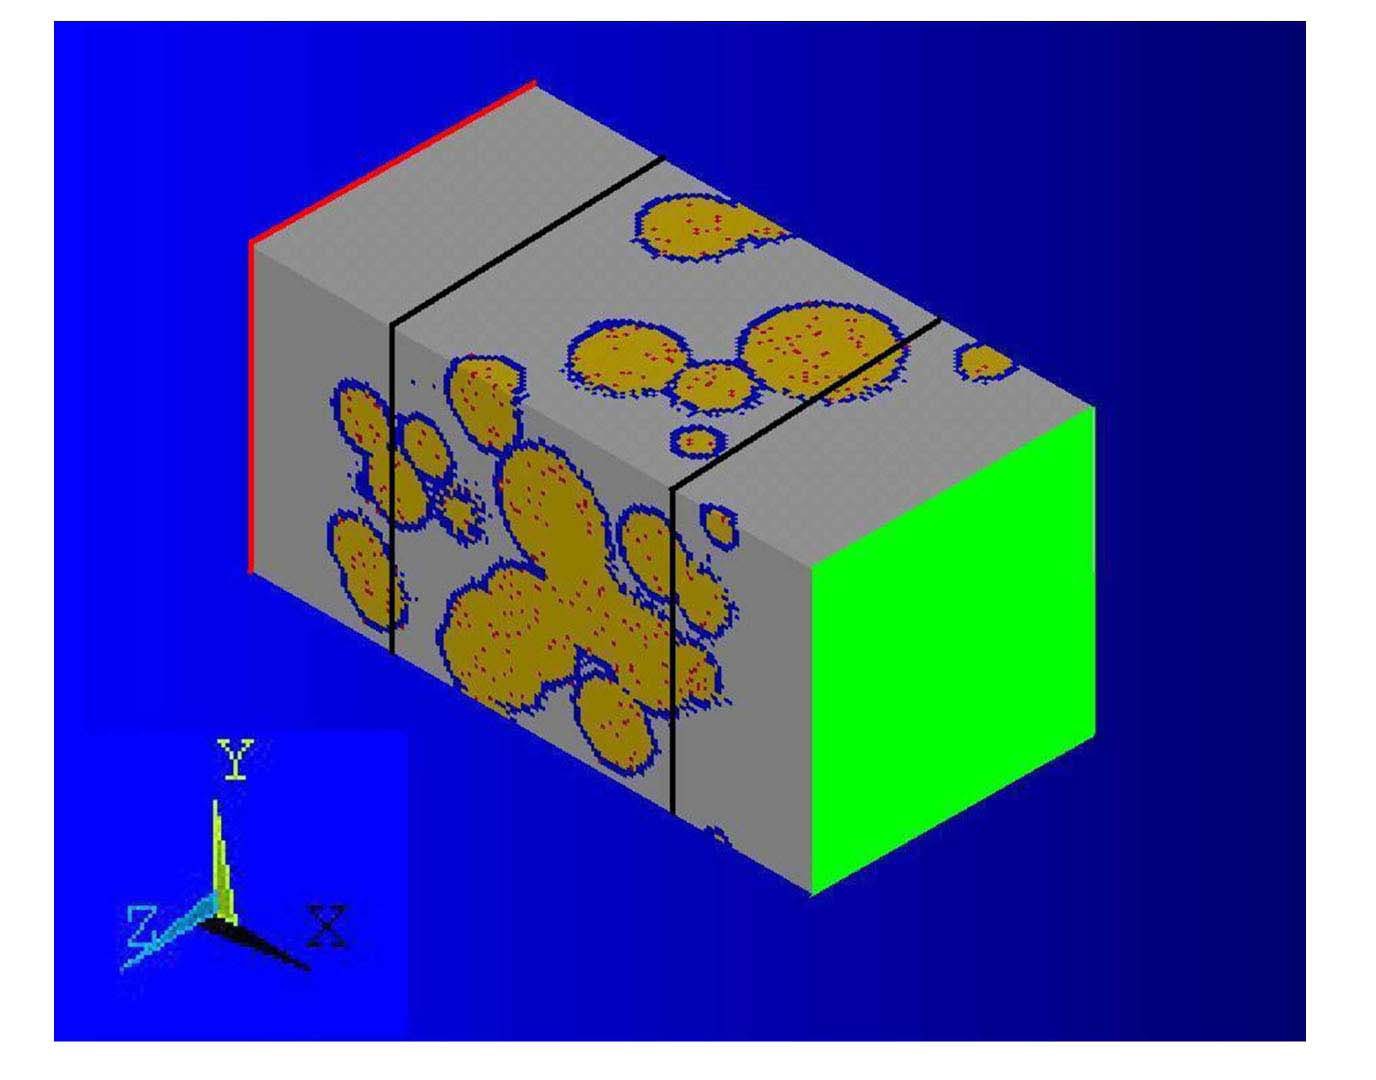
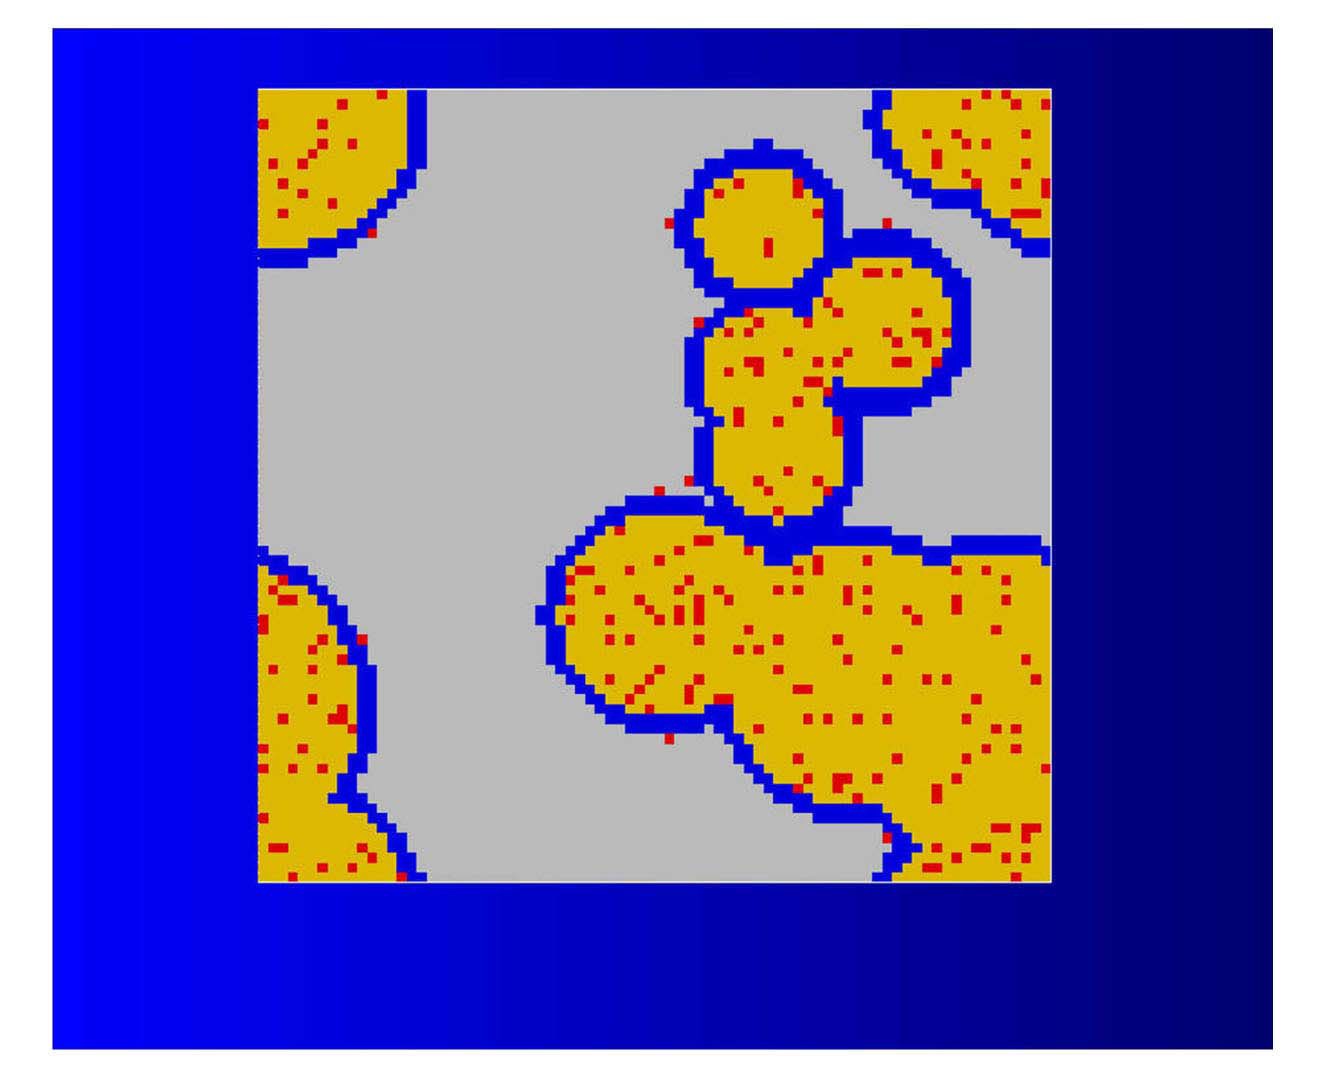
The interaction layer and fission gas bubbles are simulated by assigning differing material types to finite elements within the unit cell. The interaction layer was simulated as a uniform layer around the periphery of the fuel particles. Fission gas bubbles were also located within the fuel and on the periphery of the interaction layer. The material type of each finite element was assigned depending on whether the center of the element lay within the fuel particle, the interaction layer or a fission gas bubble. Figure 3 shows a cross section through the unit cell with fuel particles, interaction layer and fission gas bubbles.
For this model there are four material types: Al matrix, U-Mo fuel particles, interaction layer, and fission gas bubbles. The material properties of each material type were implemented into ANSYS in the form of a lookup table.
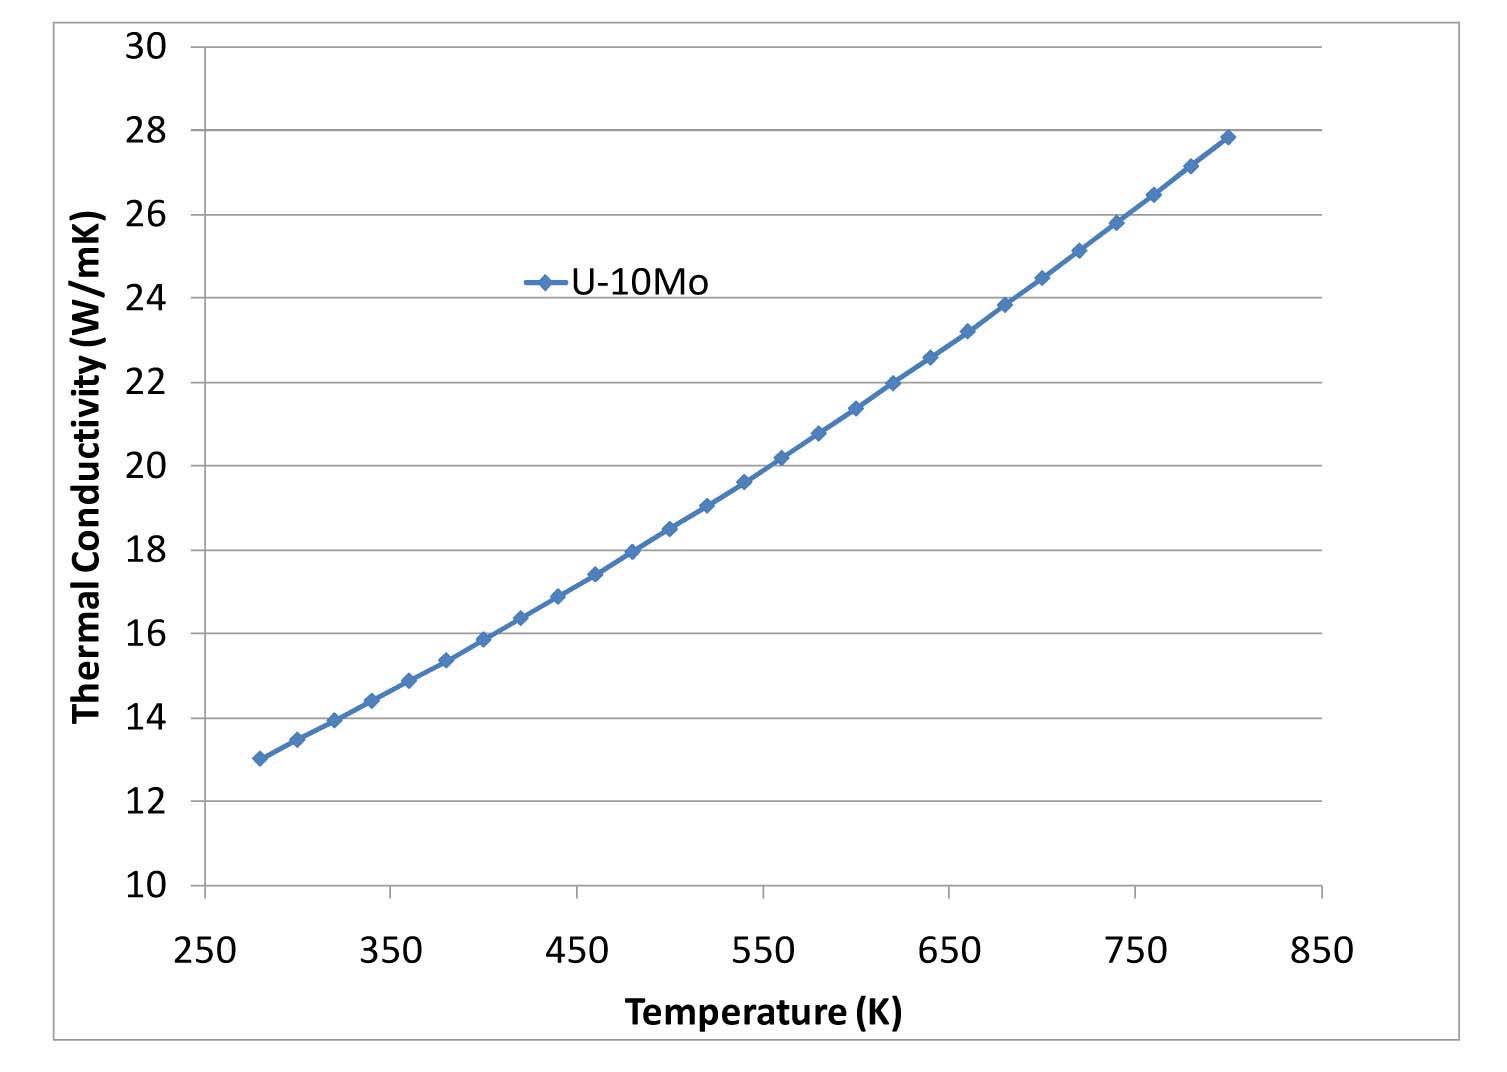
For the simulations shown in this paper the fuel was assumed to be U-10 wt% Mo (U-10Mo) and was assigned a temperature dependant thermal conductivity determined by the correlations provided in Section 2.6 of the U-Mo Fuels hand book [10]. The thermal conductivity as a function of temperature is shown in Figure 4.
The thermal conductivity of the aluminum matrix was assumed to be temperature independent and set as 220 W.m-1.K-1. The thermal conductivity of the fission gas in the bubbles is several orders of magnitude lower than the other components and can be treated as effectively zero, and was approximated as a temperature independent value of 10-3 W.m-1.K-1.
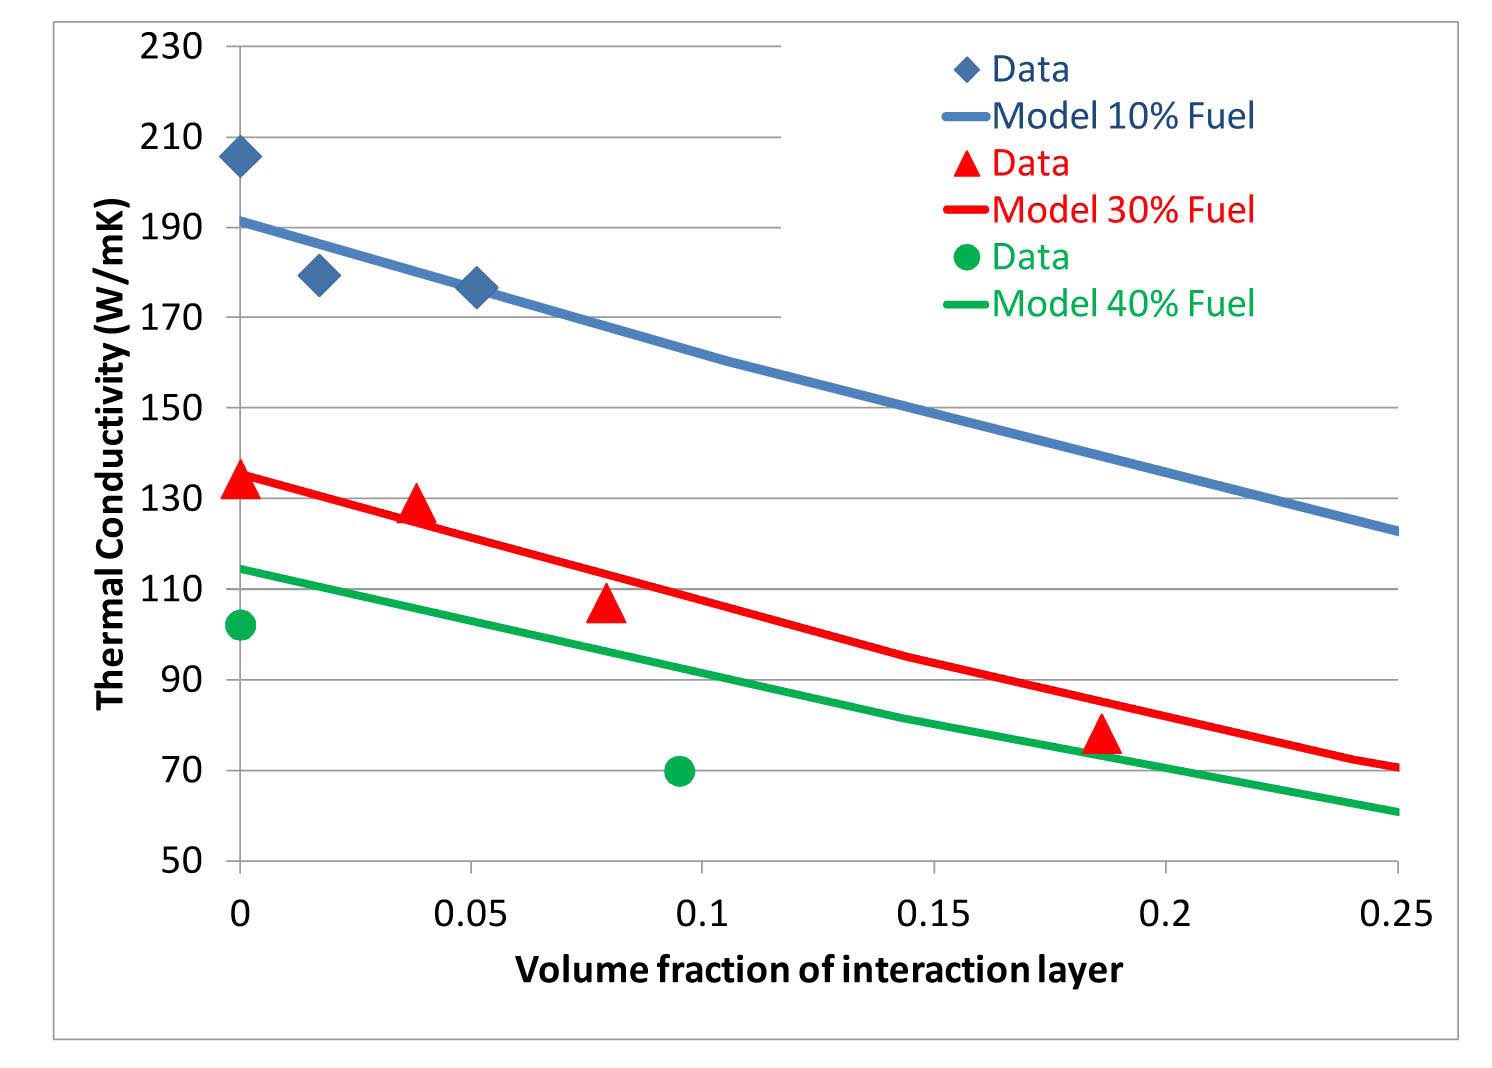
The composition of the fuel-matrix interaction layer is still the subject of study and the thermal conductivity of this layer remains the largest uncertainty in the model. Lee et al [11] reported laser flash measurements conducted on unirradiated samples of U-Mo dispersions following various heat treatments. These heat treated samples exhibited interaction layers around the fuel particles, and the thermal conductivity of fuel sample as a function of the volume fraction of the interaction layer was reported for several fuel compositions. It was possible to estimate the thermal conductivity of the interaction layer by choosing a value for the model which best matched the observed degradation in thermal conductivity of the fuel sample as a function of the volume fraction of the interaction layer. The thermal conductivity as a function of volume fraction of the interaction layer for both the experiments and the model simulations is shown in Figure 5. The best match with the experimental data was obtained (by trial and error) with an interaction layer thermal conductivity of 5.5 W.m-1.K-1. This value is consistent with the thermal conductivity measurements of UAl3 and UAl4 conducted by Nazaré et al. [12], given the low density estimated for the interaction layer.
2.4 Boundary Conditions and Constraints
Constraint equations were applied to the finite element solution to ensure that the temperature mated on opposite faces of the unit cell in the
The face of the unit cell normal to the
For several of the simulations shown in Section 3, a heat generation rate was also applied to the finite elements representing the fuel and the interaction layer. In all cases, the applied heat generation was equivalent to a volume averaged heat generation rate of 3.2×10⁹ W.m-3 applied to the entire unit cell. This approximates to a linear power of 100 kW.m-1. It was also assumed that the ratio of the volumetric heat generation rates in the fuel particles and the interaction layer was 10:1 based on the estimated density of the interaction layer (see Section 3.4).
The model was executed for various fuel conditions to determine the effects of fuel loading, interaction layer volume fraction, fission gas volume fraction, and heat
generation within the fuel particles on the effective thermal conductivity. The results of these simulations are presented and discussed below.
3.1 Comparison to the Maxwell-Eucken Equation
Traditionally the effective thermal conductivity of dispersion type fuels has been estimated using the Maxwell- Eucken equation [2]:
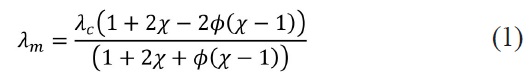
where:
λm = thermal conductivity of the mixture (in this case the fuel meat),
λc = thermal conductivity of the continuous phase (in this case the Al matrix),
λd = thermal conductivity of the dispersed phase (in this case the U-Mo fuel),
χ = λc/ λd i.e. the ratio of the thermal conductivity of the continuous phase to that of the dispersed phase.
ϕ = the volume fraction of the dispersed phase (in this case the volume fraction of the U-Mo fuel particles within the bulk fuel).
This equation was derived for an idealized dispersion of spherical particles and in a continuous medium and is not generally applicable to dispersion fuels with significant interaction layers and fission gas bubbles.
An alternative to the Maxwell-Eucken equation is the expression used by the Commissariat à l’Énergie Atomique (CEA) in the MAIA code [5], which is based on a theoretical expression derived for the magnetic permeability of multiphase materials by Hashin and Shtrikman [7]:

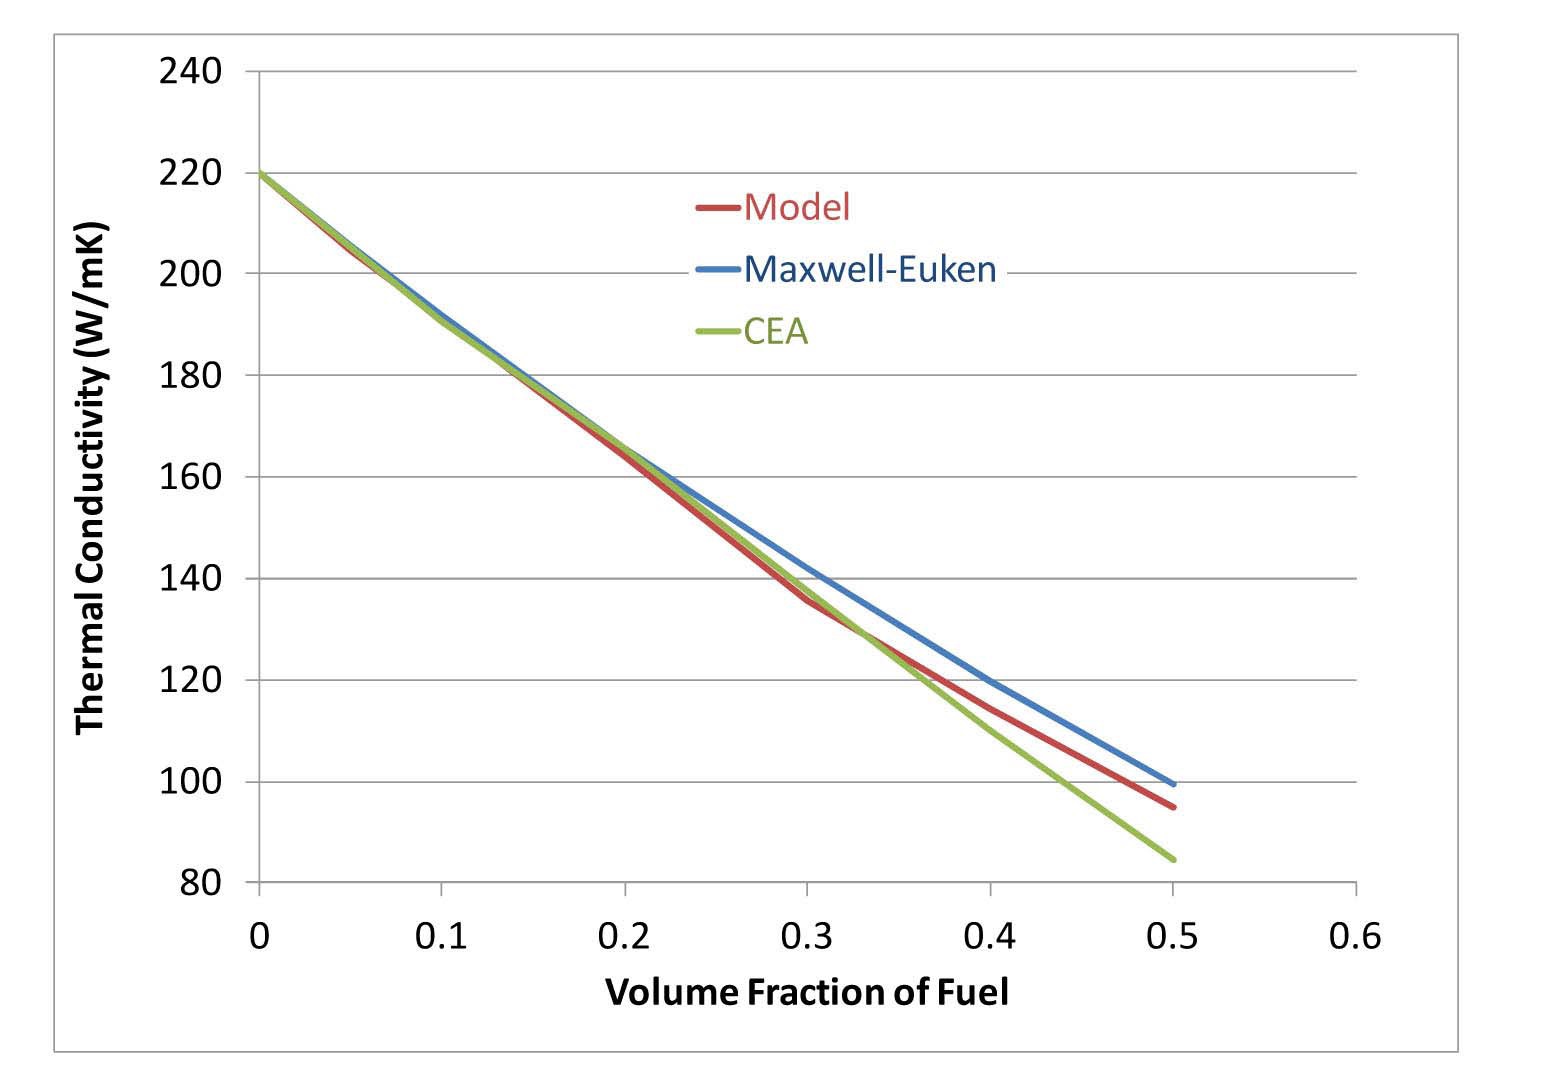
Figure 7 shows the results of the current microstructural model compared against the Maxwell-Eucken and CEA
equations for fuel volume fractions ranging from 0 to 50%. It should be noted that there is no interaction layer, fission products or heat generation for these simulations. All three models are approximately equivalent up to a fuel volume fraction of 20%. Between 20% and 30% fuel volume fraction, the presented microstructural model closely matches the CEA values. Above 30% fuel volume fraction the microstructural model exhibits a small change in gradient and determines values between the Maxwell-Eucken and CEA models.
Further work is required to determine the variability in the microstructural model due to the stochastic nature of the fuel particular distribution in the representative volume.
3.2 Effect of Interaction Layer
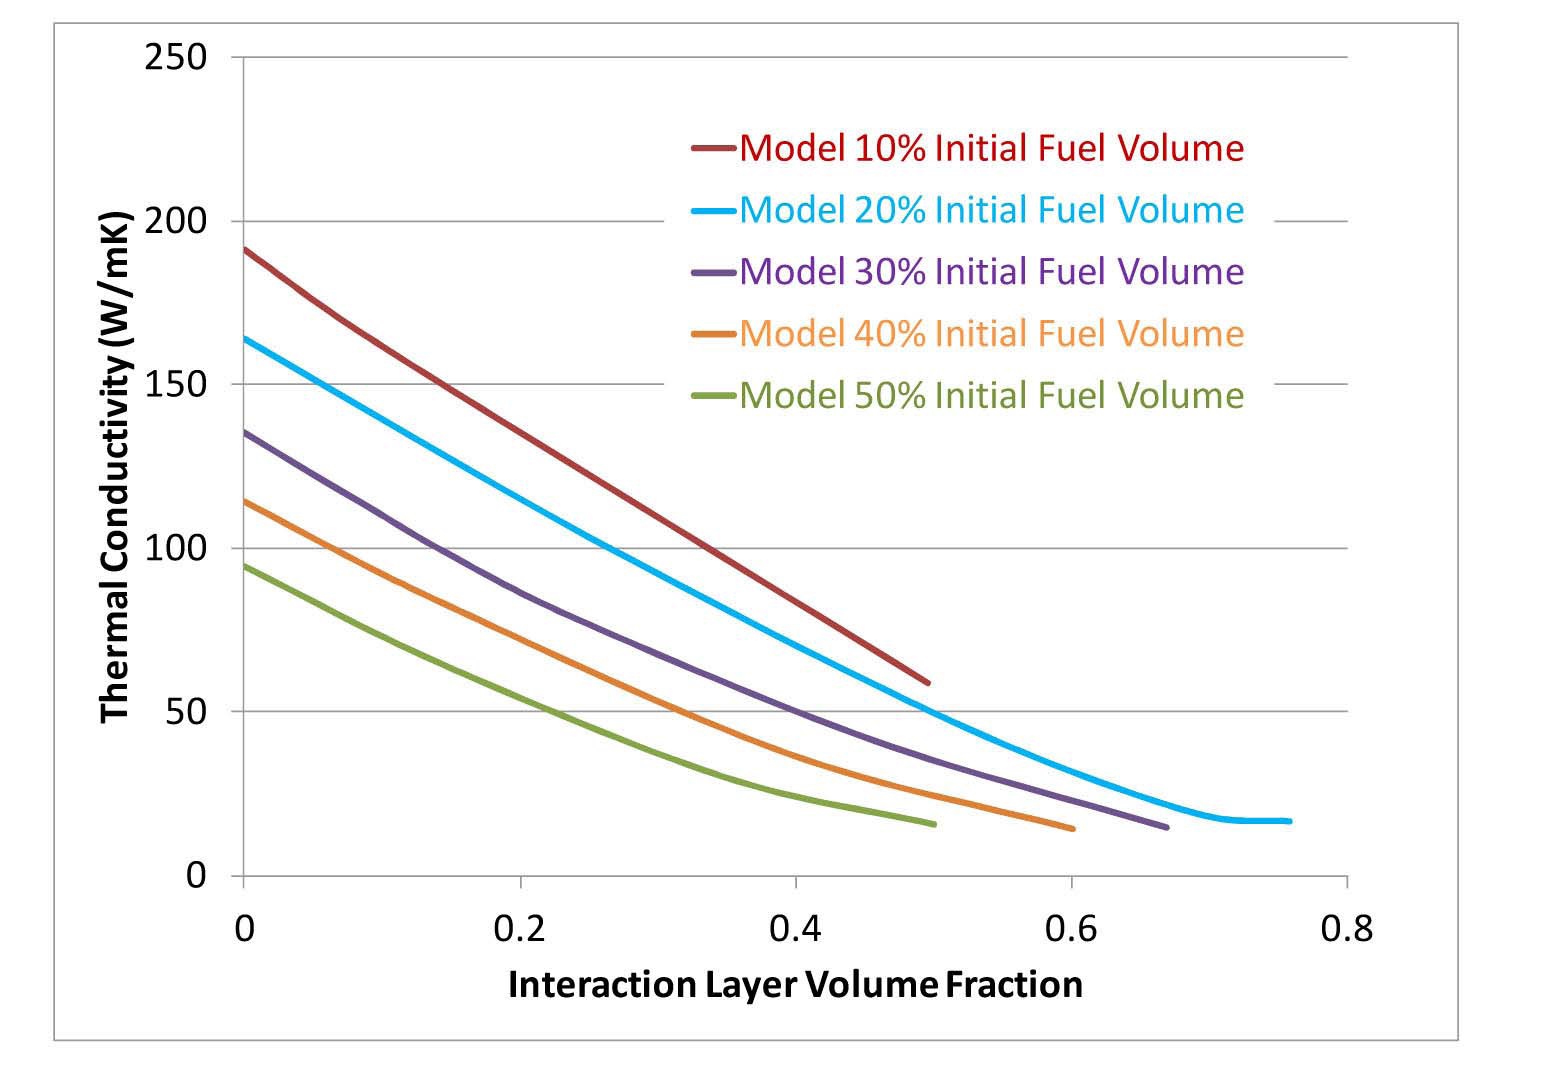
The impact of the growth of the interaction layer was studied by executing the model over a range of fuel volume fractions and interaction layer volume fractions. The results of these simulations are shown in Figure 8. As the interaction layer grows the fuel particles and aluminum matrix are consumed. The exact composition of the interaction layer is still under investigation, but for the purposes of this model it was assumed the ratio of aluminum to uranium atoms in the interaction layer is 3.5. Based on measurements by Lee [11] the density of the interaction layer was estimated as 2.1 gcm-3, Thus the ratio between the interaction layer volume and the volume of fuel consumed is 10:1, and the ratio between the interaction layer volume and the volume of the matrix consumed is 4.6:1. The thermal conductivity values in Figure 8, include the effects of reducing the fuel volume fraction as the interaction layer grows in accordance to these ratios. As expected the thermal conductivity declines with increasing volume fraction of the interaction layer.
Figure 8 allows the effective thermal conductivity of
the fuel to be determined from a known combination of initial fuel volume fraction and interaction layer volume fraction. In principle if the relationship between the reduction in the fuel volume fraction and the increase in interaction layer volume fraction is known as a function of burnup, it should be possible to determine the thermal conductivity as a function of burnup. Note that these simulations do not include the impact of fission gas bubble formation.
The current model does not determine the growth of the interaction layer as a function of time or burnup. Several empirical correlations are available in the literature giving the interaction layer thickness as a function of time and fission rate. Based on the post irradiation examination of fuel plates irradiated in the RERTR-3 test irradiations [14] Hayes et al. [15] suggest the following correlation:

where:
y = the interaction layer thickness (μm)
wMo = the weight fraction of Mo in the fuel particles
ḟ = the fission rate density in the fuel particle (fissions. cm-3.s-1)
R = the ideal gas constant (J.mole-1.K-1)
T = local temperature (K)
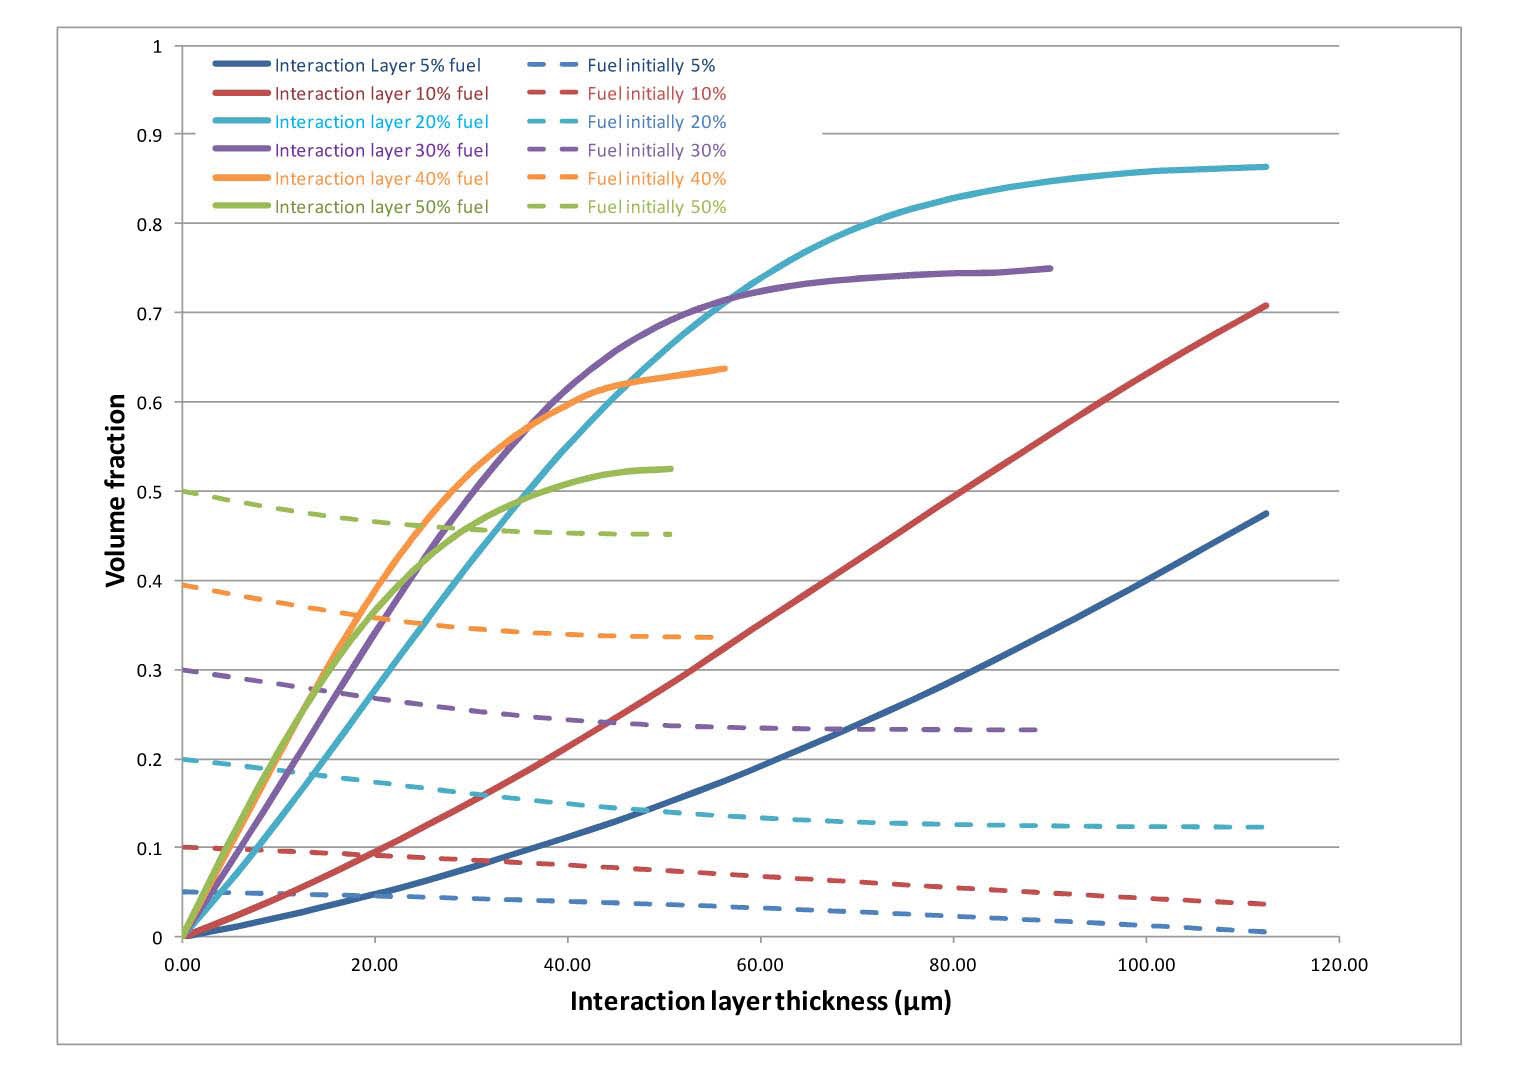
The geometry of the dispersed fuel and the growing interaction layer means that the relationship between the interaction layer thickness and the volume fraction of the interaction layer is not immediately apparent and will change with the initial volume fraction of the fuel particles and particle size distribution. The most direct solution to this problem was to determine the interaction layer volume fraction by summing the volumes of the elements in the model for a number of fuel particle loadings and interaction layer thicknesses. Figure 9 shows interaction layer volume fraction as a function of interaction layer thickness for a number of fuel volume fractions. Note that the values shown
here include the effect of reducing the volume fraction of the fuel particles as the interaction layer thickness increases. Equation (3) may be used to determine the interaction layer thickness at any given time in the irradiation and Figure 9 may be used to determine the corresponding interaction layer volume fraction, and finally Figure 8 may be used to determine the corresponding effective thermal conductivity.
At this stage the model does not directly account for the accumulation of fission gas bubbles. This deficiency is offset by calibrating the thermal conductivity of the interaction layer against the measurements of bulk thermal conductivity by Lee et al. [11] and described in Section 2.3, as fission gas bubbles present in the experimental data suppress the thermal conductivity of the interaction layer.
3.3 Effect of Fission Gas Bubbles
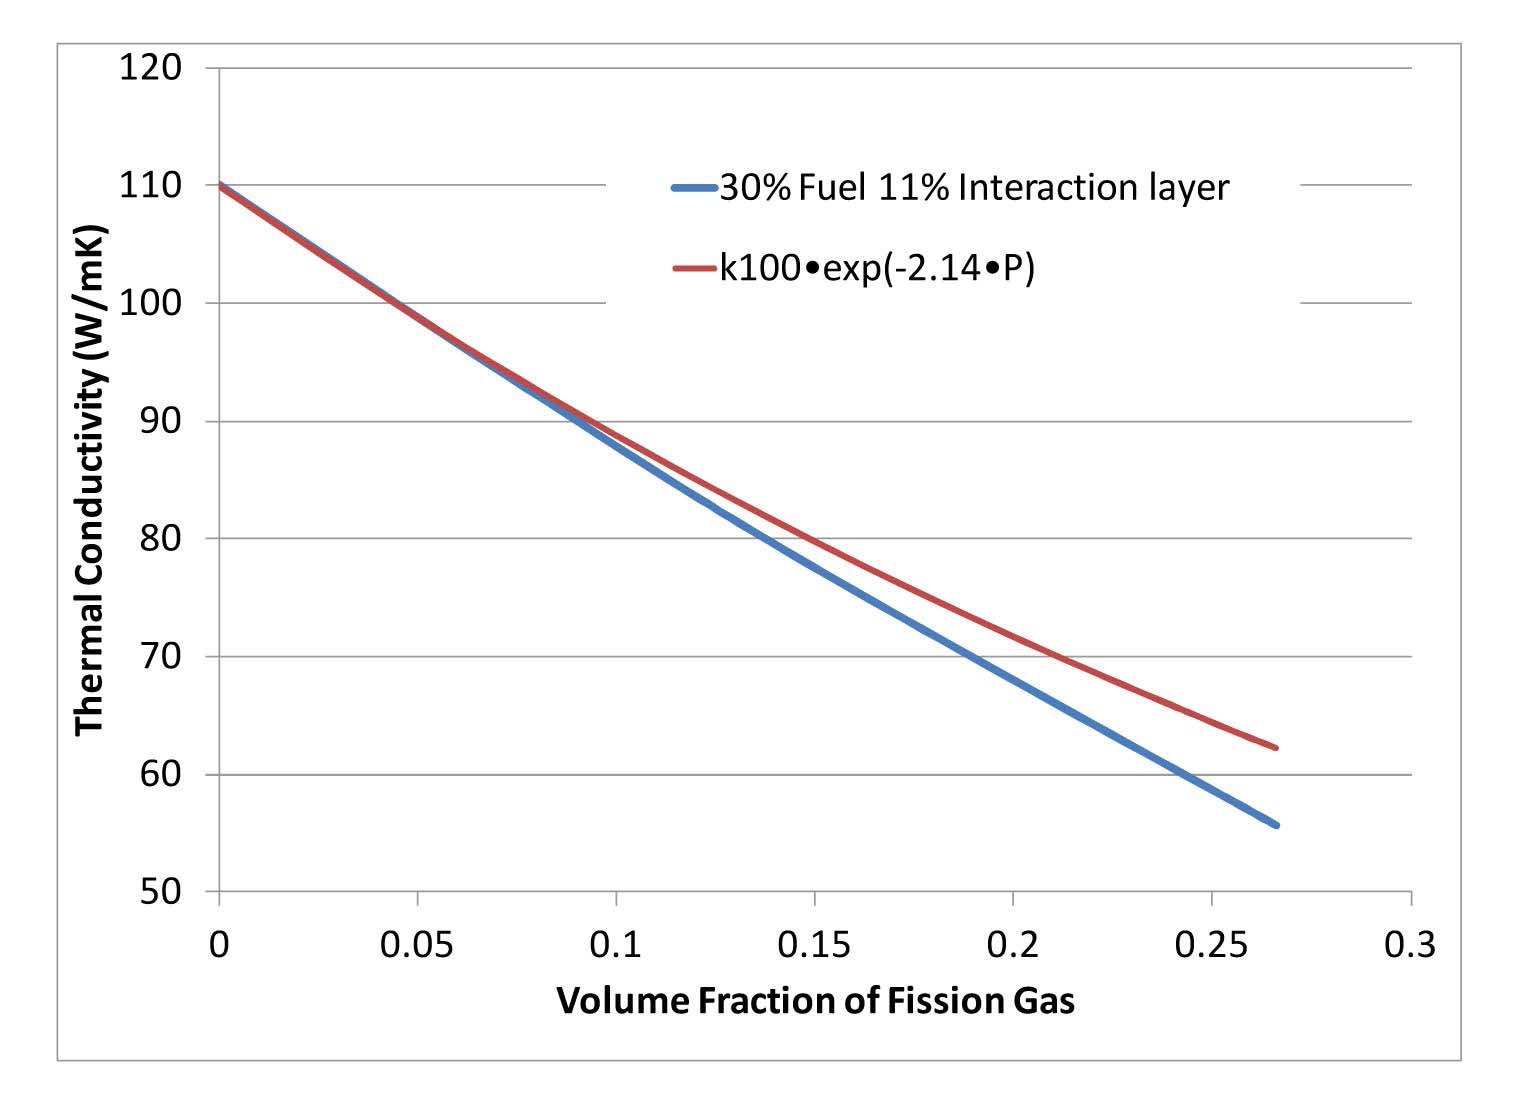
The effect of fission gas bubbles on the bulk thermal conductivity was determined by adding bubbles as a fourth phase to the model. It was assumed that the fission gas bubbles are restricted to the interior of the fuel particles and the surface of the interaction layer. Figure 10, shows the bulk thermal conductivity of a fuel sample with a 30% volume fraction of fuel and a 11% volume fraction of the interaction layer, as a function of the volume fraction of fission gas bubbles. The degradation with pore volume fraction is also compared to the empirical relation suggested by Cunningham et al. [16].
k = k100exp(-2.14·p)
Where
A cross section through the unit cell with fission gas bubbles is shown in Figure 3. In the current model, the
fission gas bubbles are located randomly within the fuel matrix and at the outer surface of the interaction layer, and are the size of a single element within the unit cell. These fission gas bubbles represent bubbles on the grain boundaries within the fuel particles. It is known that intragranular nano-scale bubbles may form within the fuel grains, Berghe et al. [17], but these bubbles are not yet accounted for in this model. Due to the small scale of these bubbles it may be appropriate to simulate their effect by reducing the effective thermal conductivity of the U-Mo fuel material. Work is on going to determine an appropriate size distribution and burnup up dependency for the fission gas phase.
3.4 Effect of Heat Generation within the Fuel
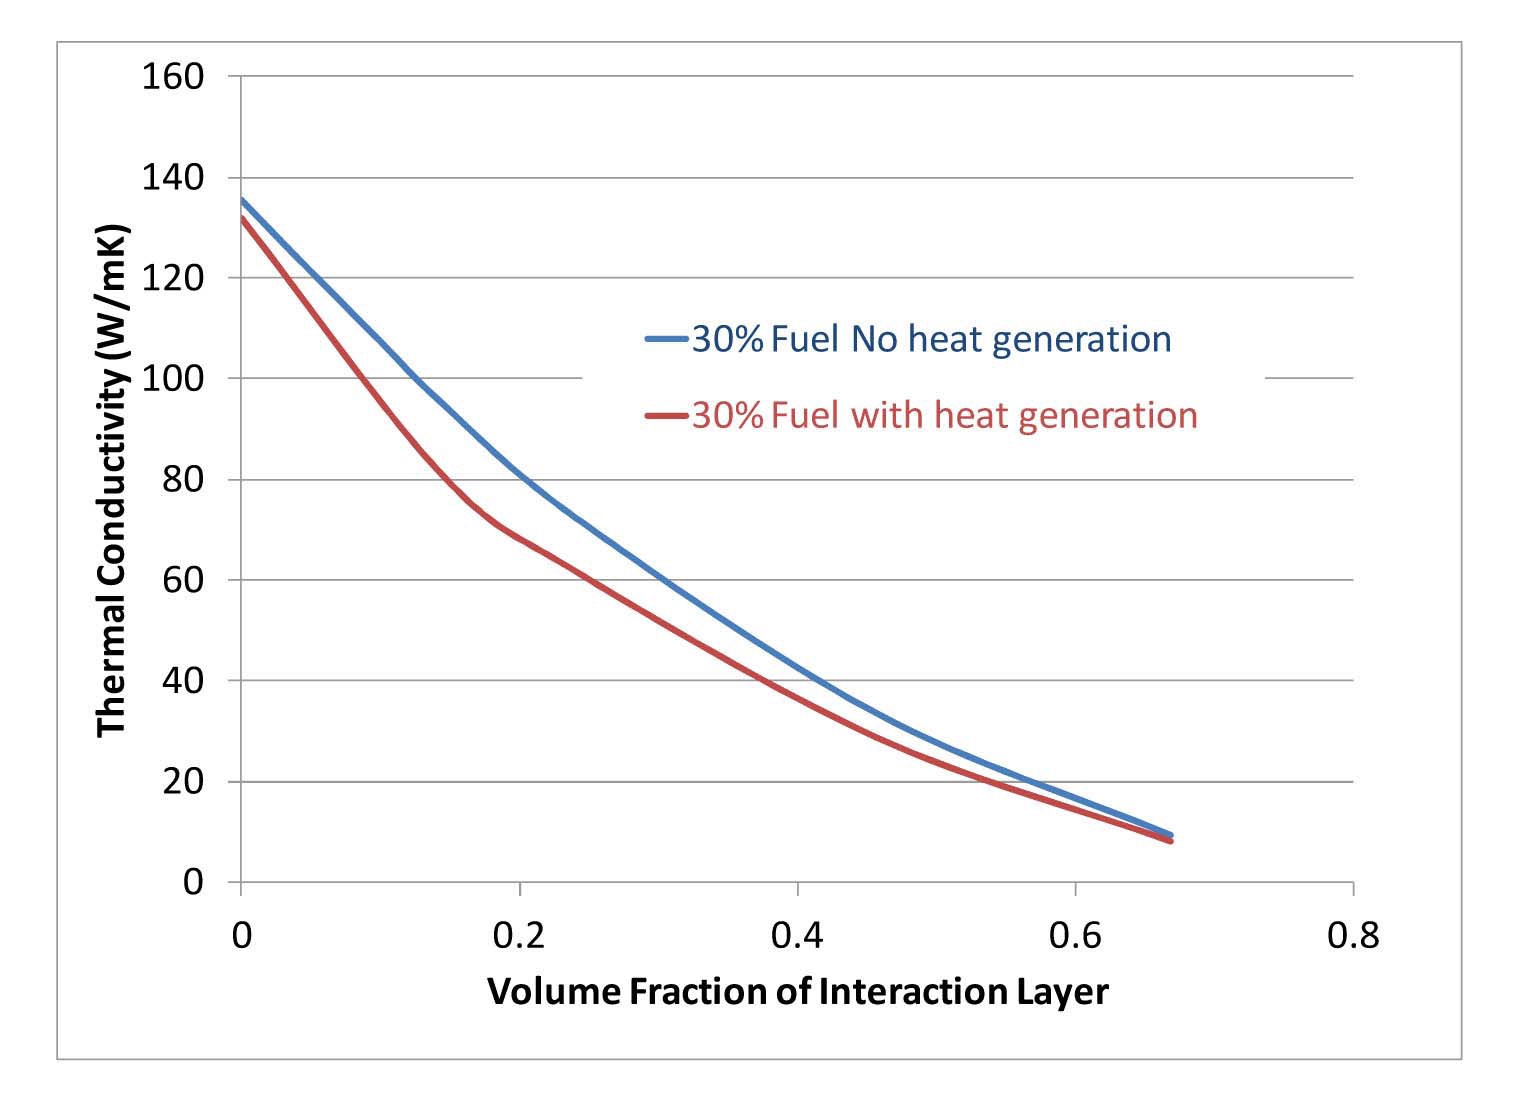
In-reactor heat is generated within the fuel particles and the interaction layer. The volumetric heat generation rate in the interaction layer is difficult to determine as it depends on the density and loading of uranium and the various activation and fission products; however for the purposes of this model, it was assumed that composition of the interaction layer is an equal mixture of UAl3 and UAl4. Lee et al [11] measured both the density of irradiated fuel and the corresponding interaction layer volume fraction. Assuming that there were 3.5 Al atoms for every U atom in the interaction layer it was possible to estimate the density of the interaction layer as 2.1 g.cm-3 and the uranium density as 1.5 g.cm-3. The uranium density in U-10Mo is given as 15.5 g.cm-3 [10], suggesting that the ratio of volumetric heat generation between the U-Mo fuel particles and the interaction layer as 10:1. Figure 11 shows the effective thermal conductivity of a fuel sample with 30% volume fraction of fuel particles as a function of the volume fraction of the interaction layer for a case with no heat generation and a case with a volume average heat generation rate of 3.2×10⁹ W.m-3. The effective thermal conductivity of the fuel with heat generated in the fuel particles is a little lower than that of the fuel with no internal heat generation.
This is because the internal heat generation creates local hot spots that oppose the bulk heat flow. As the thickness (or volume fraction) of the interaction layer increases the fuel particles are insulated and the local temperature perturbations increase, until the interaction layer volume fraction reaches 20%. Above 20% interaction layer volume fraction, and with a 30% fuel particle fraction, the volume fraction of the Al matrix is below 50% and a greater portion of the heat flux must pass through the interaction layer, and the influence of local temperature perturbations declines.
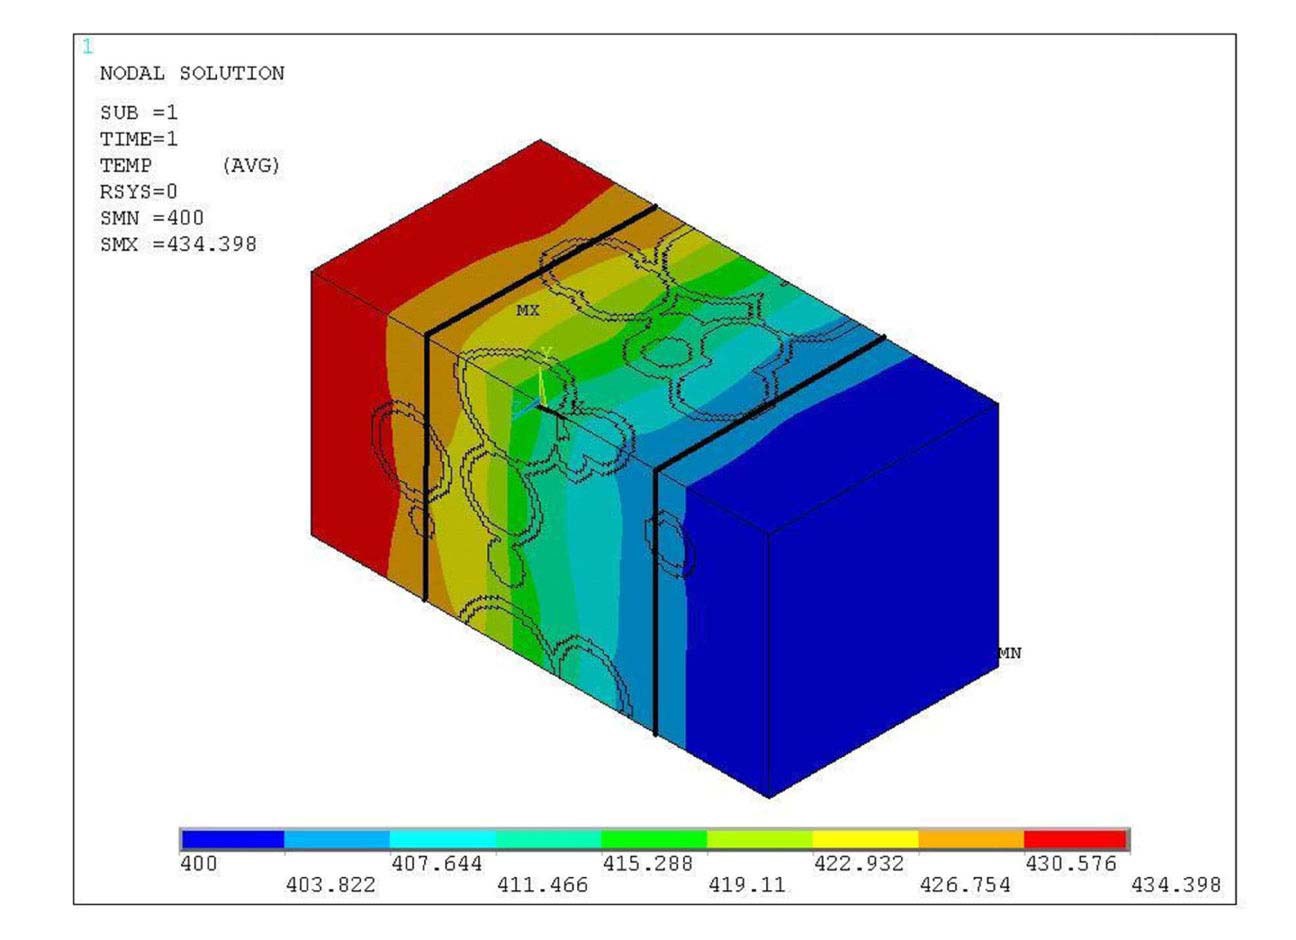
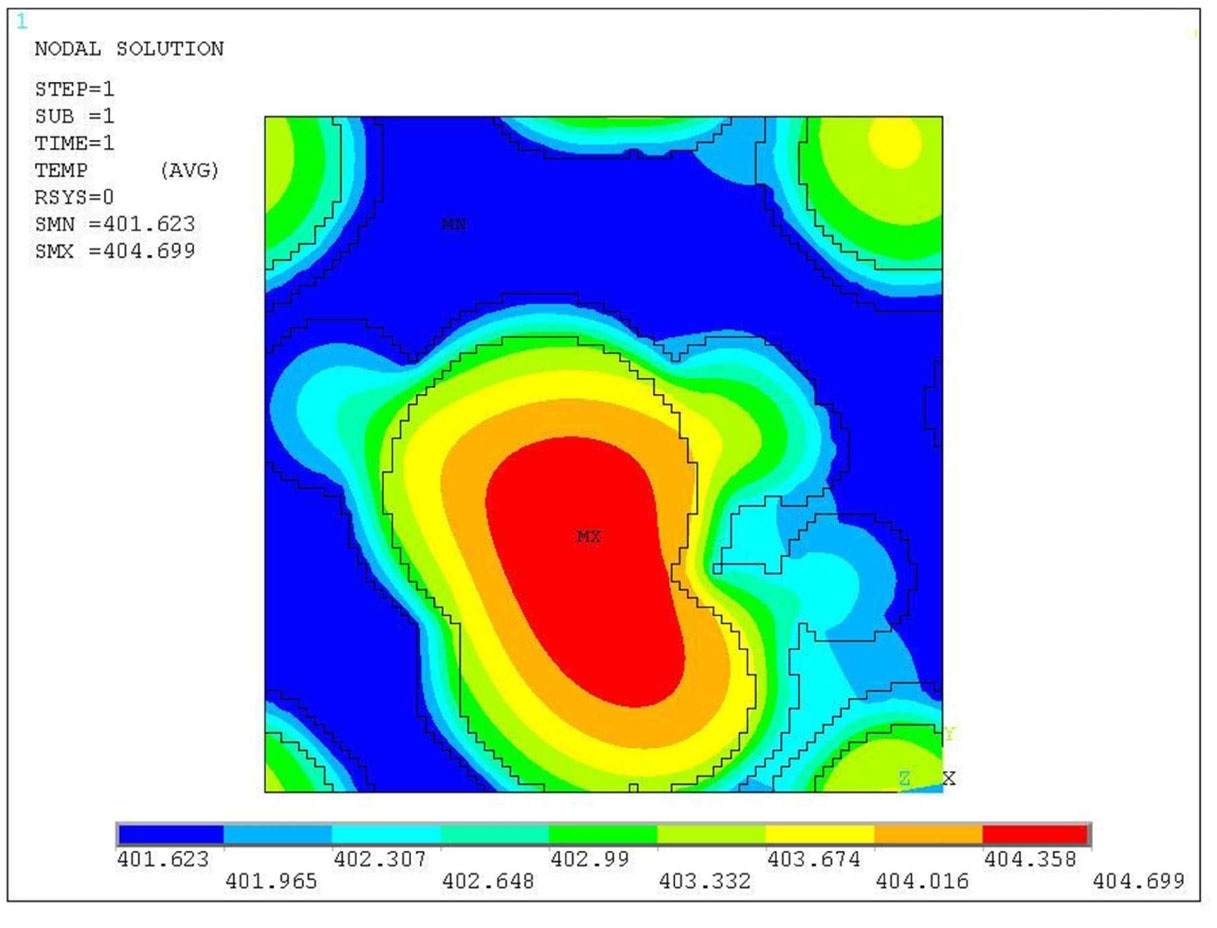
Figure 12 shows a cross section through the unit cell with heat generation within the fuel particles. The temperature difference between the center of the fuel particles and the matrix is small (~ 3K).
The current microstructural model has been used to determine the effective thermal conductivity of U-Mo/Al dispersion fuel over a range of fuel compositions, including various combinations of interaction layer thickness and, fission gas bubble volume fractions. The advantage of this model over many of the previous microscale models is that morphology of the fuel in the simulation is very similar to that of real fuel, and may be readily adjusted to match many different fuel types and compositions.
Similar models that simulate the dispersed phase as a regular array of particles of a single size, such as the model described by Ding et al. [8], may be successfully used to determine macroscopic parameters such as thermal conductivity. But these models cannot be used to determine the effects of particle size distribution, and local micro-scale heterogeneity. These effects can only be accurately simulated by a model that captures the microscopic morphology of the fuel.
The model also has great potential for extension by directly coupling the model to a suitable thermally driven model of the interaction layer growth, such as that proposed by Soba and Denis [1]. This would allow for the simulation of the evolution of the interaction layer as a direct function of burnup under a range of physical conditions, fully representative of the conditions expected of the fuel within the reactor.


![Predicted Thermal Conductivity Compared Against
Experimental Measurements on U-10wt%Mo Dispersion Fuel
Reported by Lee et al [11]](http://oak.go.kr/repository/journal/12931/OJRHBJ_2013_v45n7_839_f005.jpg)