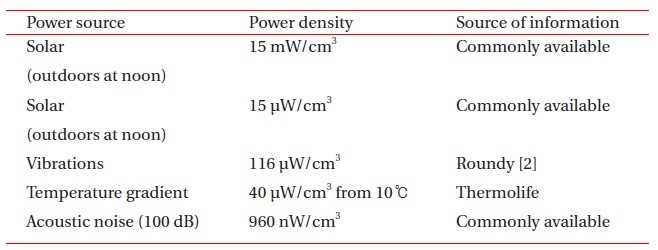
Energy harvesting, defined as a process in which energy is derived from external sources such as solar power, thermal energy, wind energy and kinetic energy captured, has been widely investigated [1-5]. Table 1 shows the comparison of power density generated from various power sources. Although solar energy has a relatively large power density (15 mW/cm3) outside, it sharply decreases inside [6]. Moreover, energy produced via solar power is negligent when it is dark outside. However, since vibration is less dependent on the place and time, it is more valuable for energy harvesting.
Piezoelectric energy harvesting is well known to convert mechanical energy, such as vibration, to electrical energy. The technique has some advantages when compared to other energy harvesting techniques. Primarily, it has a very simple structure, composed of piezoelectric ceramics and conducting electrodes. Moreover, it is always functional within the operation frequency ranges whenever ambient vibration exists [7].
5Piezoelectric energy harvesting has attracted much interest for use in various portable electronic devices due to some strong advantages. In particular, its low-power consumption could make the weight of batteries abruptly decrease and self-powered devices more available in the ubiquitous life of harvesting mechanical energy [8-10].
However, the technology of piezoelectric energy harvesting is only able to produce a few microwatts, which results from a high voltage, but a ultimately low current, when compared to other harvesting technologies of solar or wind energy. Thus, recent topics of piezoelectric energy harvesting lie in the enhancement of piezoelectric constants for a higher power density and structure development of energy harvesters within an optimized scheme. In order to improve the piezoelectric properties, we have optimized a structure of piezoelectric energy harvesters as a bimorph type cantilever by a finite element method. Furthermore, we have fabricated a piezoelectric energy harvester using piezoelectric materials with excellent piezoelectric properties and then have evaluated it systematically.
[Table 1.] Comparison of the power density generated from various power sources.

Comparison of the power density generated from various power sources.
2.1 Piezoelectric energy harvesting
Piezoelectric energy harvesting, which converts mechanical vibration energy to electrical energy, generally uses a piezoelectric ceramic. The piezoelectric materials are normally classified as two different types, based on the energy conversion direction. The first one is the actuator type, in which the piezoelectric element undergoes a dimension change with an electric field application. The electric energy is converted into mechanical energy based on the indirect piezoelectric effect. The second type is called the sensor type, in which an electric charge is produced with the application of a mechanical vibration [11]. This study uses the sensor type and piezoelectric cantilever in order to harvest the surrounding waste energy. The output power density (W) is defined via the following Eq. (1):
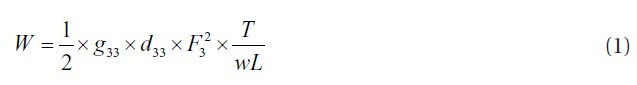
This equation consists of the force (F), thickness (T), cantilever’s length (L), width (W ) piezoelectric constant (d33), and output voltage coefficient (g33). In order to produce a higher electrical harvest, the piezoelectric properties must be improved and the structure must be optimized [12].
2.2 Design of the piezoelectric energy harvester using a finite element method
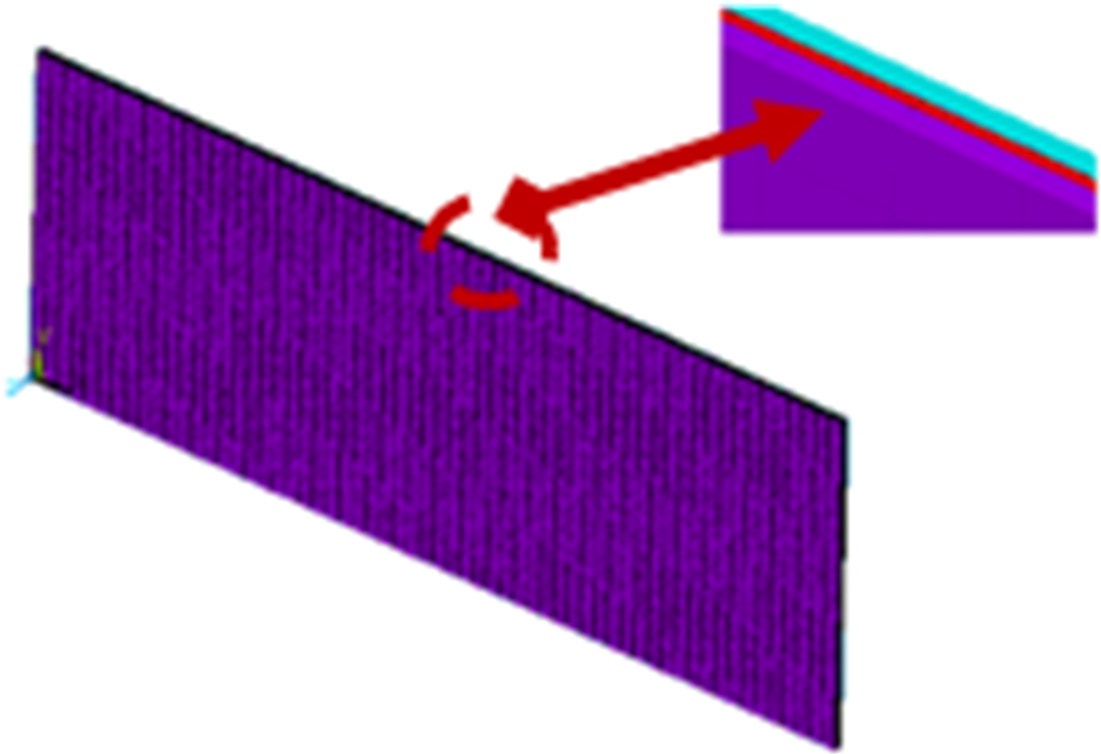
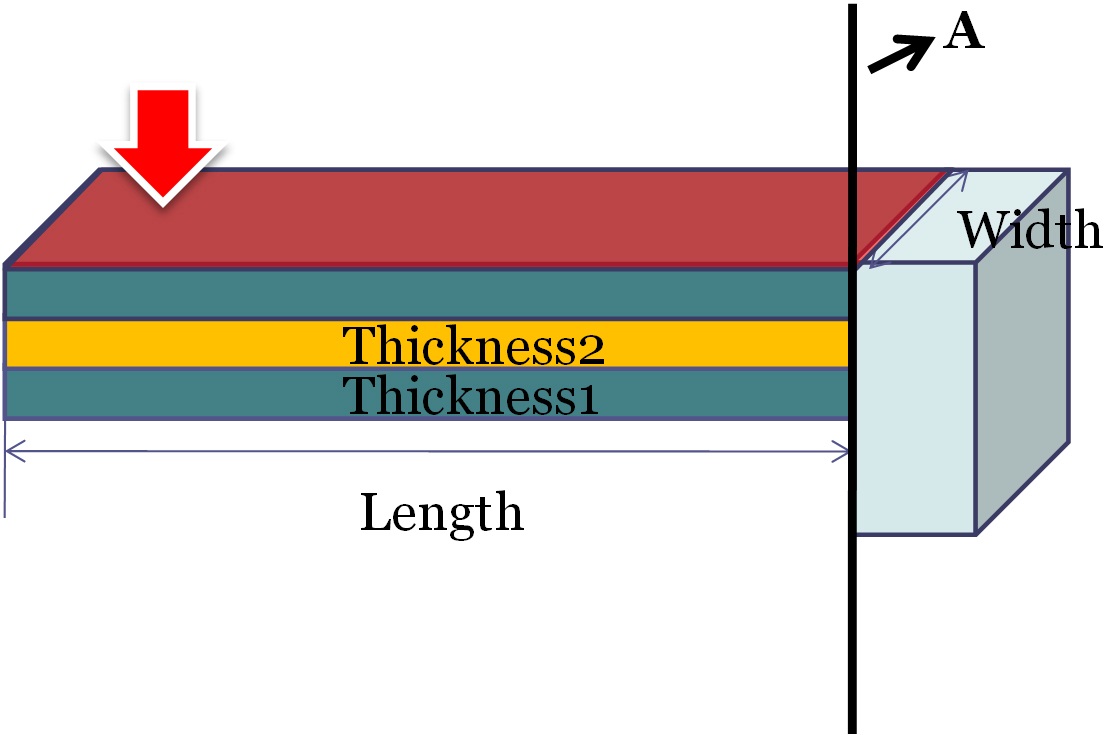
Figure 1 shows the modeling of a piezoelectric energy harvester, which is fixed at line A. It consists of three layers with a top and bottom PZT layer and a metal shim middle layer, chosen for two reasons.
Firstly, the bending element has been chosen because the machinery demands lower resonance frequencies between 50 Hz and 150 Hz, as well as the attainment of higher strains. Second, for a given force input, the cantilever results in the highest average strain, and the output power is closely related to the average strain developed in the bender. Therefore, in order to design an optimized structure, the variables were changed because the resonance frequency and output voltage were different due to cantilever variants, such as materials, length, and width. We used the metal plates aluminum (Al), copper (Cu), and steel use stainless (SUS). In order to check the varying PZT quality, the properties of PZT 4, PZT5A, PZT5H, and PZT 8 were used.
[Table 2.] Simulation variables.
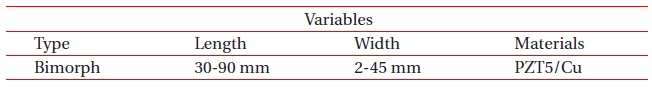
Simulation variables.
The simulation in ANSYS, ver. 10 (ANSYS Inc., Canonsburg, PA, USA)was used and modal, harmonic, and transients of the simulation analysis were performed. Figure 2 is the meshed cantilever and Table 2 shows the simulation condition variables. The damping coefficient is 0.1 and the electric fields are zero. The sine waveform’s force is 1 N, with a duration of 0.005 msec.
3.1 Results for the resonance frequency and output voltage through a harmonic and transient analysis
3.1.1 Tendency of the output voltage when changing the PZT and metal properties
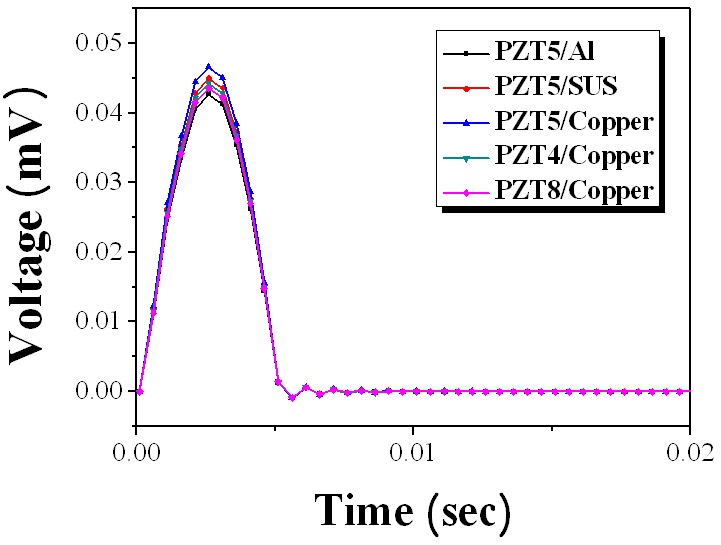
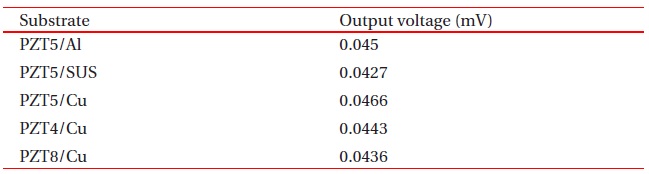
Transient analysis is able to attain an output voltage and was performed in order to select the PZT and metal materials [13]. The PZT material can be categorized into three types, as follows: soft, hard, and neutral. We simulated by selecting a PZT sheet and a metal plate. PZT is divided up into PZT4, PZT5H, and PZT8 [14]. These properties were reported within several papers and were known to simulate the piezoelectric energy harvester. The PZT5H is soft, and PZT 4 is hard, and PZT 8 has a neutral characteristic. Moreover, because the PZT sheet is patched to a metal plate, we also simulated the various types of metal plates, such as Cu, Al, and SUS. Figure 3 and Table 3 show the simulation output volt-ages for each material property. When the PZT properties were compared, PZT 4, PZT 5, and PZT 8 were 0.0443 V, 0.0466 V, and 0.0436 V, respectively. Copper has the highest output voltage of all the metals. Shown in the simulation results, the PZT 5H and the copper plate have a high output voltage in comparison to others. Therefore, the best materials are PZT5H and copper plate.
[Table 3.] Results of the output voltage (mV) when the materials are changed.

Results of the output voltage (mV) when the materials are changed.
3.1.2 Resonance frequency tendencies and the output voltage when changing the length and width
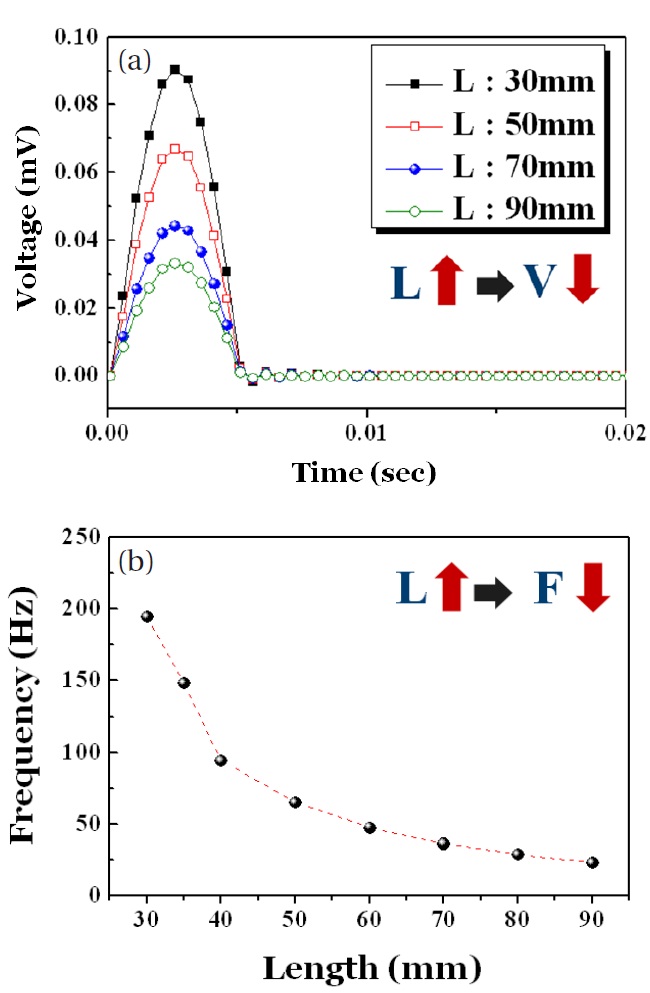
Figures 4(a) and (b) show the resonance frequency and output voltage of the piezoelectric sheet while changing the length via harmonic and transient analysis. As the lengths are changed from 30 mm to 90 mm, with a fixed width of 10 mm, the output voltages decrease from 0.09 mV to 0.03 mV and the resonance frequency slopes also decrease. Therefore, a piezoelectric cantilever’s width is one method used to improve the output voltage within industry.
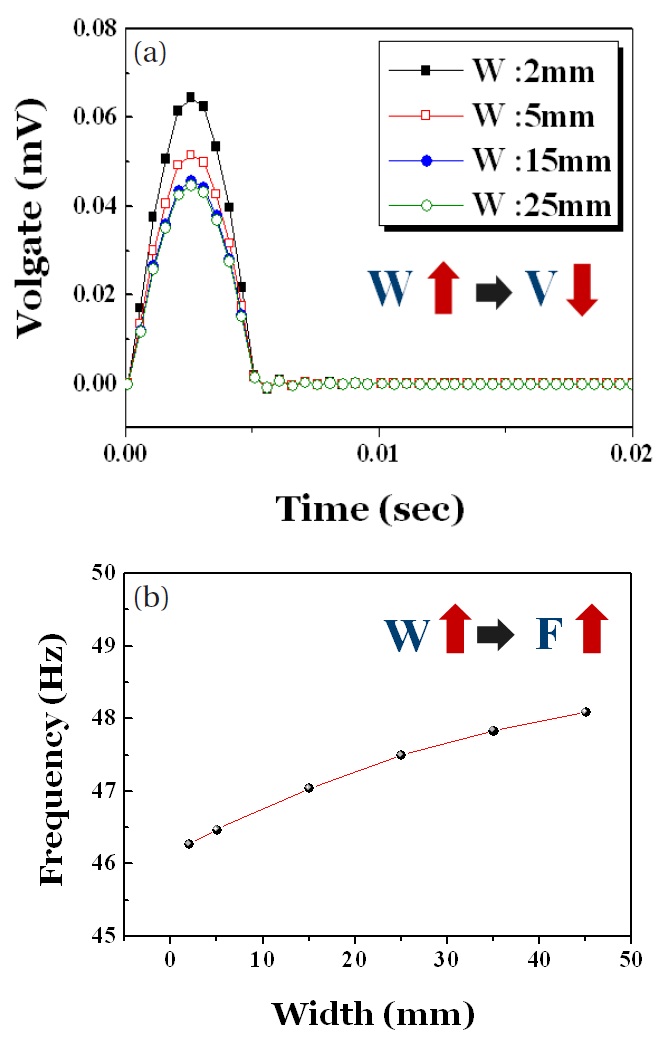
Figures 5(a) and (b) show the resonance frequency and output voltage of the piezoelectric sheet when the width changes via harmonic and transient analysis. These widths are changed from 2 mm to 25 mm, with a fixed length of 60 mm. Its output voltage slope decreases when increasing from 2 mm until 15 mm of the width of the piezoelectric bimorph cantilever, but had close to the same values when the width if greater than 15 mm. Contrary to the length results, the slope of the resonance frequency increases slightly. However, the length variable is more susceptible to resonance frequency because the width of the piezoelectric bimorph cantilever is almost unchanged when compared to the length. As mentioned, for the case of machinery, mechanical vibration has 50~150 Hz, which is a natural frequency. In order to utilize this energy harvester, the lengths of ≥60 mm and ≤40 mm are not used because they have a resonance frequency of ≤50 Hz and ≥150 Hz. Therefore, we selected the size of piezoelectric energy harvester via simulation results. The size is 60×35×0.02 mm3 and 33 × 35 × 0.02 mm3 and they have the resonance frequency of 50 Hz and 150 Hz, respectively. Figures 4 and 5 and Table 4 show the simulation results for both the L-60 and L-33 piezoelec-tric energy harvester types.
[Table 4.] Simulation results.
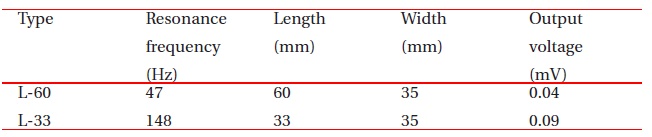
Simulation results.
3.2 Evaluation of the power generation system
3.2.1 Measurement method
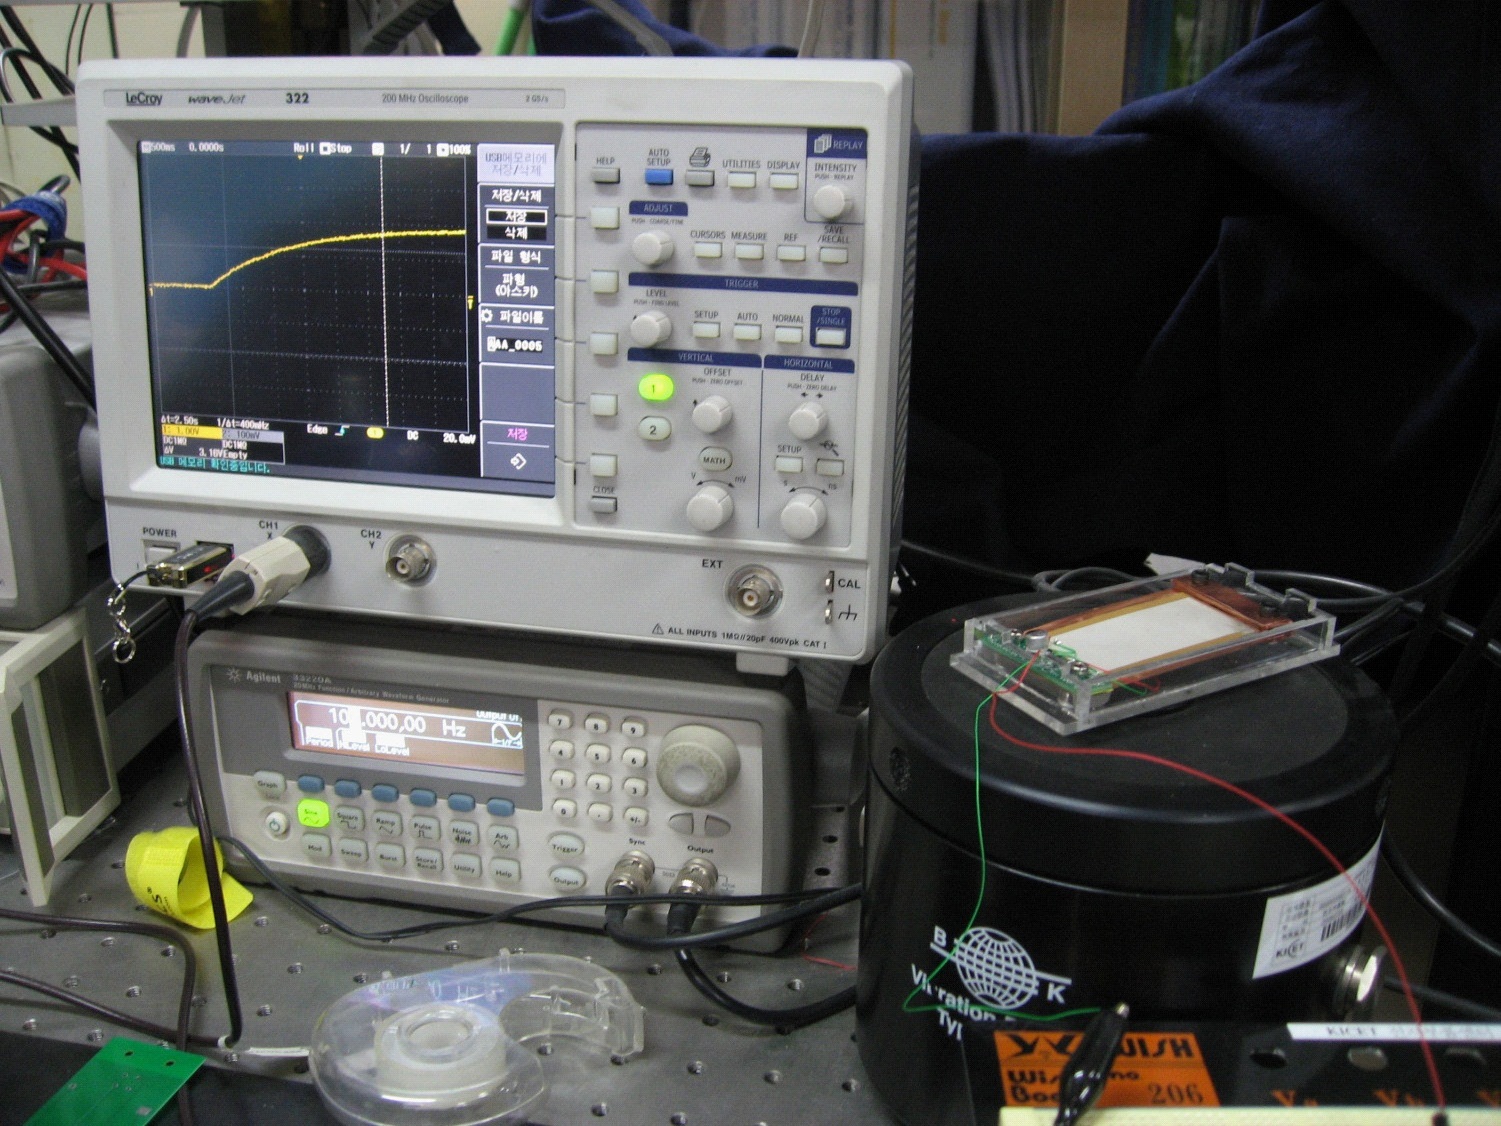
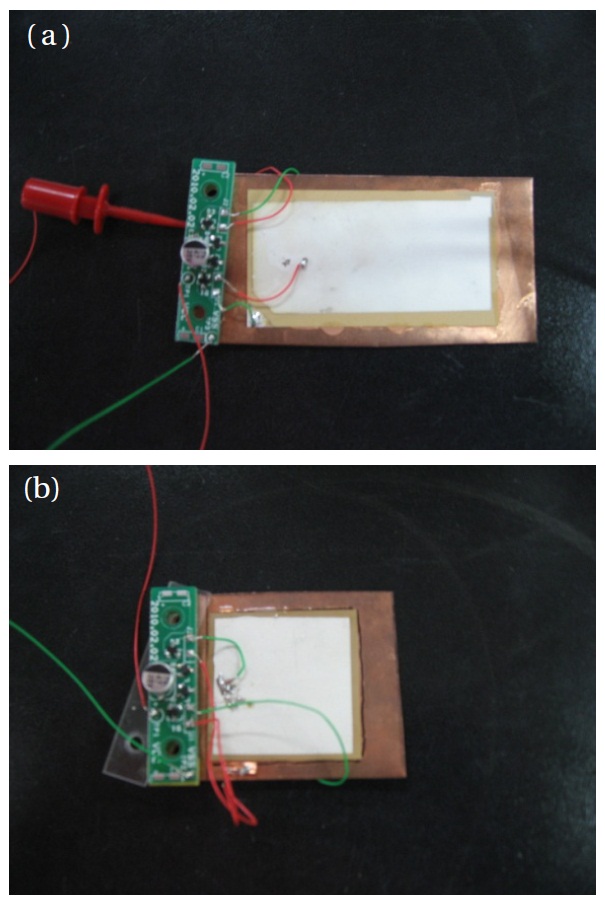
In order to design a structure able to use 50 Hz, Bimorph type cantilevers are produced for demonstrating a feasibility study about the simulation results and measurement. Figures 6(a) and (b) show the produced bimorph piezoelectric energy harvester and then, we named one (a) sample L-60 and the other (b) sam-ple L-33. The output voltages for each were measured with the first mode resonance frequency is the largest on the Z axis. Figure 7 shows the measuring instrument. When a vibration exciter was vibrated, the Piezoelectric Energy Harvester was measured with variable frequencies and load resistivities. Then, the output voltage was measured via an oscilloscope.
3.2.2 Measurement and evaluation of L-60 and L-33 piezoelectric energy harvester types
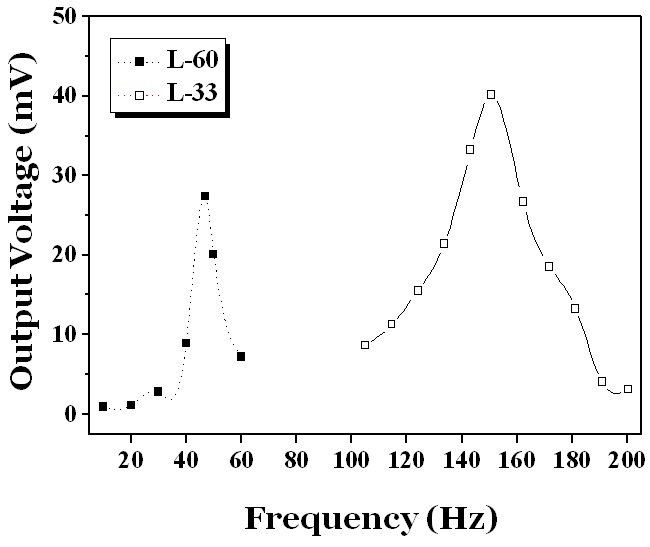
The measurement results in Fig. 8 show the output voltage (mV ) produced from both the L-60 and L-33 types when the input natural frequency changes. Then, the output voltage was measured when the frequency was 10~200 Hz and 10 MΩ. In the resulting measurement, the output voltage obtained the best value within the resonance frequency band, but it dropped remarkably within the other bands. When the L-60 type has a resonance frequency of 47 Hz, the output voltage was 27.4 mV. Similar to the L-33 type, it has 148 Hz and 40.6 mV. Moreover, these results have a similar band of resonance frequency in comparison to the simulation. Consequently, piezoelectric energy harvesters, having a resonance frequency of both 50 Hz and 150 Hz, were produced.
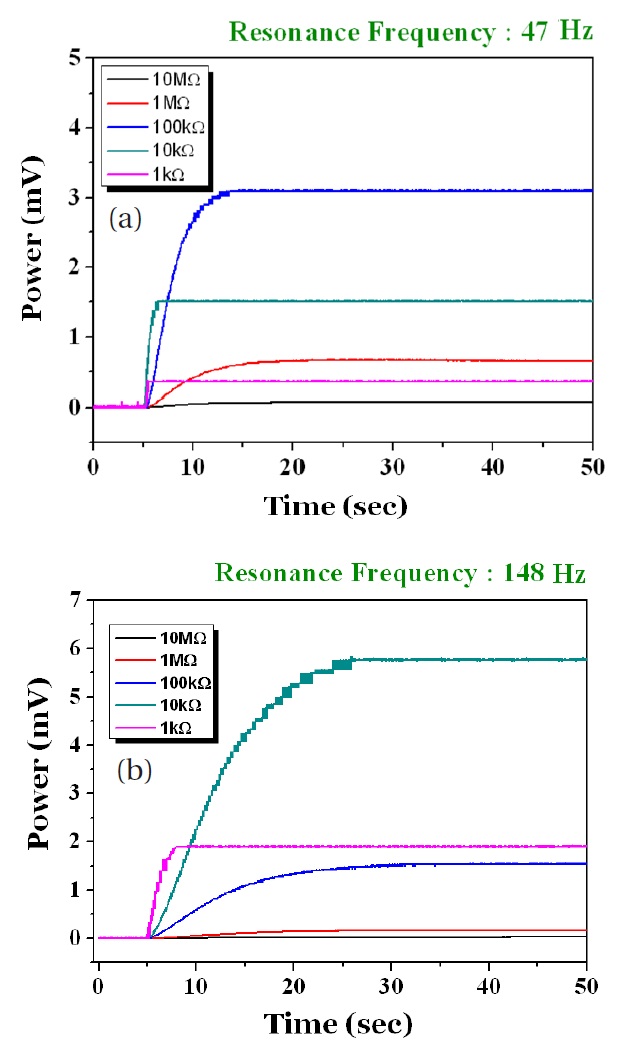
Figures 9(a) and (b) show the measurement results of output power density for both L-60 and L-33 type energy harvesters at resonance frequency, which causes the load resistivity range to be from 1 kΩ to 10 MΩ. As shown in Figure 9(a), the L-60 type was measured in order to prove the validity and the load resistivity was changed from 1 kΩ to 10 MΩ when the resonance fre-quency was 47 Hz. The measurement results show that the best power can be attained at 3.1 mV with a load resistivity of 100 kΩ. Similar to the L-33 type, Fig. 9(b) shows the power density (mV) when load resistivity was changed from 1 kΩ to 10 MΩ with a fixed frequency of 148 Hz.
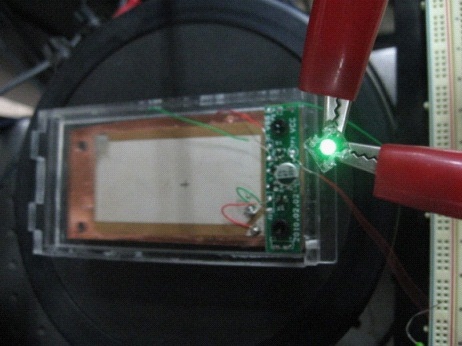
This study uses a rectifier circuit in order to disregard the impedance matching and the capacitor of 47 μF. An analysis study for bimorph, the piezoelectric energy harvesters, having the resonance frequency of 50 Hz and 150 Hz, were produced and the output voltages of L-60 and L-33 were then 3.1 mW/s and 5.8 mW/s, respectively. Next, as shown in Figure 10, in order to check the output electricity, the produced piezoelectric energy harvester was connected to a Light Emitting Diode (LED) lamp (BIWV-PB5C3T, Ningbo-Bright cop., Ningbo, China). When the energy harvester vibrated, the LED lamp lit up.
In this study, the piezoelectric energy harvester is produced in order to use piezoelectric able to convert unused mechanical vibration energy to electrical energy, such as with motor and machinery, which has a natural frequency of approximately 50~150 Hz. Our primary focus was to investigate how to improve the energy efficiency.
First, in order to optimize the structure and show the tendency, a piezoelectric cantilever was designed and produced to demonstrate a feasibility study about the simulation results and measurements.
Second, the materials of the cantilever are selected and simulated with the resonance frequency and output voltage of the piezoelectric while changing the length and width via harmonic and transient analysis.
Third, shown in the simulation results, in order to design a structure able to use 50 Hz and 150 Hz, Bimorph type cantilevers were produced and their sizes were mm2 and mm2. The output voltages of were measured where the first mode resonance frequency is the largest on the Z axis.
Finally, in the simulation results, we show that the LED lamp lit up when an energy harvester was vibrated. The power was compared between an L-60 and L-33 energy harvester, with output voltages of L-60 and L-33 being 3.1 mW/s and 5.8 mW/s, respectively.


![Results of (a) output voltage [mV] and (b) Resonance Frequen-cy (Hz) when changing the cantilever length.](http://oak.go.kr/repository/journal/12904/E1TEAO_2010_v11n5_206_f004.jpg)