After the Fukushima accident, an increasing interest has been raised in passive safety systems that effectively cools down the reactor core even in the case when entire onsite and off-site powers are unavailable due to unexpected causes such as natural disasters. The Passive Auxiliary Feedwater System (PAFS) is one of the advanced safety features under development for an Advanced Power Reactor Plus (APR+) in South Korea. Because the PAFS removes decay heat from the reactor core under transient and accident conditions, it is important to properly evaluate the heat capability of PAFS under the postulated accident conditions [1]. With the aim of validating the cooling performance of the PAFS, the experimental program of the separate effect test and integral effect test were carried out at the Korea Atomic Energy Research Institute (KAERI) [2]. As an experimental program, the PAFS Condensing heat removal Assessment Loop (PASCAL) test facility was constructed to investigate the condensation heat transfer and natural convection phenomena in the PAFS [3].
In addition to the experimental research, it is important to use a safety analysis code because it is required to simulate various postulated accidents that cannot be done by experiments. Thus, the assessment for the calculation performance of the safety analysis code was also performed using the Multi-dimensional Analysis of Reactor Safety (MARS) code developed at KAERI [4]. A comparison of the calculation results against the experimental data found that the model of the condensation heat transfer in the MARS code underestimated the condensation heat transfer at the inner surfaces of the condensation heat exchanger in the PAFS.
Therefore, in this paper, existing models for condensation heat transfer inside a pipe were assessed by implementing the models into the MARS code and comparing the MARS calculation result with the PASCAL experimental data. The condensation models used for the assessment were the Shah model [5], Thome model [6], and modified Shah model [7]. Through assessment of the results, the development direction for the proper model to simulate the condensation heat transfer in the PAFS was suggested.
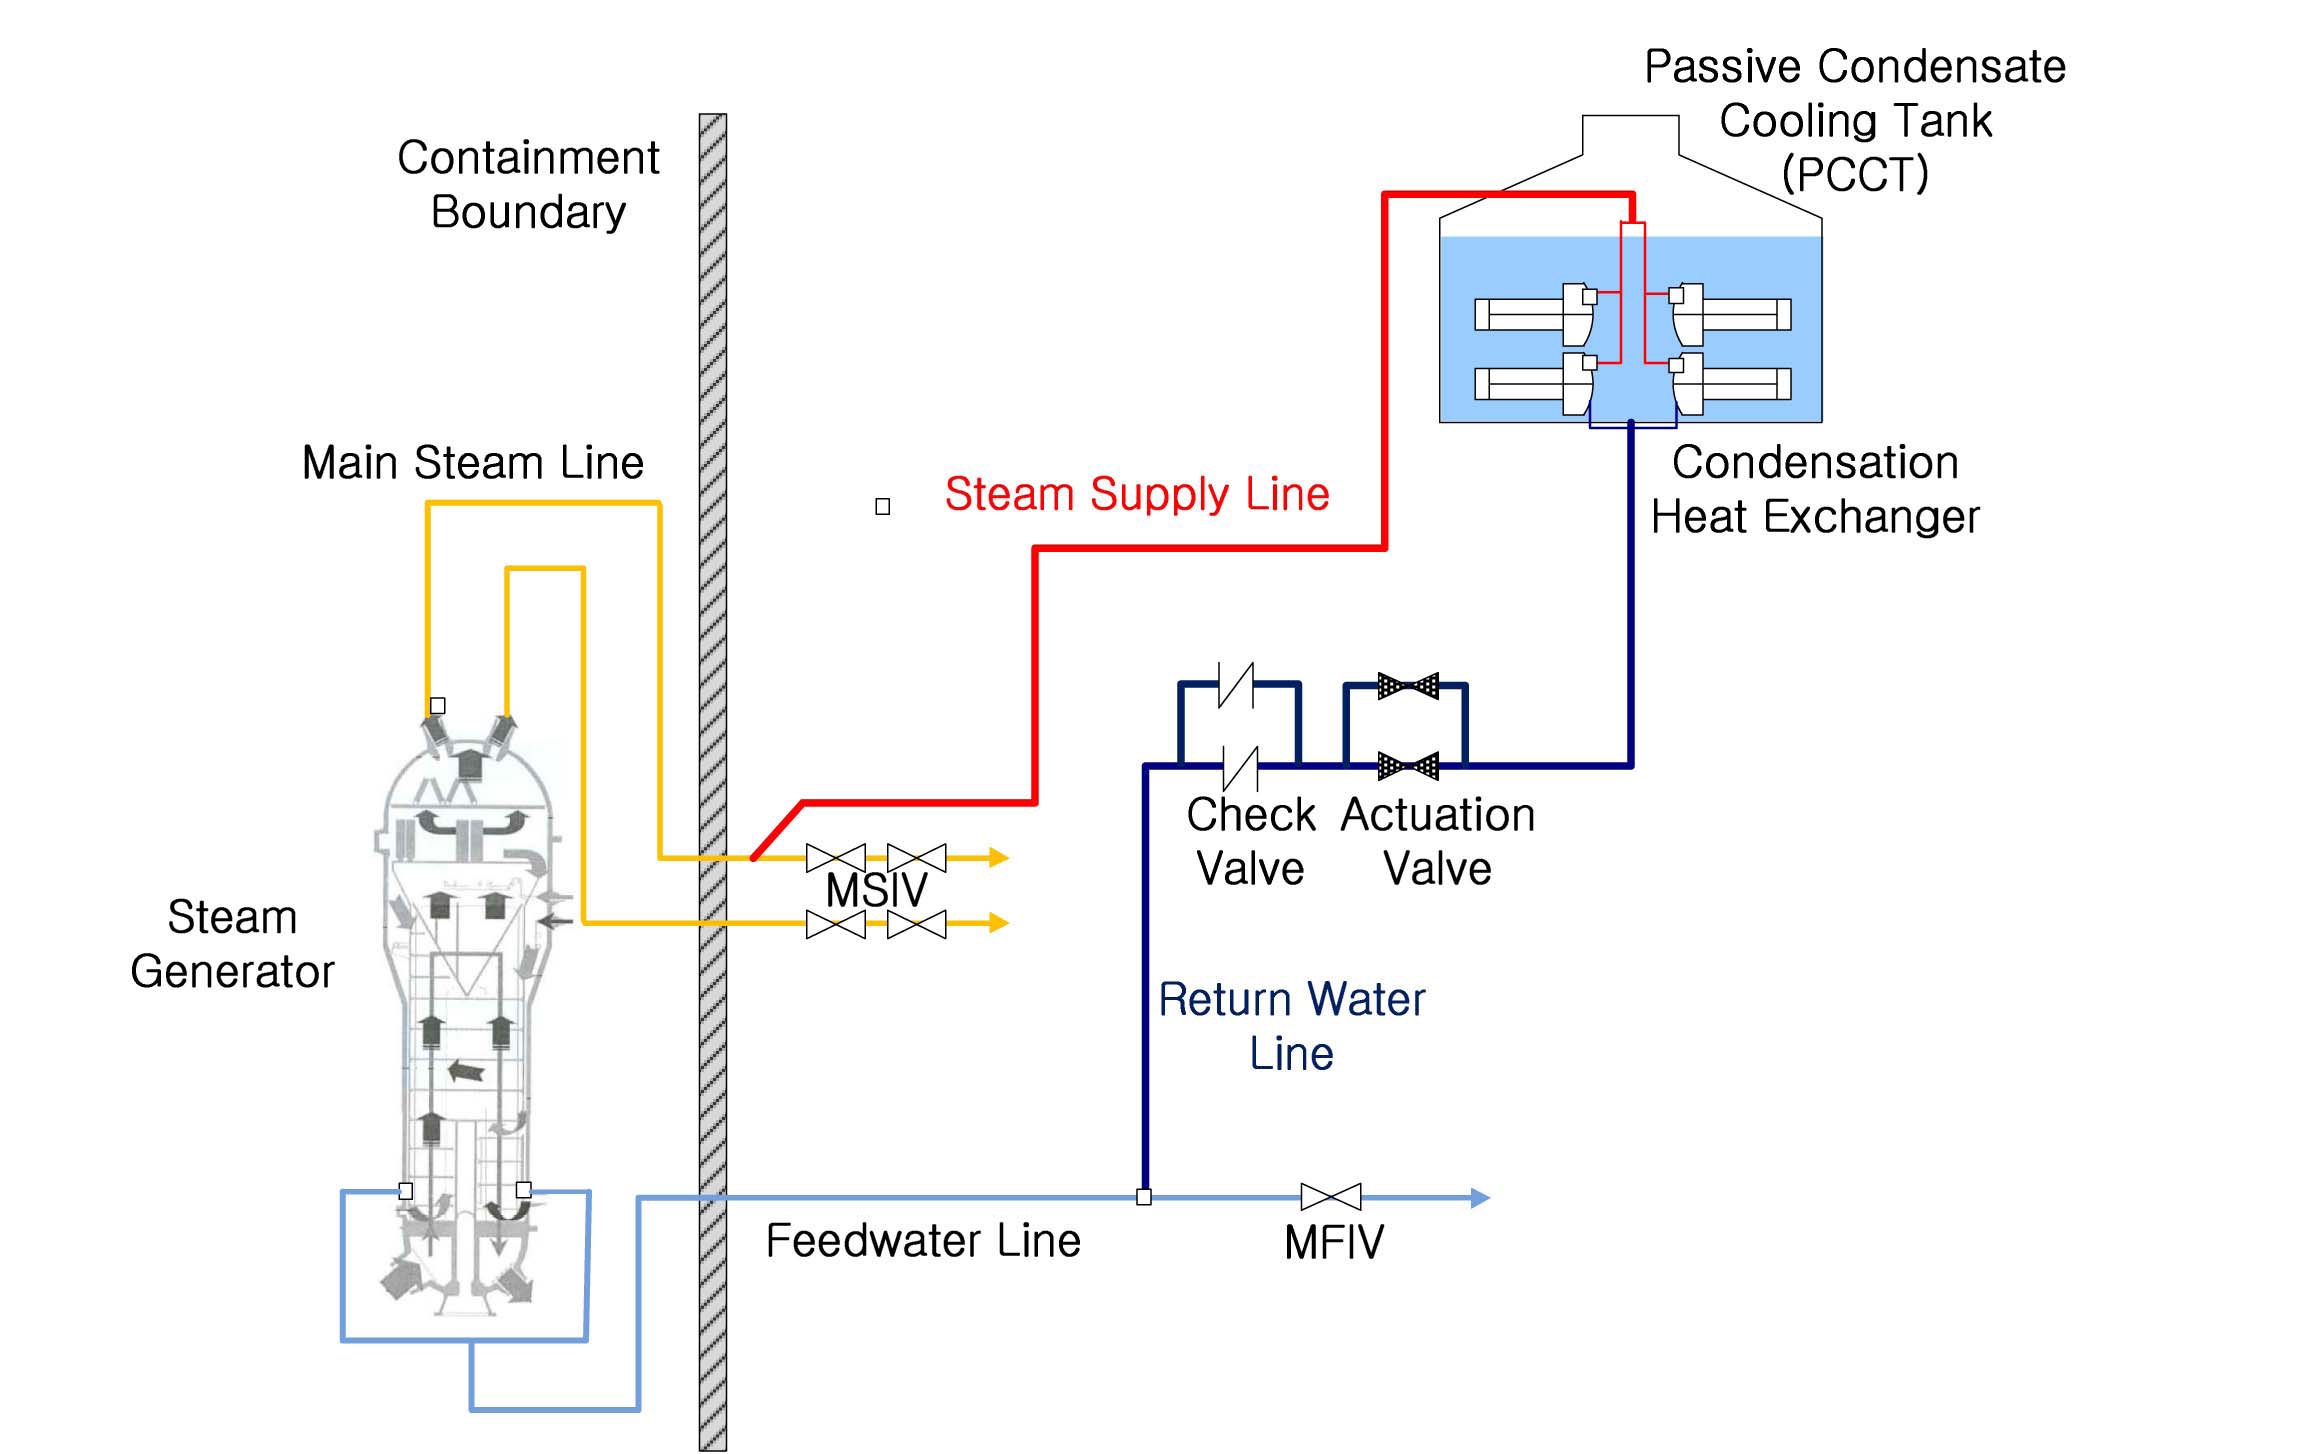
The PAFS is designed to be separately installed in each
secondary side of APR+ instead of a conventional active auxiliary feedwater system. The steam from a steam generator (SG) flows into the passive condensation heat exchanger (PCHX) submerged in a passive condensate cooling tank (PCCT) and the condensate goes into the steam generator through the economizer nozzle. The schematics of PAFS in a single loop is shown in Fig. 1.
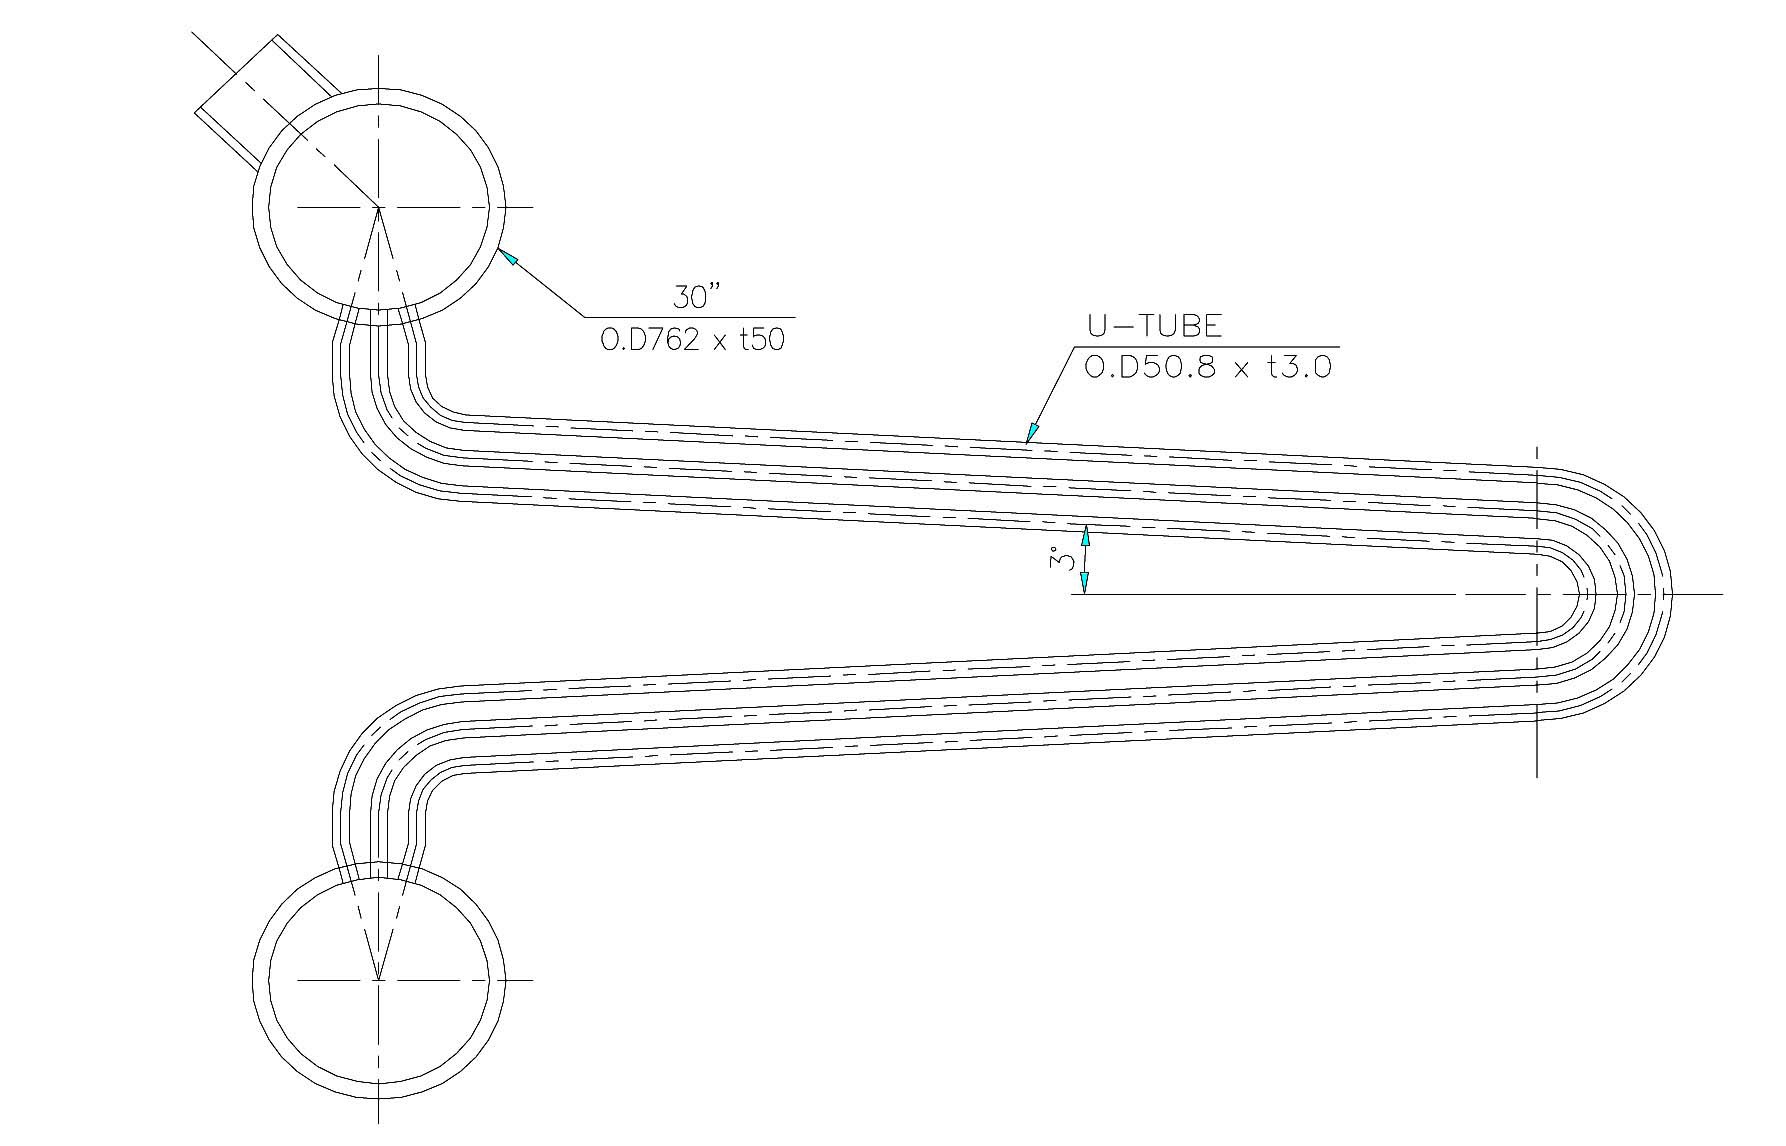
The PAFS removes decay heat using natural circulation through a PCHX, which consists of 4 tube bundles. One tube bundle has 60 horizontal condensate tubes [8]. The condensate tube has 3 degree of inclination to prevent a water hammer effect as shown in Fig. 2.
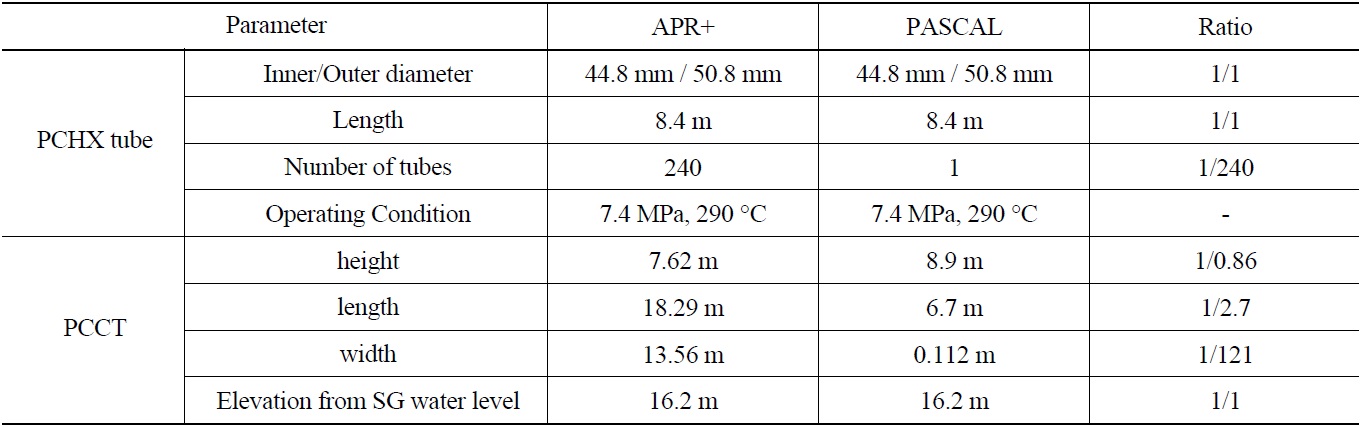
The PASCAL test facility simulates a single tube among 240 tubes in the prototype, that is, the volumetric scaling ratio of the facility is 1/240. The volume of the PCCT pool was also reduced to 1/240 of the prototype. The length and width of the PCCT in the PASCAL facility are 6.7 m and 0.112 m, respectively, and the height of the PCCT is 11.484 m. The major design and scaling parameters of the PASCAL facility are compared with those of the prototype in Table 1.
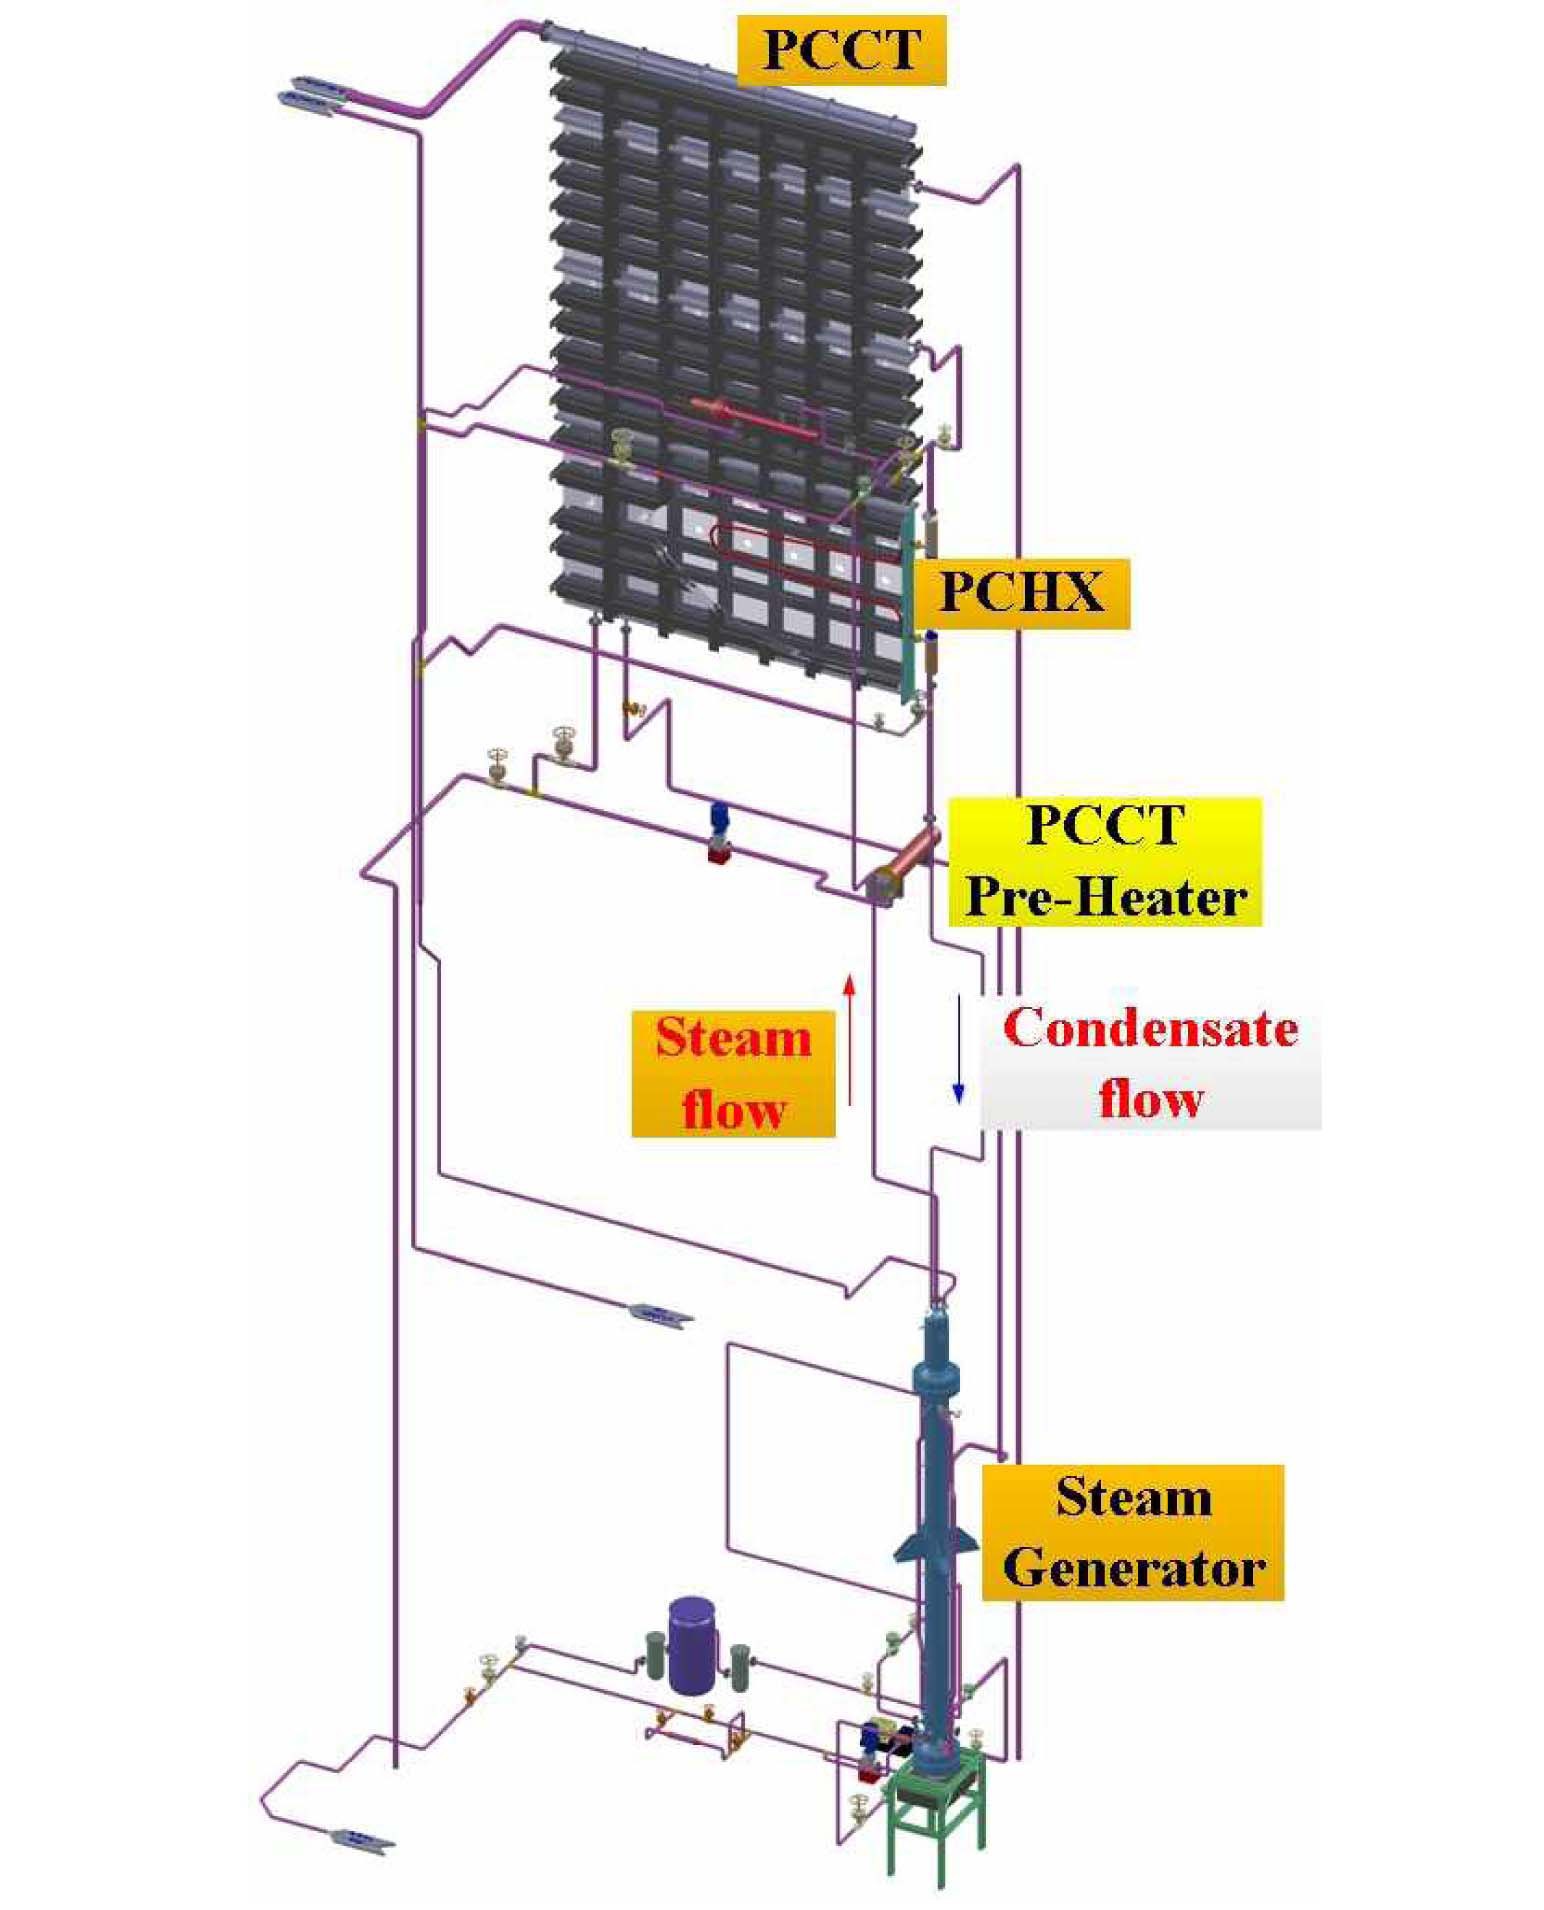
Fig. 3 shows a three-dimensional view of the PASCAL facility. A steam generator in the PASCAL facility plays a role in supplying saturated steam to the passive condensation heat exchanger (PCHX) tube. An electrical heater in the steam generator provides a heat source which scales down the heat transfer rate at the U-tube surface in the prototype steam generator. The maximum thermal power of the heater is 800 kW.
To preserve a driving force of the natural convection in the loop, the elevation difference between the mixture level in the steam generator and the PCHX tube was maintained to be equivalent to that of the prototype. The steam generator was connected to the PCHX tube with a steam-supply line and a return-water line.
3. MARS MODEL FOR SIMULATION OF PASCAL
3.1 Test and Calculation Cases
A MARS calculation was performed for a quasi-steady state test in PASCAL. Since it is necessary for a single train of the PAFS to be able to remove 129.8 MW as the maximum heat removal rate, 540 kW of thermal power was supplied in the steam generator heater as a rated power of SS-540-P1 test according to the scaling ratio of the facility. SS indicates a combined experiment of the simulation for a quasi-steady state condition. For a sensitivity study of the thermal power, the experiments with 300 kW, 400 kW, 650 kW, and 750 kW were conducted as SS-300-P1, SS-400-P1,
[Table 1.] Design and Scaling Parameters of PASCAL

Design and Scaling Parameters of PASCAL
SS-650-P1, and SS-750-P1, respectively.
Because it was impossible to acquire an exact steady state value in the tests due to the continuous decrease of water level in the PCCT, a quasi-steady state was assumed under two conditions: 1) the flow rate of natural circulation, the system pressure and loop temperatures exceed the peak value, 2) the water level of the PCCT reaches the target value, 9.3 m. The experimental quasi-steady values were used as the initial conditions for the calculation, and the values when the PCCT level reaches 9.3 m in the calculations were compared with the experimental data.
From the previous calculation result, it was concluded that the condensation heat transfer model in the MARS code should be modified or improved to properly simulate the heat transfer in the PASCAL. A literature survey gives us two possible condensation heat transfer models: the Thome model and the modified Shah model. First, the characteristics of the condensation heat transfer models used in the calculation were compared. Then the MARS calculation was performed and the results were compared with the PASCAL test data.
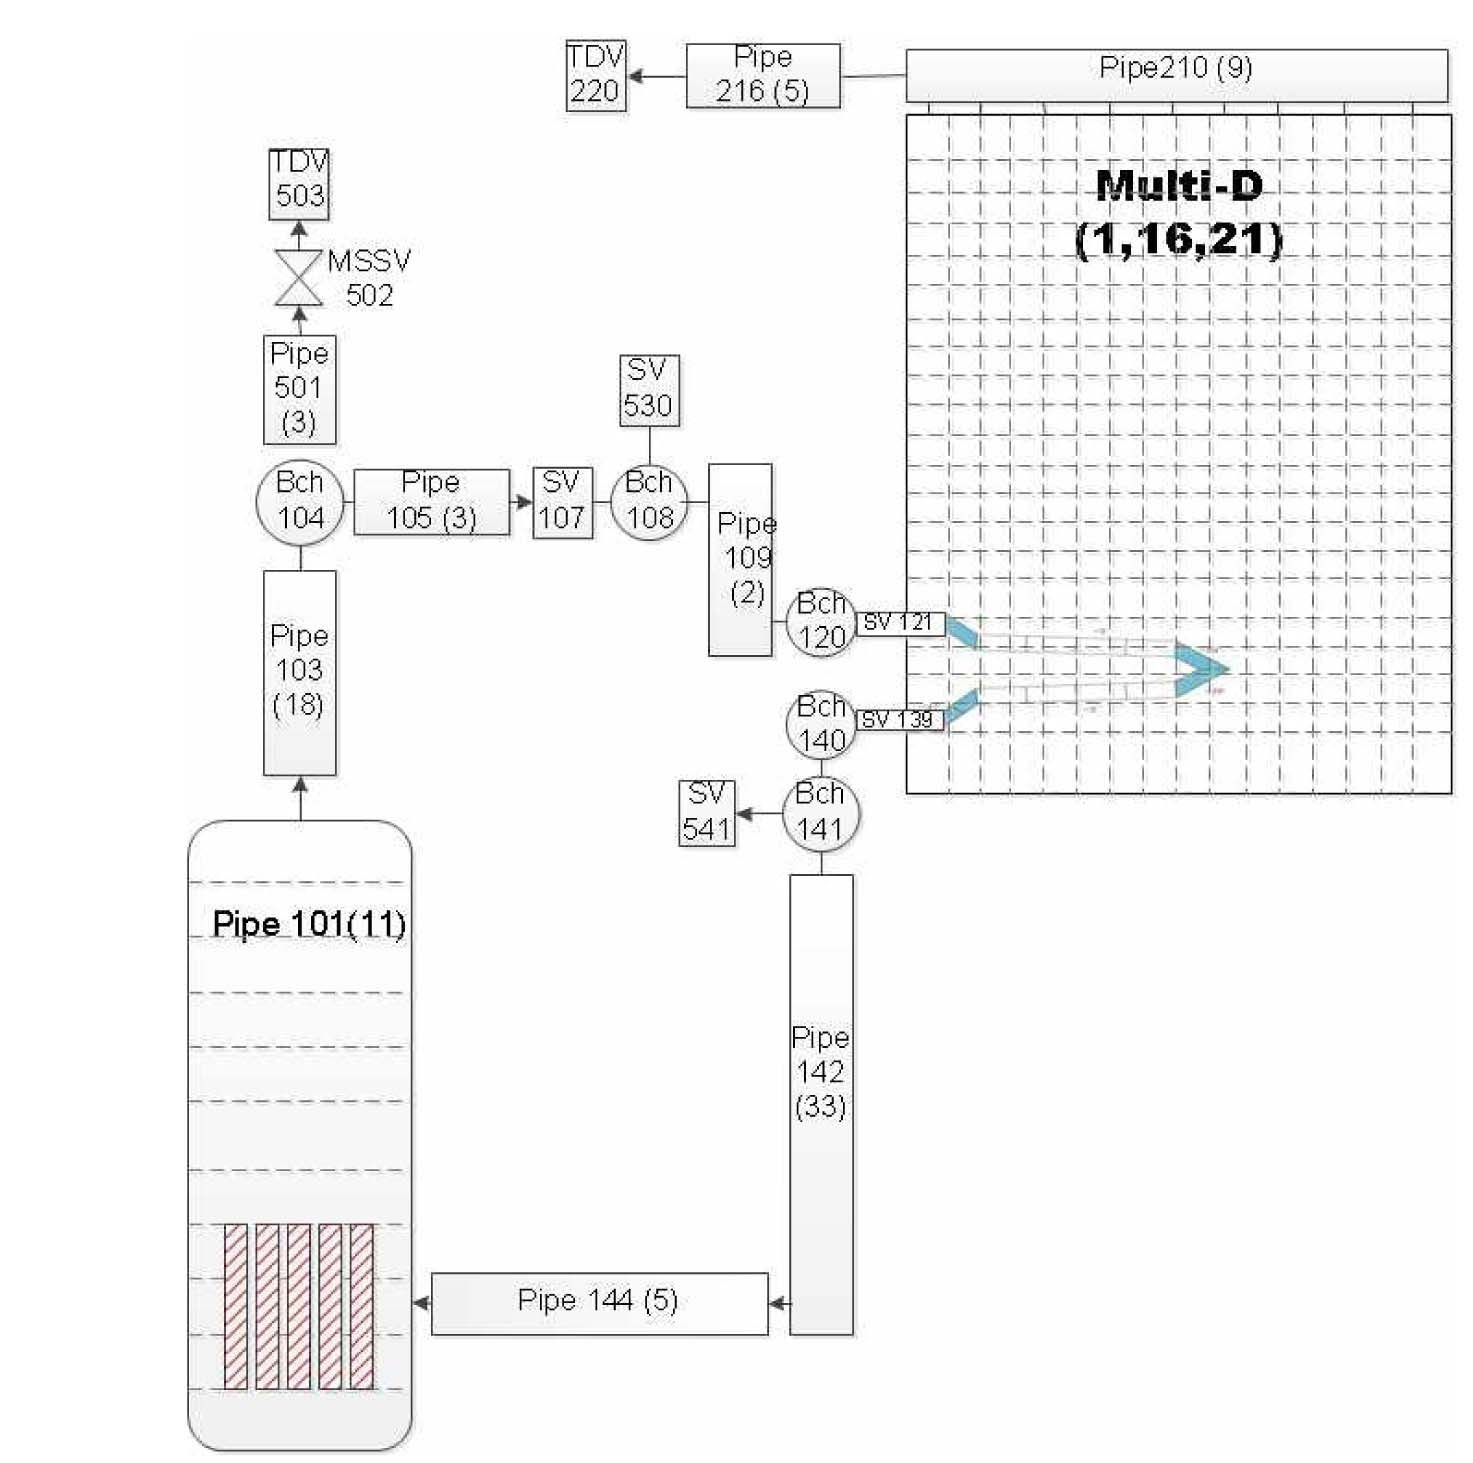
MARS nodalization for PASCAL was generated as shown in Fig. 4. The steam generator, steam supply line, condensation tube, and return water line were one-dimensionally nodalized with the pipe components. The PCCT was modeled using a multi-dimensional component with 1-16-21 (x-y-z) nodes as a result of a node sensitivity test.
To simulate the form loss effect due to the supporting structures in the PCCT, the MARS code requires a form loss coefficient in a junction. Thus, sensitivity tests are performed by varying the form loss coefficient, and the temperature distributions in the PCCT are compared between the results of the experiment and calculation.
4. CONDENSATION HEAT TRANSFER MODEL
MARS code uses Nusselt’s model and Shah’s model for condensation heat transfer [5]. When the MARS code calculates the heat transfer coefficient using Shah’s model, the maximum value is selected between the calculated heat transfer coefficient using Nusselt and Shah’s correlation. In addition to the default models in the MARS code, the modified Shah model and the Thome model are also reviewed and used for comparison.
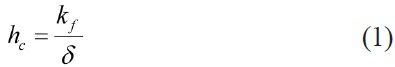
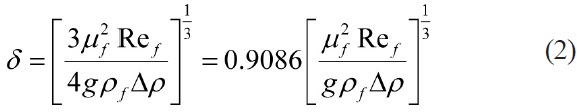
Nusselt’s model uses the film thickness, δ, as the key parameter instead of the temperature difference as shown in Eq. (1) and Eq. (2). Nusselt’s model is used for laminar region and the minimum thickness of the liquid film fixed as the 10 microns in the MARS code.
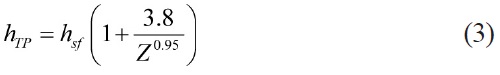
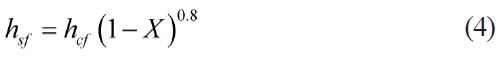
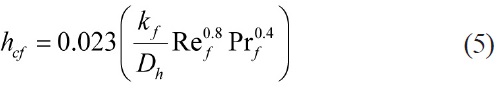
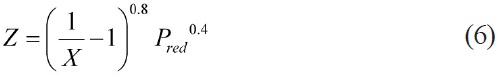
Shah calculated the condensation heat transfer coefficient from the single phase heat transfer coefficient by Dittus-Boelter as described in Eq. (3) ~ (5). The effects of pressure and quality are considered by the parameter Z as shown in Eq. (6).
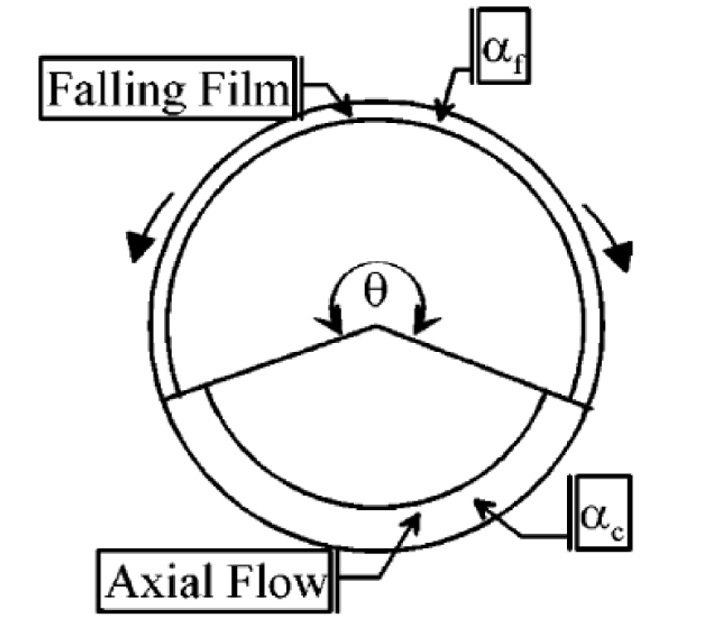
Thome developed a condensation model using various ranges of experimental data performed for a horizontal tube [6,9]. The Thome model assumes that two types of heat transfer mechanisms occur in the tube: convective condensation and film condensation. As shown in Fig. 5, the convective condensation heat transfer coefficient
The general expression for the local condensing heat transfer coefficient
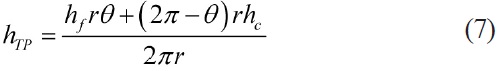
In Eq. (7),
The convective condensation heat transfer coefficient
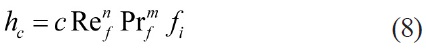
In Eq. (8), it was suggested that
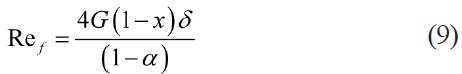
The liquid film Reynolds number is defined as:
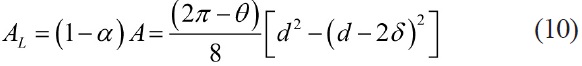
The liquid film thickness can be obtained from the geometrical expression as shown in Eq. (10).
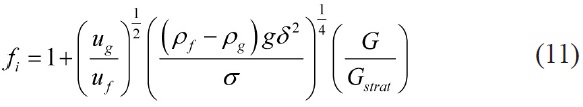
Thome introduced the interfacial roughness correction factor
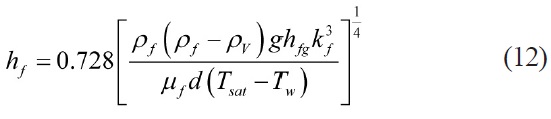
The film condensation heat transfer coefficient
To avoid any iterative calculations, Thome uses the explicit expression for the upper angle of the tube not wetted by stratified liquid (
After three decades since Shah proposed a general correlation for the heat transfer model of film condensation inside tubes, Shah modified his model for applicability to the lower flow rate and broader pressure range [7]. A new paper by Shah deals with 39 experimental data sources for 22 fluids including water, halocarbon refrigerants, hydrocarbon refrigerants, and a variety of organics.
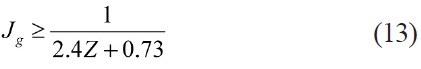
Shah suggested three regimes for vertical or inclined tubes. The boundary between regime I and II is given by the following relation. Regime I occurs when
Regime III is defined as:

Here,
On the other hand, for horizontal tubes Shah suggested two regimes. Regime I occurs when

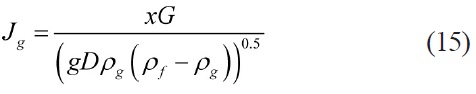
Shah’s modified model uses the two heat transfer equations. For regime I, Eq. (17) is applied.
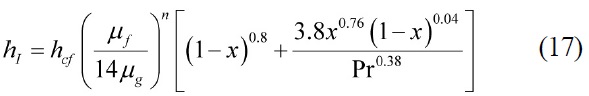
In Eq. (17),
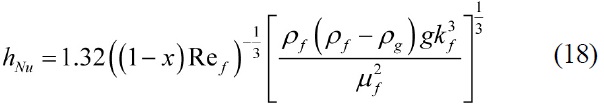
Two heat transfer equations defined by Eq. (17) and Eq. (18) are used as follows:
In regime I: hTP = hI
In regime II: hTP = hI + hNu
In regime III: hTP = hNu
MARS calculation results with four different condensation heat transfer models are compared with PASCAL data: 1) the original Shah model developed in 1979, 2) the Thome model, 3) the modified Shah model for vertical or inclined tubes, and 4) the modified Shah model for horizontal tubes. In fact, the modified Shah model for inclined tubes was developed by using experimental data including the data acquired from a slightly inclined tube with 15 degrees of inclination. However, it is not clear which model is better for predicting the condensation heat transfer in the condensate tube in PCHX between the modified Shah models for the inclined tubes and the horizontal tubes. Because the condensate tube in PCHX has only 3 degree of inclination, it can be considered as a horizontal tube. However, it is also true that the gravity affects the condensate flow. Thus, both models are used in the MARS calculation for comparison.
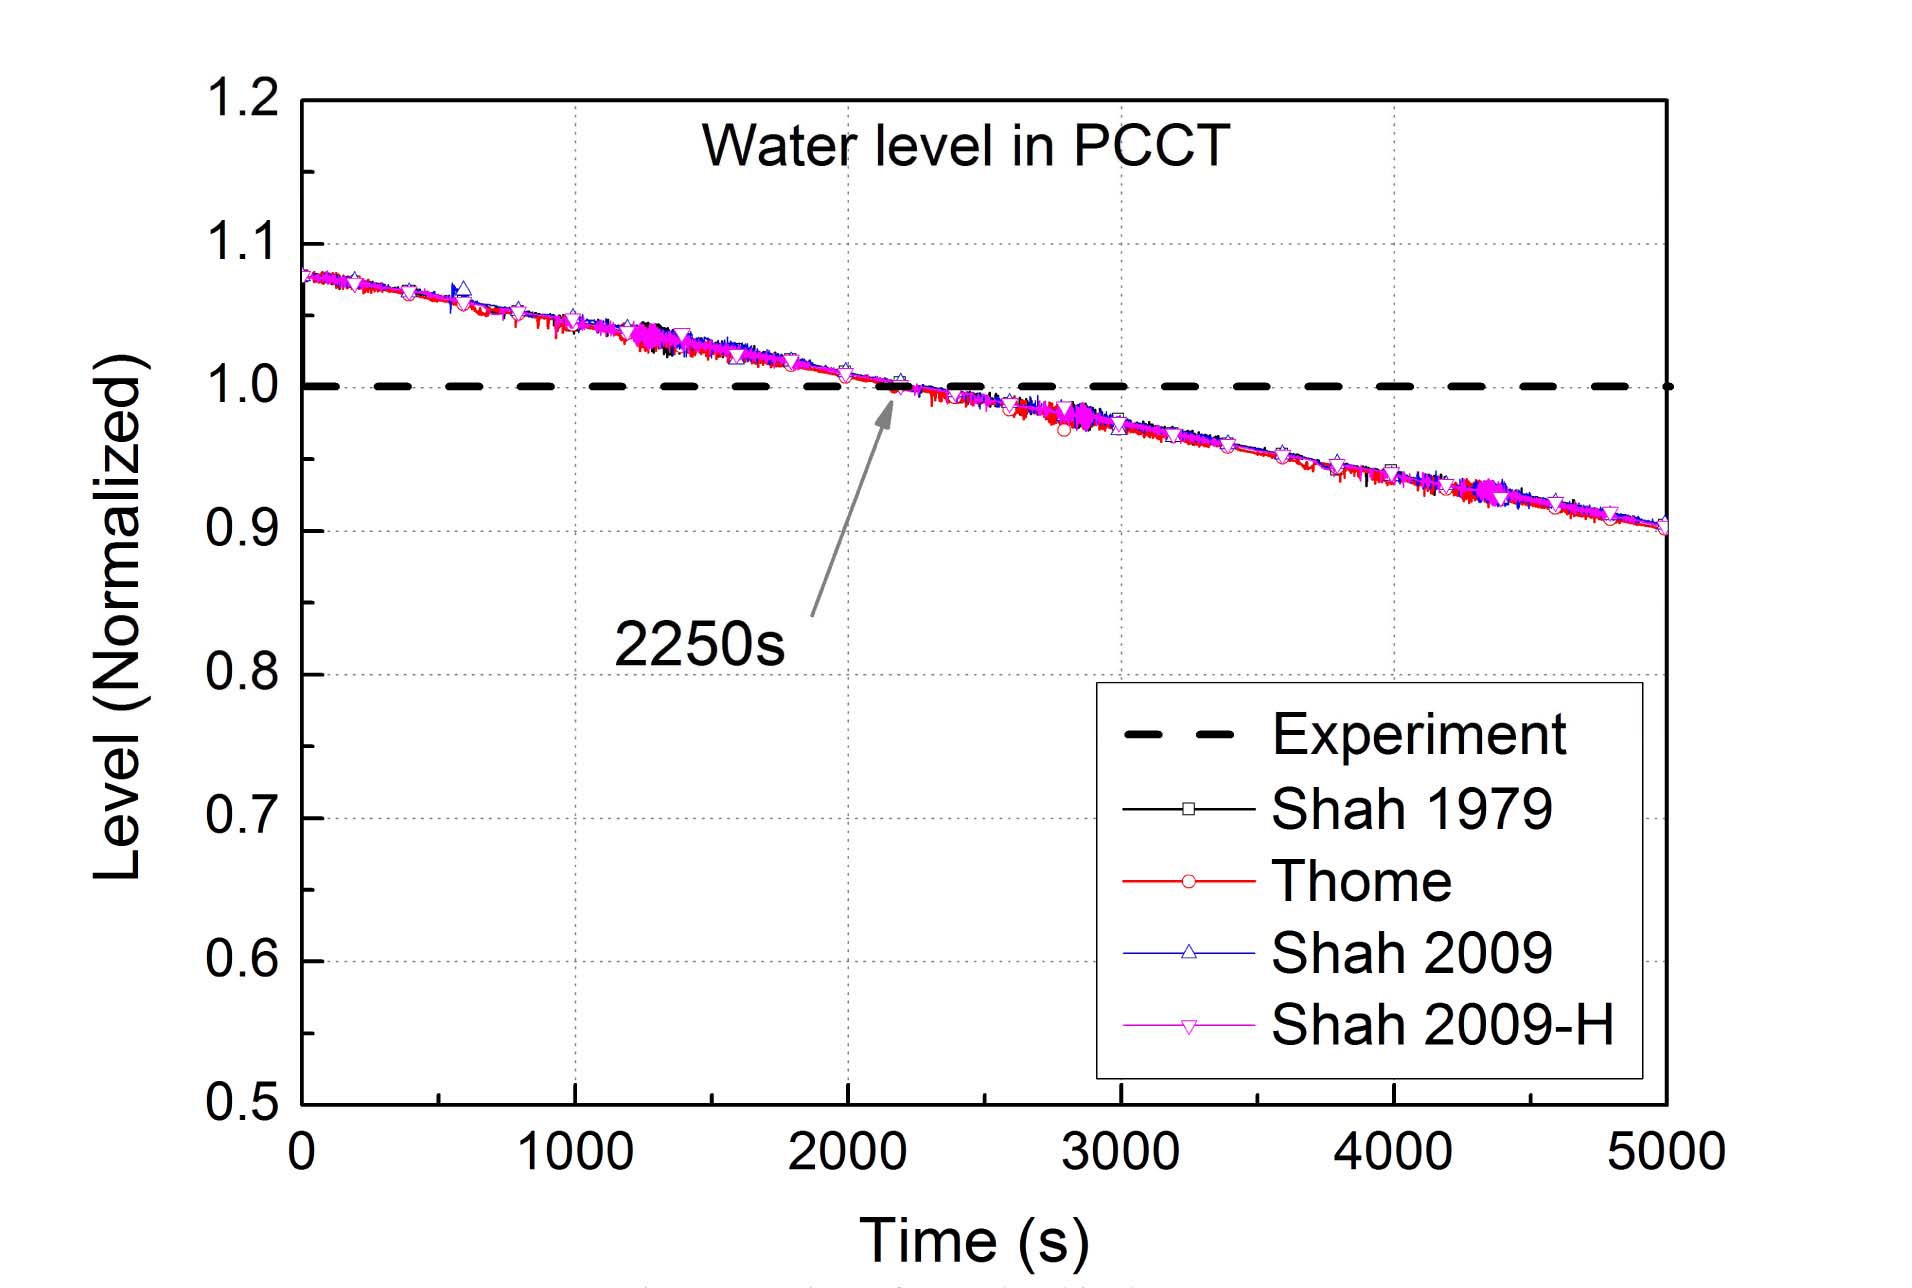
Being the test case with 540 kW of thermal power, the rated case is already explained in Section 3.1, providing a detailed comparison of the results. Other comparative calculations for the test cases with 300, 400, 650, and 750 kW of thermal power will be briefly summarized in the last part of this section. The calculation results were normalized with the quasi-steady test data.
Fig. 6 shows the calculation result of the water level in the PCCT. At 2250 seconds, the PCCT water level reaches the quasi-steady state experimental data, which is depicted by a gray solid line. Thus, the steady state values from the calculation results were extracted at 2250 seconds and compared with the quasi-steady state test data.
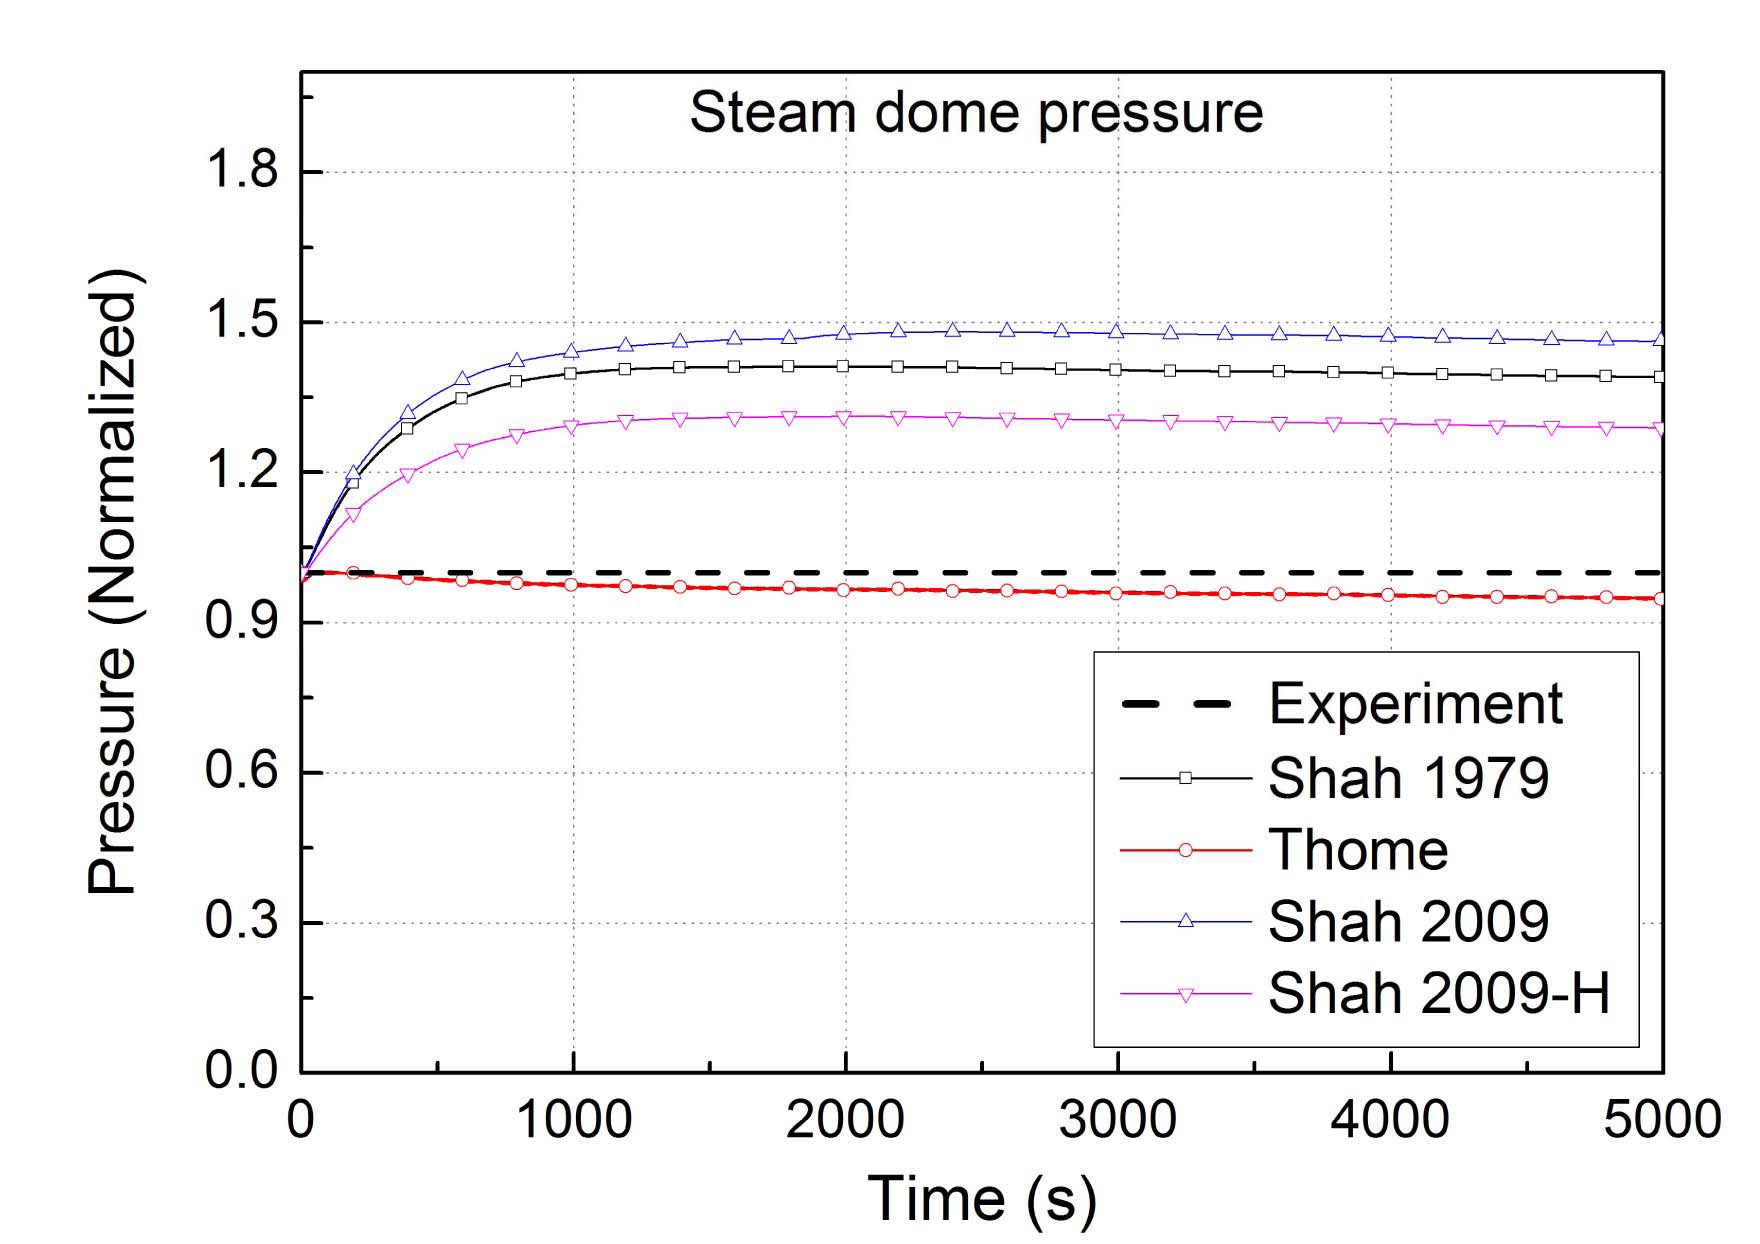
Fig. 7 shows the pressure in the steam dome in the SG. The original MARS code overestimates the system pressure in a quasi-steady state condition at 2250 seconds. Compared with the test data, the original Shah model predicts the pressure in the steam dome as 1.410. The calculations with the Thome model, and the modified Shah model for inclined tubes and horizontal tubes, show the pressure of 0.955, 1.479, and 1.310, respectively.
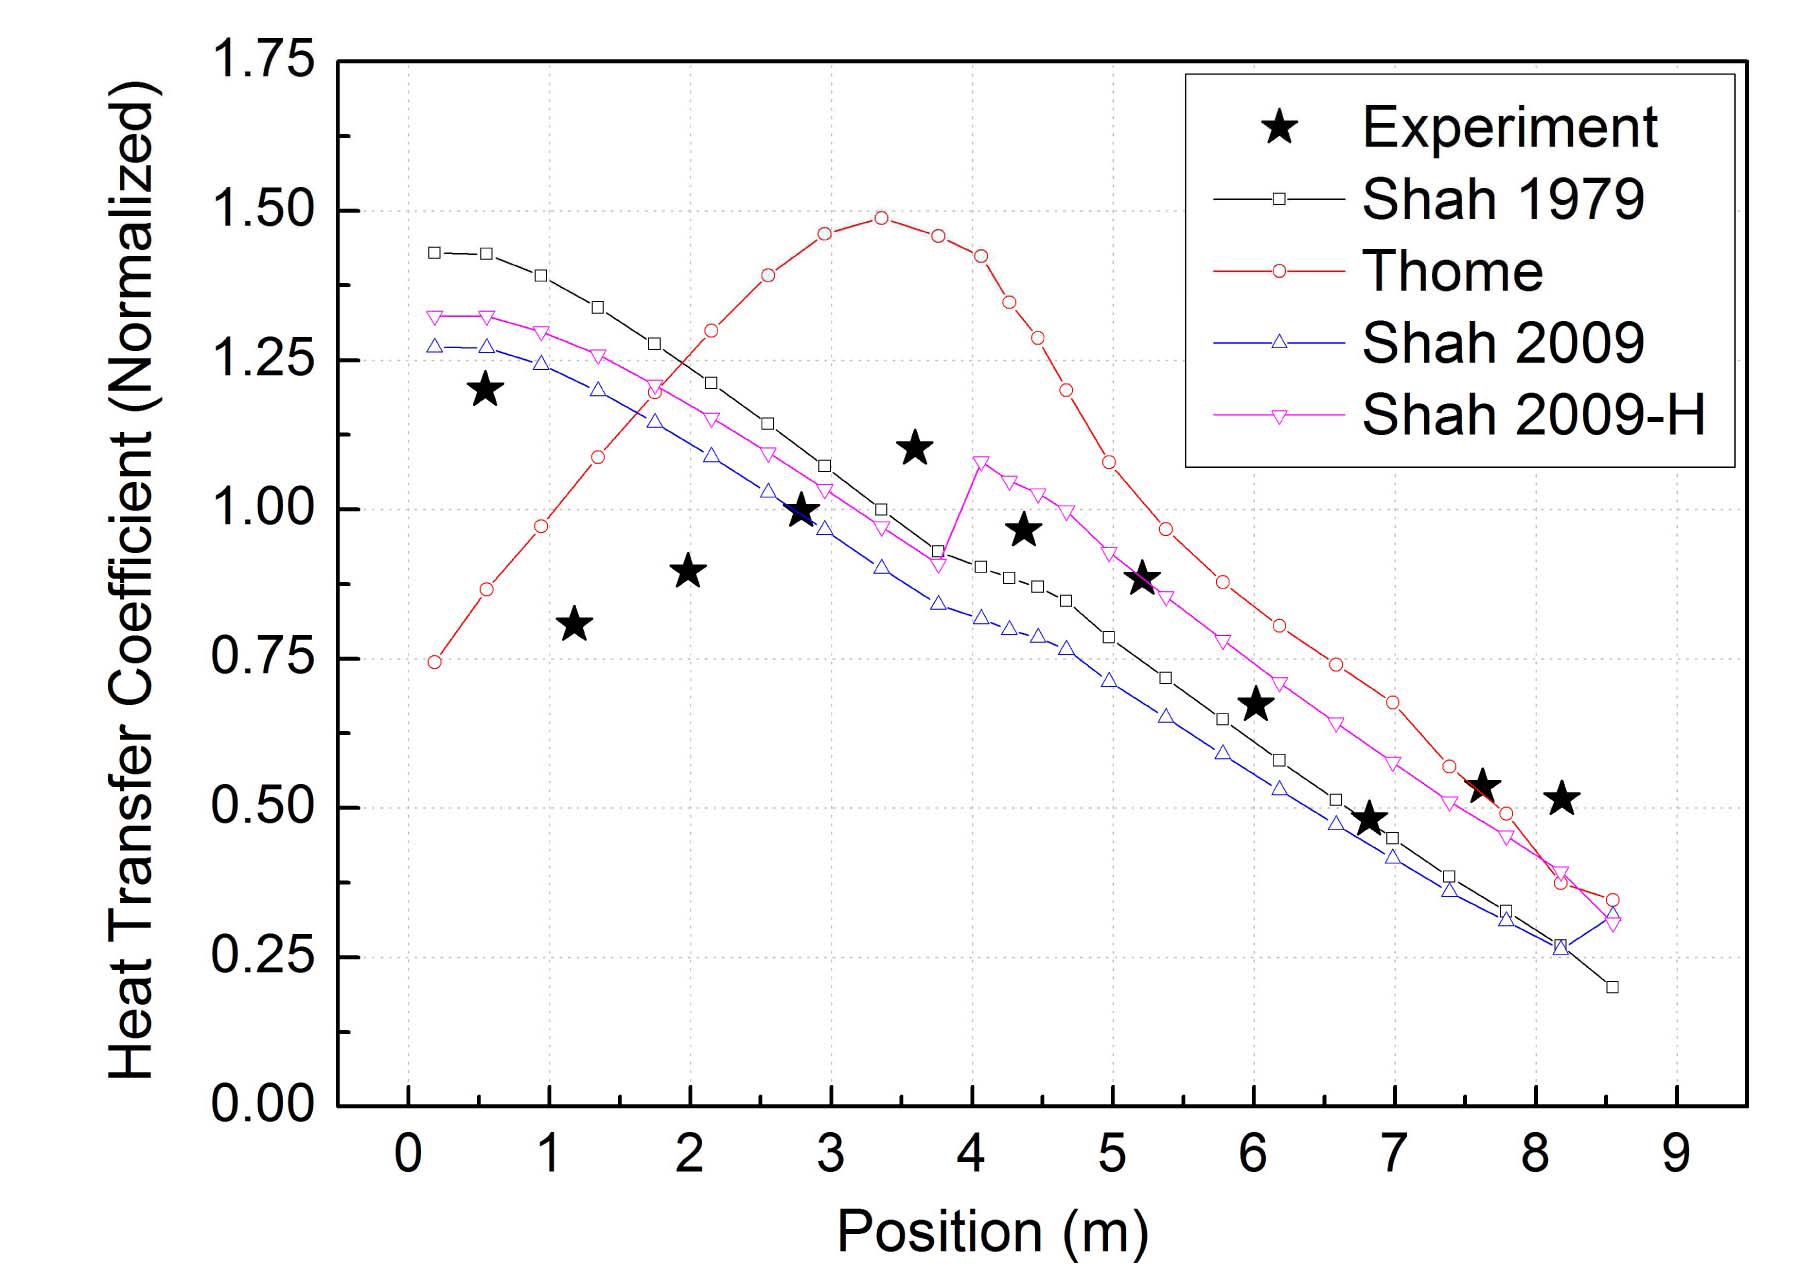
Fig. 8 shows the condensation heat transfer coefficient at the inside wall of the condensate tube. Steady state values are compared along the tube length. As shown in Fig. 8, the condensation heat transfer coefficients show a different profile according to the correlation. The heat transfer coefficients calculated by Shah’s original correlation and modified correlation show a continuous decrease along the tube length. Because the Shah models use Shah parameter defined by Eq. (6), the heat transfer coefficient decreases with the decrease of static quality in the cell. In the case of using modified Shah model for horizontal tubes, the heat transfer coefficient is sharply jumped at the middle ofnsate tube due to the transition of the regime.
However, the Thome model considers a convective condensation term as shown in Eq. (8), so that the heat transfer coefficient locally increases when the liquid velocity increases due to the geometrical effect. The fact that the position of local increase is similar to the place where the elevation change is larger than other cells can support this explanation. Even though the Thome model shows a better prediction of the system pressure and the profile of heat transfer coefficient is more proper than the calculation result with Shah’s original and modified correlations, there is still some discrepancy between the test data and calculation result.
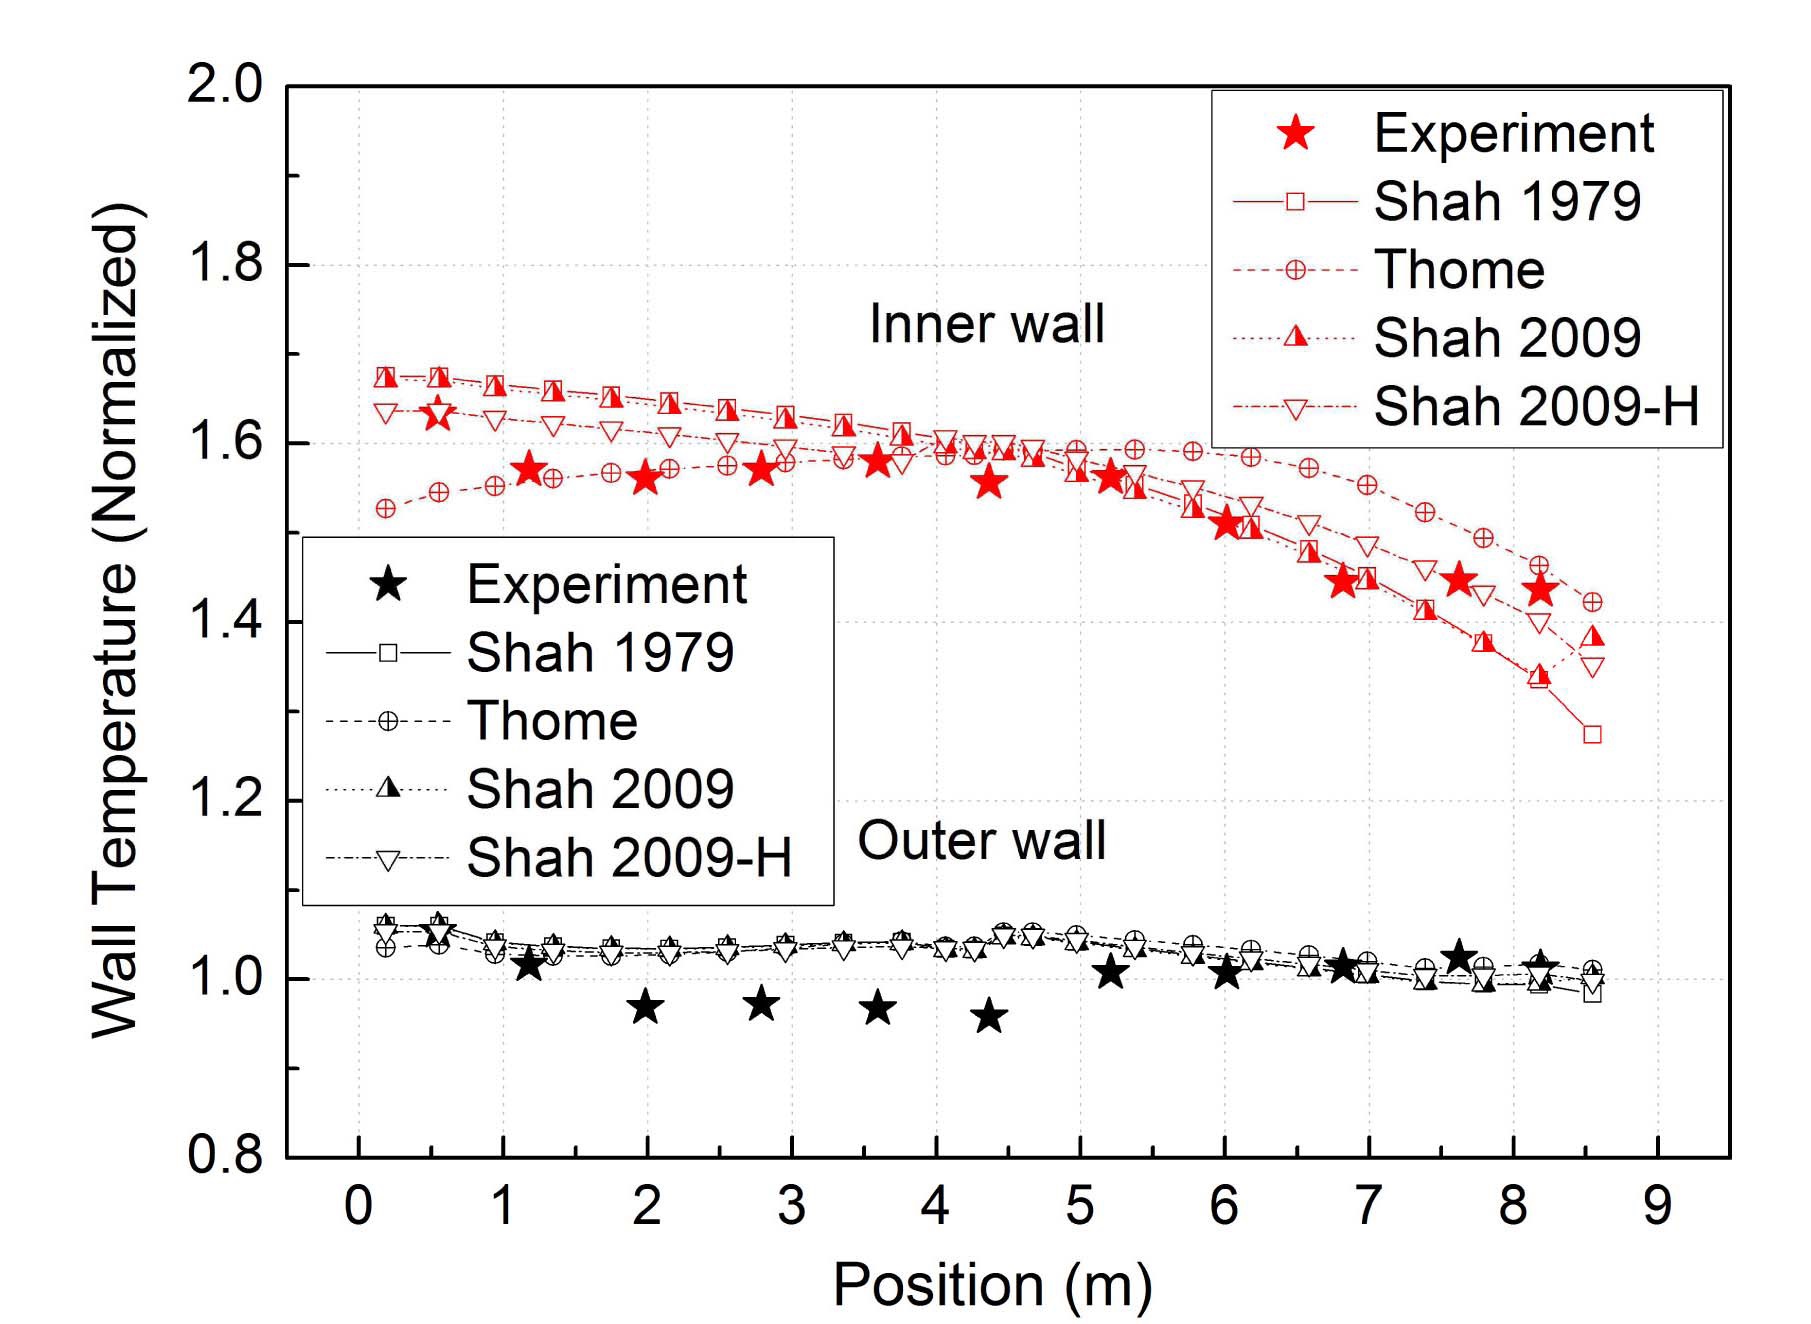
Wall temperatures of the PCHX tube show a similar trend to the heat transfer coefficient as shown in Fig. 9. The calculation result using the Thome model generally overestimates the wall temperature, but the trend is different from the calculation result using the Shah models. The calculation results with the original and modified Shah models show a continuous decrease, but the result with the Thome model shows a maximum temperature at the middle of the tube.
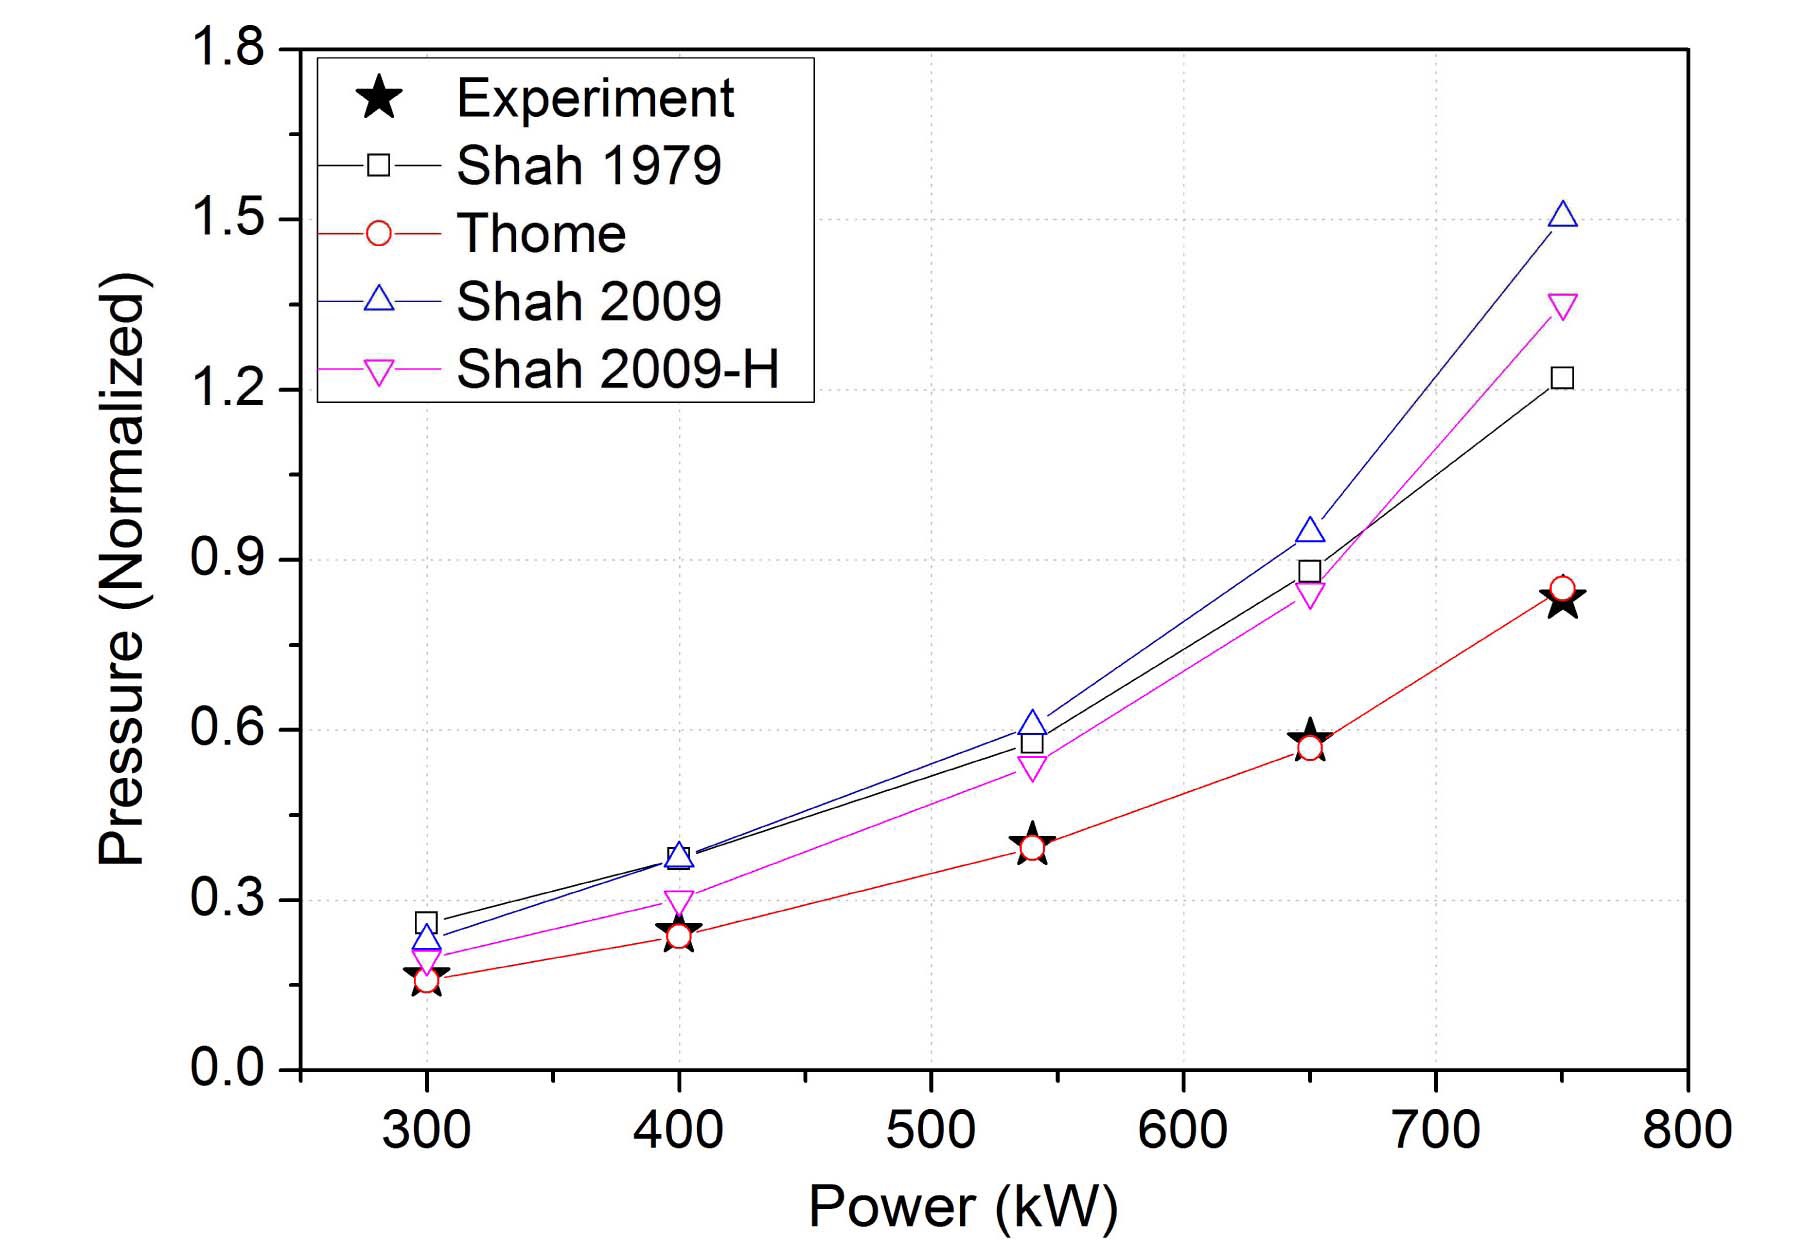
5.2 Summary of Quasi-steady State Calculation
Because general trends of the condensation heat transfer coefficient, the wall temperatures and heat flux transferred to the PCCT are similar for all test cases, calculation results are summarized in terms of system pressure as shown in Fig. 10. As shown in the figure, the calculation result using the Thome model predicts the system pressure well. The Shah models, including the original model developed in 1979 and the modified model for inclined and horizontal tubes developed in 2009, consistently overestimate the system pressure. Among the three Shah models, the modified model for horizontal tubes shows the lowest pressure and the largest condensation heat transfer coefficient.
In order to evaluate the heat removal capability of the PAFS, it is essential to properly predict the condensation heat transfer in the PCHX. Because the MARS code overestimates the system pressure when the calculation results are compared with the PASCAL test data, three models of condensation heat transfer were tested by implementing them into the MARS code. The modified Shah model underpredicted the condensation heat transfer coefficient while the Thome model reasonably predicted the average of the condensation heat transfer coefficient. Considerable difference between the Shah and Thome models is that the Thome correlation is more sensitive to the liquid velocity and convective condensation heat transfer, which can be varied due to the local geometric effect. This result means that the condensation model should consider the characteristics of the PCHX tube in the PAFS, including geometric effects, to properly simulate the condensation heat transfer. In particular, 3 degree of inclination, two large header and elbows at the inlet and outlet of PCHX, and U-bend are the possible sources of local variation of condensation heat transfer. In conclusion, the Thome model is a proper option to simulate overall heat removal behavior of the PAFS. However, it is required to develop a new condensation model or to improve the Thome model to properly capture the trend of condensation heat transfer coefficient according to the tube length.
Δ