In many practical applications, where data become available in small series from time to time, the problem, known as “catastrophic forgetting”, requires data to be learned incrementally without losing classification performance on old data. Traditional classification algorithms do not allow incremental learning. When new data become available, these algorithms are reinitialized and retrained using a combination of old and new data. The problem becomes unsolvable, if old data are not available any more. Under such condition, it is necessary to update an existing classifier in an incremental way to accommodate new data without forgetting previously acquired knowledge.
There are several approaches for incremental learning. One of them is using recently developed ensemble-based algorithms that make creative use of bootstrap based ideas. First, this approach involves generating an ensemble of classifiers for each dataset that becomes available. The result is an ensemble of ensembles of classifiers. And then classifiers are compounded to a final classifier.
One of the main characteristics of ensemble is diversity among classifiers. It is obvious because combining same classifiers doesn’t lead performance improvement. Diversity among classifiers can be achieved by adapting the classifiers to the training data distribution to create different training data subsets. This procedure guarantees that classifiers focus on more informative instances.
There are several algorithms to compound classifiers. In the simple majority voting, a commonly used combination rule, each classifier votes for the class it predicts, and the class receiving the largest number of votes is the ensemble decision. In the weighted majority voting, each classifier has a voting weight inversely proportional to its classification error. The winner is a class with the largest total vote. Also, algebraic combination of the class values can be used, so that the winner is a class receiving the highest combined vote [1]. All these algorithms consider just one class as a result of classifier, while the classifier can give class distribution as a result. For example, the leaf of decision tree, in case of weak classifier, can contain events from all classes. Losses of information are unavoidable, when the winner class is chosen. An alternative approach is to consider the class distribution.
A new probabilistic majority voting, based on probabilistic output expression, is presented in this paper, in the incremental learning.
Effectiveness of the extended data expression was shown previously [2,3]. In this paper, a new application of extended data expression in combining the outputs of weak classifiers is shown to be effective.
The rest of the paper is organized as follows. First, an extended data expression is described. Second, UChoo, a decision tree classifier using the entropy measures as same as the ones used in C4.5, but with the extended data expression, is described. Next, a new incremental learning algorithm, founded on probabilistic majority voting, is proposed. Finally, experimental results are provided to show the performance of the new algorithm in comparison with Learn++ incremental learning algorithm.
Learn++ is an incremental learning algorithm that was introduced by Polikar et al. [4-6]. It is based on the AdaBoost, which uses multiple classifiers to allow the system to learn incrementally. The algorithm works on the concept of using many classifiers that are weak learners to give a good overall classification. The weak learners are trained on a separate subset of the training data and then the classifiers are compounded using a weighted majority voting. The weights for the weighted majority voting are calculated using the performance of the classifiers on the entire training data set.
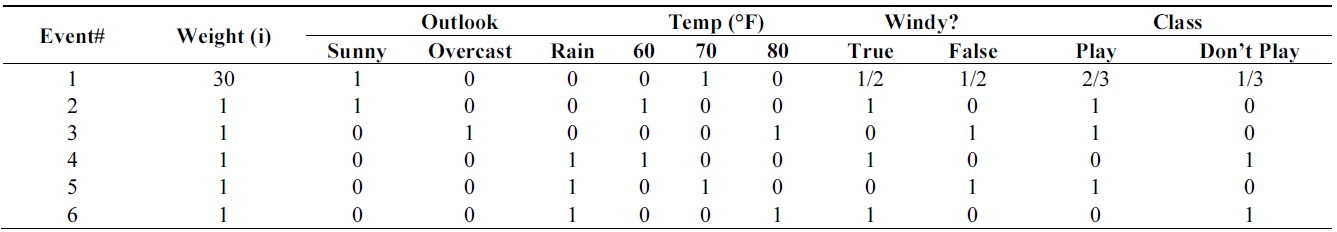
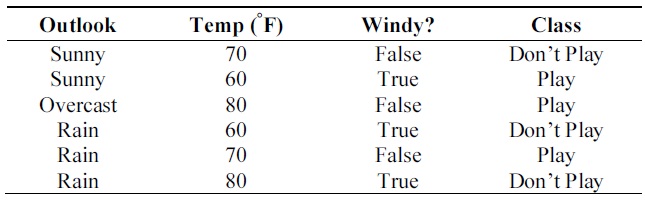
First, consider a simple example of data in common expression. Table 1 consists of training data, where each datum is described by three attributes, two of which are discrete, while the 3rd is a continuous attribute, and a class. The “Outlook” attribute has three outcomes of ‘sunny’, ‘overcast’ and ‘rain’. “Windy?” has two outcomes of ‘True’ and ‘False’. Both “Outlook” and “Windy?” are discrete attributes and “Temperature” is a continuous attribute whose values range from 60 to 80. Finally, class has two outcomes of ‘Play’ and ‘Don't Play’.
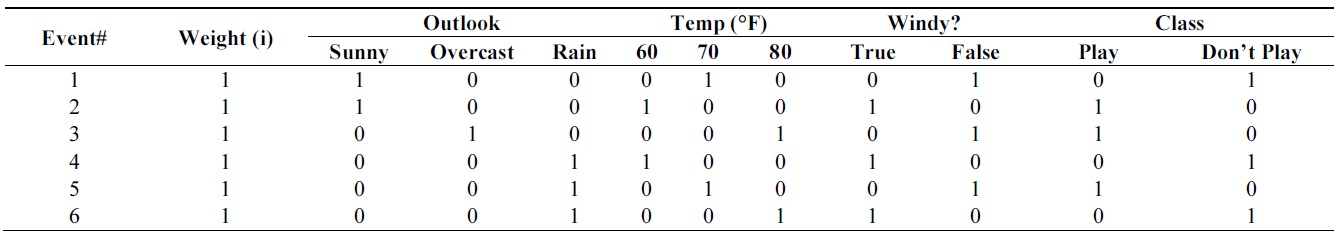
Table 2 shows the modified expression [2] of the training data set of Table 1. There are two main features of extended expression. First, each attribute has distribution over the possible values, i.e. each attribute entry is to be filled with a probabilistic value ranging from 0 to 1. Second, each event has a weight value, which shows how much importance the event has. In this example, all the data are assumed to have the equal weight of one.
Data can be described by an expert in the field. For example, an expert says that it is ‘sunny’ and the temperature is around 70 and the probability to play is 2/3 regardless of whether windy or not.
In addition, the expert can say that the data or ‘rule’ he describes has the importance of having the weight of 30 compared to the individual datum in the data set. UChoo can then express the case as the event #1 shown on the first row of the Table 3.
Since each event has a weight, an instance has been redefined as the event with a weight value of 1 in Table 3. In other words, each attribute can have distribution over the possible class values in an instance. And each row of Table 3 has a weight value, which shows how much importance the event has. For example, if each observed instance is assumed to have the importance weight of 1, the expert can now be able to describe his idea or rule’s importance with the weight value so that it can be compared with an observed instance. The event at the first row of the above Table 3 has the weight value of 30. In other words, the event has the importance equivalent to that of 30 instances.
An event is a collection of instances with equal attribute value distribution and class value distribution.
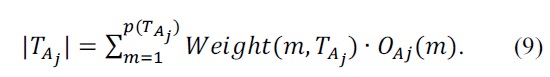
An instance can be regarded as an instance having the weight of 1. Therefore, the number of events may not be equal to that of all the instances. For example, in Table 3, the number of all the instances is 35 while the number of the events is 6. The number of all the instances in a data set T is denoted as |T| in this paper while the number of the events is denoted as p.
Training data set
[Table 2.] Extended data expression
Extended data expression
[Table 3.] Extended data expression with the expert knowledge

Extended data expression with the expert knowledge
UChoo algorithm utilized this extended data expression to make the classifiers from incomplete, missing or varying dimensional data as in [2,3].
UChoo algorithm uses the measure entropy similar to that of C4.5 [7], but it not only can generate classifiers from the observed data set as in C4.5, but also from the combination of the observed data with the rules or data from the expert described in the form of the extended data set expression.
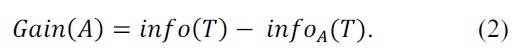
The entropy measure equation of C4.5 is as follows:

where
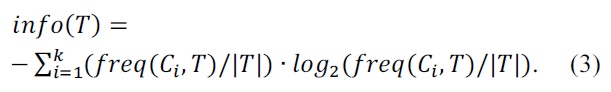
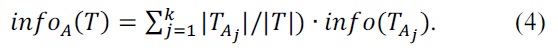

where
New equations for extended data expression are defined as follows.
Class membership weight
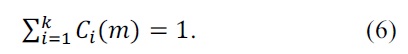
Outcome membership weight
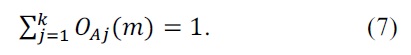

where
In this case, multiplying
V. INCREMENTAL LEARNING ALGORITHM BASED ON NEW PROBABILISTIC MAJORITY VOTING
Ensemble-based algorithms create collection of weak classifiers and compound them to strong classifier. Such algorithms use weighted majority voting, based on the performance of the classifiers. In this case, a weak cla-ssifier gives out a hypothesis and decides one class for each training event.
Consider a situation for a decision tree: a leaf contains 100 events and 45 of them belong to class 1, the other 55 events belong to class 2. So, hypothesis assigns this leaf to class 2 as class 2 has more popularity in the leaf.
Probabilistic expression is more natural. For the previous example, weak classifier gives class distribution as hypo-thesis: 0.45 for class 1, 0.55 for class 2. This class distribution can be used to compound hypotheses.
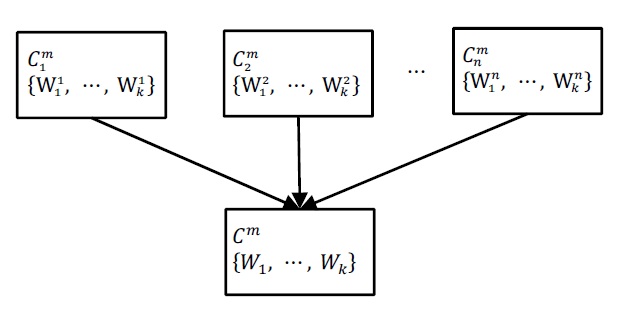
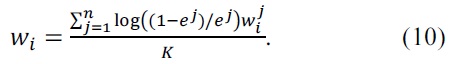
Consider the example in Fig. 1. Here, n is the number of classifiers,
is class distribution of

is compound hypothesis of
and the weights in the compound distribution can be calculated as follows using the error of the
Probabilistic expression is easily realized by using UChoo classifier and extended data expression. Weights of events in extended data expression can be used to define class distribution as a result of classifier. UChoo is the classifier based on such data expression and the class distribution in a leaf can be expressed as follows:
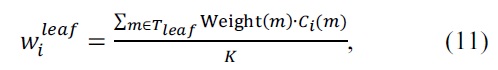
where
Define here the training data
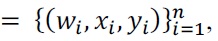
where
UChoo classifier with pruning parameter is used as WeakLearn. Pruning parameter controls the weakness of a classifier. Pruning parameter controls the ratio of the majority class instances to the total instances in the leaf. Pruning 40% means, that each leaf consists of 60% of one class. Class distribution in each leaf is determined by the formula described above.
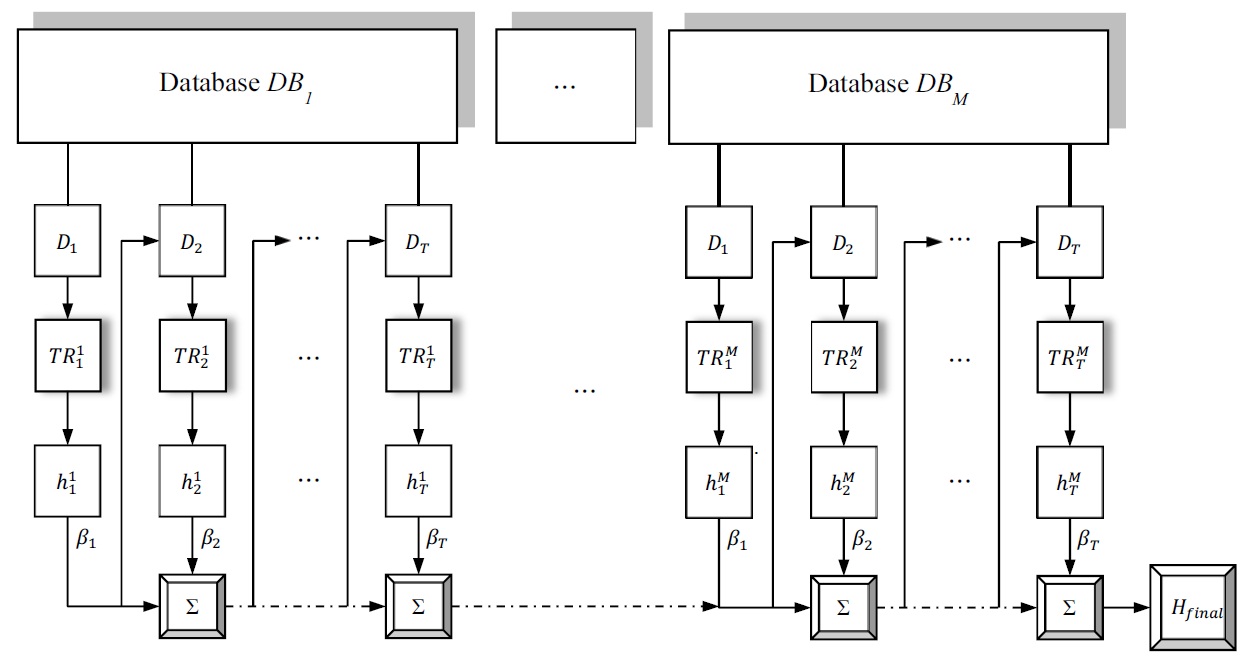
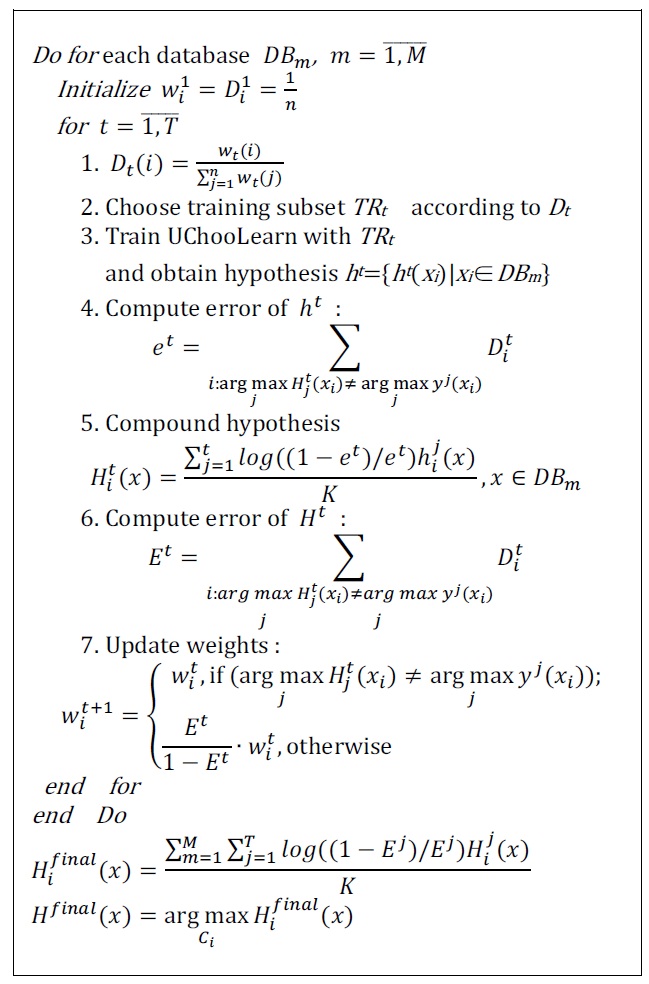
The block diagram of the incremental learning is in Fig. 2, and the algorithm is described in Fig. 3.
At first, for available database, the distribution is initi-alized as uniform, and all the events have equal probability to be chosen into training subset
Weights are changed by using performance of com-pounded classifier applying AdaBoost rule [8], so that the weights of misclassified events are increased relative to the correctly classified training events. In AdaBoost weights are changed according to performance of the hypothesis, which is result of current weak classifier. Here the performance of the compounded hypothesis is used to update weights, so the ability of resulting hypothesis is improved after each iteration. Also, resampling with replacement is used to obtain training subset
To show the power of proposed probabilistic result expression, new incremental algorithm, explained in this section, is compared with Learn++ with UChoo classifier used as weak classifier. Learn++ algorithm has the same plan, but uses deterministic weight majority voting.
Since we use the same scheme as Learn++, error bound is defined in the same way. At first, consider a two-class problem, where there are only class 0 and class 1. In this
case hypothesis
Error bound of compound hypothesis
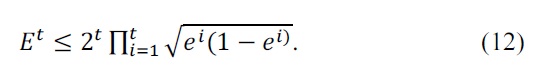
The final hypothesis is
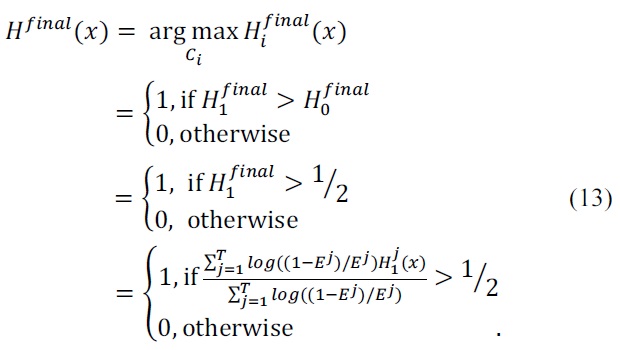
It is the same as the one in [6], and therefore the error bound is
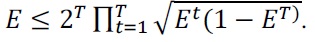
In case of more than 2 classes, multiclass problem can be reduced to two-class problem with same error bound as it is shown in [8].
Notice that we define upper-bound of error, which says that probabilistic majority is not worse than the deter-ministic one. In [9], authors show that summing the out-comes of the real-valued neural networks and then selecting the best prediction performs better than selecting the best prediction of each network and then combining them with a majority rule. The experiments in the next section are carried out in the same way.
Algorithms are tested on data sets collected in UCI Machine Repository [10]: Glass (214 events), Balance Scale (625 events), Vehicle (846 events) and Pendigits (10992 events). The data sets do not contain any missing value or unknown value. Detailed descriptions and performance on each data set are explained in the following.
As the goal of the experiments is to show the advantages of new probabilistic majority voting, the algorithm is compared with Learn++. Experiments are made under equal conditions for both algorithms: UChoo classifier is used as WeakLearner, the same number of hypotheses is generated and the training set and the testing set are the same for each experiment.
At first, each data set is randomly divided into two subsets. First (80%) is used to train the classifier and second (20%) to test the algorithms. To show the incremental effect, training data set is divided into 3 data bases and organized in the way that the previously seen data are not used in the next stages of learning. Exception is made for Glass data. Training data set in this case is not divided into 3 data bases, because the number of events is small.
For each database 12 weak hypotheses are generated. Weakness of hypotheses varies with pruning parameter between 0% and 40%. Number of weak hypotheses is set to 12. All the experiments show that the error just slightly varies depending on the number of hypotheses in the range from 10 to 20. More than 20 hypotheses make the system work very slowly.
Data set consists of 214 events. 172 events are used for training and the remaining events are used for testing. Each event consists of 10 attributes, with 6 classes.
Table 4 shows the performance of algorithms on test data using different pruning parameters. Performance of proba-bilistic incremental algorithm is quite better than that of Learn++ with Uchoo as the base classfier for all tests. Also note that the error is slight less for weak learners when pruning parameter varies from 25 to 40%.
It means strong classifiers tend to lead to overfitting and slight diversity among classifiers. Experiments show an advantage of probabilistic majority voting over weight majority voting.
[Table 4.] Error on glass data
Error on glass data
Data set consists of 846 events. Among them, 677 events are used for training and the remaining events are used for testing. Data event is described by 18 attributes from which one of 4 classes is determined.
Table 5 shows performance of the algorithms on test data using different pruning parameters. We can observe better performance of probabilistic incremental algorithm com-pared to that of Learn++, but errors are similar for all values of pruning parameters.
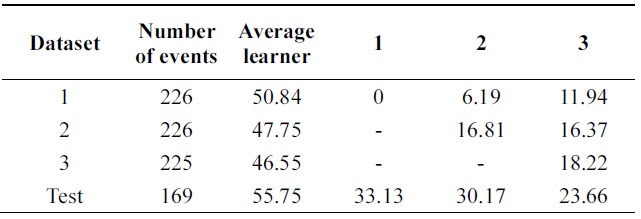
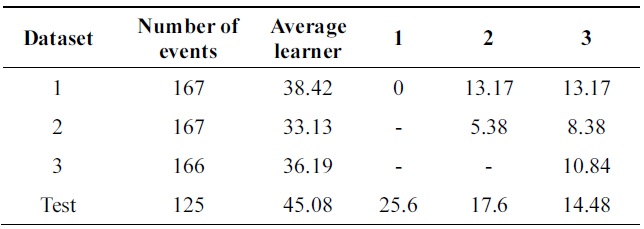
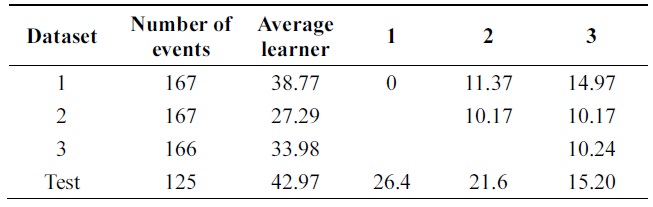
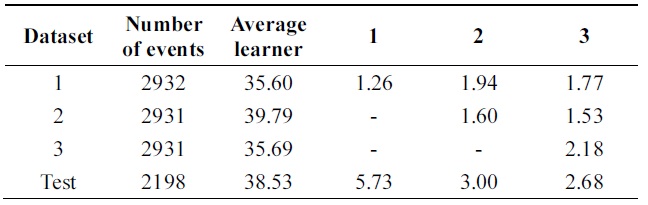
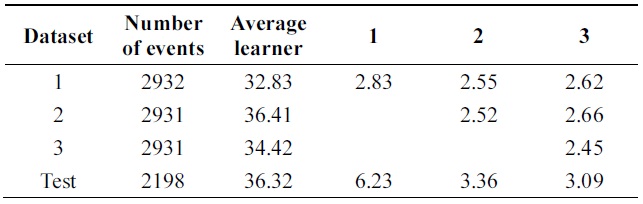
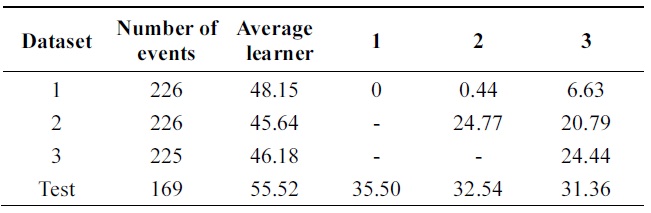
In Tables 6 and 7, incremental ability of the two al-gorithms is compared. Third column shows average error of weak classifiers learned on each data base. 4th, 5th, and 6th columns show the performance of the classifier at each incremental step on all databases.
[Table 5.] Error on vehicle data
Error on vehicle data
[Table 6.] Error of probabilistic incremental learning on vehicle data (pruning 30%)

Error of probabilistic incremental learning on vehicle data (pruning 30%)
[Table 7.] Error of Learn++ on vehicle data (pruning 30%)
Error of Learn++ on vehicle data (pruning 30%)
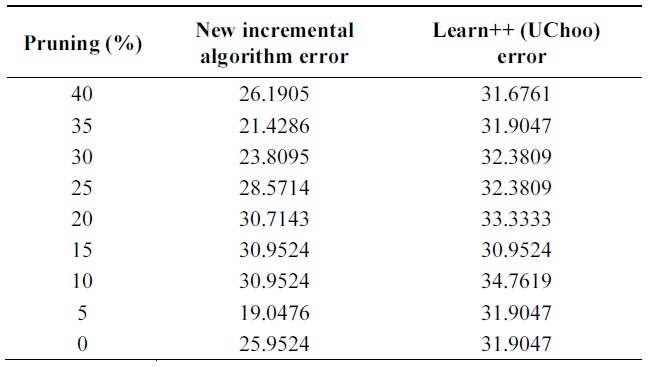
[Table 8.] Error on balance-scale data
Error on balance-scale data
[Table 9.] Error of probabilistic incremental learning on balance-scale data (pruning 30%)

Error of probabilistic incremental learning on balance-scale data (pruning 30%)
[Table 10.] Error of Learn++ on balance-scale data (pruning 30%)

Error of Learn++ on balance-scale data (pruning 30%)
Performance is increasing incrementally from one data base to another. The new algorithm gives 10% of impro-vement while Learn++ gets 4++ on testing data at the final incremental step.
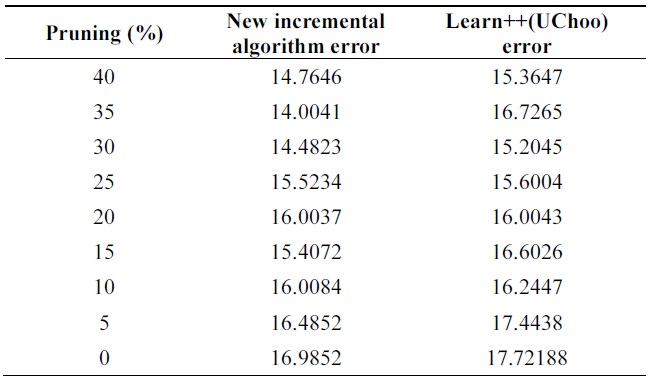
Balance Scale Weight & Distance data set, obtained from UCI repository, is generated to model psychological ex-perimental results. The dataset consists of 625 events and has 5 attributes; 500 events are used for training and 125 events for testing.
Table 8 compares errors of the new algorithm and Learn++ for pruning parameter in the range of [0,40]. A better performance of the new algorithm is observed. Both algorithms show the advantage of combining weak clas-sifiers to make a better compound classifier. In Tables 9 and 10, 11% performance improvement is observed on testing data.
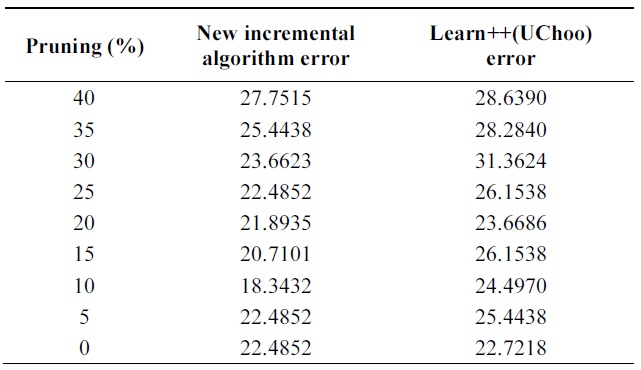
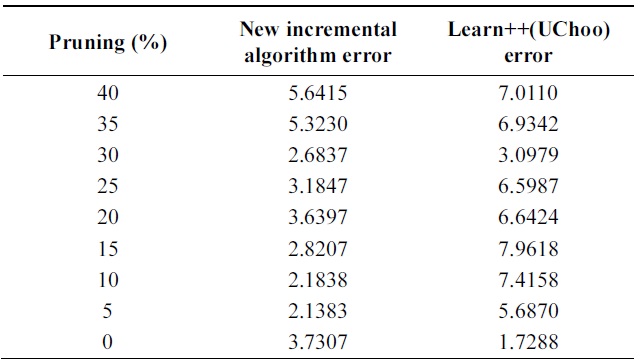
Data set consists of 10992 events. 8794 events are used for training and remaining 2198 events are used for testing. Data set consists of 16 attributes which describe handwritten numerical characters from 0 to 9.
Table 11 shows performance of algorithms on test data using different parameters. Error of new boosting algorithm is less than that of Learn++.
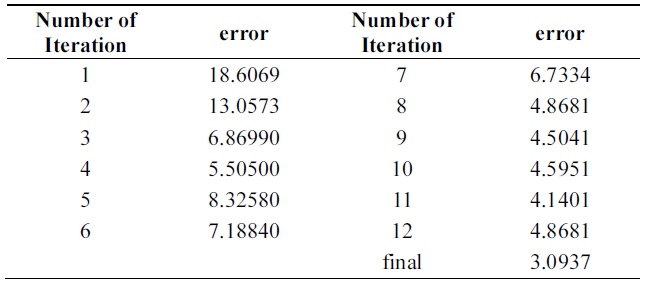
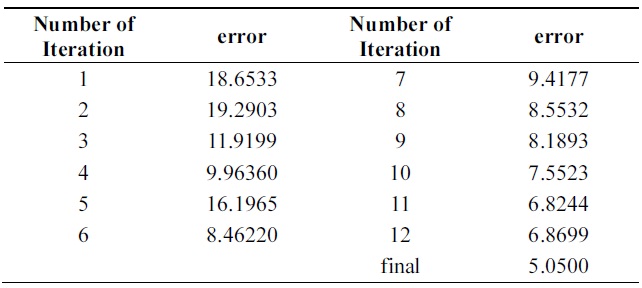
Tables 12 and 13 show a 3% performance improvement in incremental ability. Errors of compound classifiers are shown in Table 14. Errors are decreasing through iteration. This demonstrates that algorithm is learning incrementally.
[Table 11.] Error on pendigits data
Error on pendigits data
[Table 12.] Error of probabilistic incremental learning on pendigits data (pruning 30%)

Error of probabilistic incremental learning on pendigits data (pruning 30%)
[Table 13.] Error of Learn++ on pendigits data (pruning 30%)

Error of Learn++ on pendigits data (pruning 30%)
[Table 14.] Error of new boosting algorithm through iterations on pendigits data

Error of new boosting algorithm through iterations on pendigits data
[Table 15.] Error of Learn++ through iterations on pendigits data
Error of Learn++ through iterations on pendigits data
Tables 14 and 15 show errors of both algorithms through iterations on the testing set of Pendigits data. The two algorithms have almost the same error on first iteration; final hypothesis of new algorithm has better performance.
All the results show advantage of probabilistic majority voting over weight majority voting.
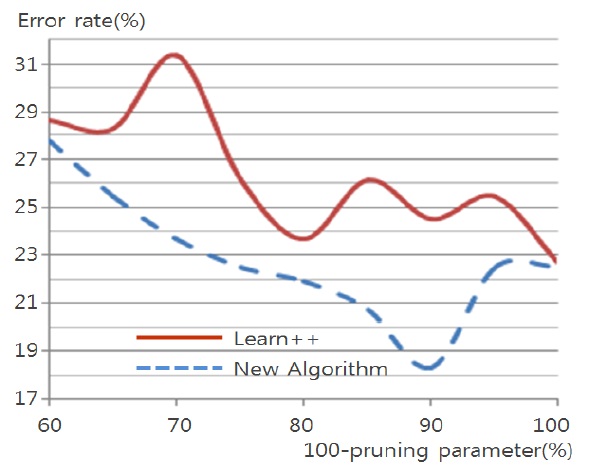
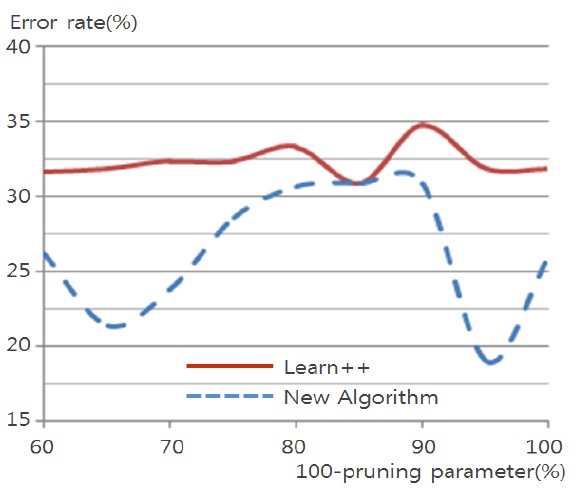
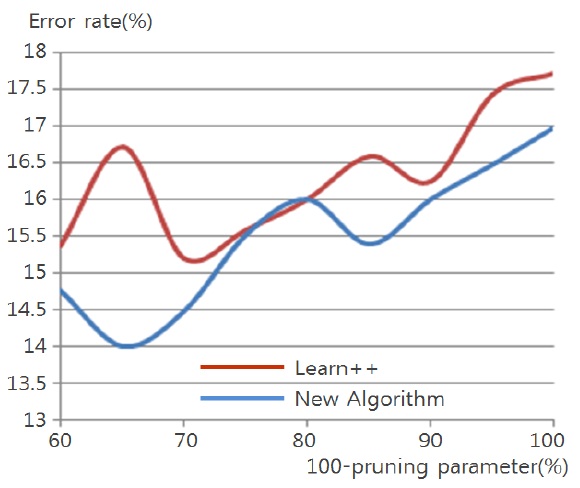
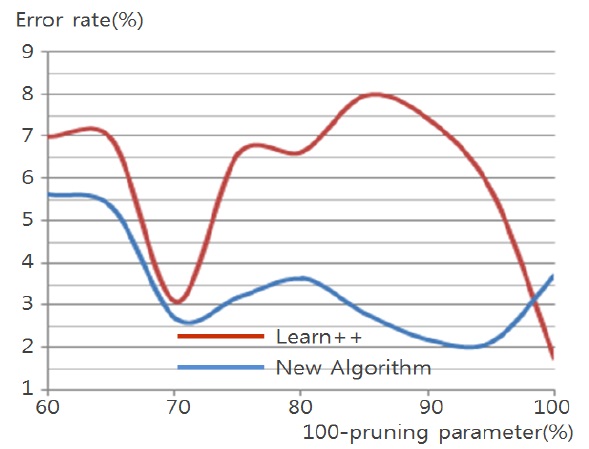
Figs. 4 through 7 compare the new proposed algorithm with Learn++ for different pruning parameters. The x coordinate of the figures is (100-pruning parameter (%)) in percentage. New algorithm shows better results in almost all the experiments for various pruning parameters. Also, in Tables 6, 9, and 12, the performance of the hypothesis is higher on the own training data set and performance on the test set is improving as the hypothesis trained on new data base is added. In the Pendigits data the improvement is only 3%, but for vehicle and balance data it is 10%.
In the Pendigits data case, however, the error rate is decreased from 6.23% to 3.09%, which is actually a signi-ficant performance improvement as the error rate is decr-eased more than 50%.
This paper presents a new incremental algorithm based on probabilistic result expression. Such expression prevents losses of information in weight majority voting. Results of experiments corroborate advantage of the probabilistic result expression over the deterministic expression.
Extended data expression and UChoo classifier are powerful techniques in classification and rule refinement problem. In this paper extended data expression is applied to obtain probabilistic results with probabilistic majority voting.
Proposed algorithm shows good performance that con-firms the usefulness of extended data expression and UChoo classifier in solving classification problems.
To be able to calculate the probabilistic majority voting, the number of instances in the leaf should be counted. Because UChoo divides the space recursively according to the entropy measure, the subspace in the leaf is captured naturally and the probability of a certain class is seen. For a classifier such as artificial neural network, it is not easy to define the subspace where the test data belongs, and hence the probabilistic majority voting is not done naturally. This fact signifies the advantage of the decision tree type classifiers as a basic building block of more complicated ensemble of classifiers