Epoxy resins have good mechanical and thermal properties, as well as excellent electrical properties; thus, they have been used as insulation materials in the field of heavy electric equipment, such as mold-type transformers, current transformers (CT), potential transformers (PT), metering out fit (MOF), gas switching gears, and so on [1-3]. In order to achieve these performances, many kinds of inorganic fillers, such as silica (SiO2) [4], alumina (Al2O3) [5], mica [6], aluminum nitride (AlN) [7], and titanium dioxide (TiO2) [8], have been incorporated into the epoxy resins.
When inorganic filler was incorporated into an epoxy resin, the viscosity became too high. So it was very difficult, not only to disperse the fillers homogeneously, and to remove bubbles from the epoxy/filler mixture, but also to inject the viscous mixture into a mold, during the curing process. Therefore, in order to decrease the viscosity, plasticizers, organic solvents or reactive diluents were introduced to the epoxy/filler composites, so that bubbles were easily removed from the composites, after injection into a mold. However, the plasticizers disturbed the cure reaction of the epoxy system, so that the crosslink density decreased. This caused a decrease of the electrical, mechanical and thermal properties of the epoxy system. When organic solvent is used, it should be removed completely after mixing the epoxy, inorganic fillers and organic solvent. If not, it may act as an impurity, so that the electrical, mechanical and thermal properties of the epoxy composite may be negatively affected. Reactive diluents were used, in order to decrease the viscosity during mixing, and they participated in the crosslink network, during the curing reaction.
Partial discharge in high voltage equipment occurs within the insulation, resulting in the formation of electrical trees, and the deterioration of the insulation [9,10]. The causes leading to the generation of partial discharges, and their effects, have been widely studied, in order to understand this phenomenon [9,11]. In this study, partial discharge resistance for the epoxy systems with three diluents was investigated in the rod-plane electrodes arrangement, and the effect of electric frequency on the partial discharge resistance was also studied.
A commercial DGEBA (diglycidyl ether of bisphenol A) type epoxy resin, trade name of YD 128 (Kukdo Chem. Co.), was used. The equivalent weight was 184~190, and the viscosity was 11,500~13,500 cps at 25℃. The curing agent was Me-THPA (3- or 4-methyl-1,2,3,6-tetrahydrophthalic anhydride), whose grade name was HN-2200 (Hitachi Chem. Co.). It is widely used in the field of electric insulation. An accelerator was BDMA (benzyl-dimethyl amine, Kukdo Chem. Co.). A reactive diluent employed as a flexibilizer was a polyglycol (PG), under the trade name of DY-040 (Ciba-Geigy Co.). Its molecular weight was about 7,000~10,000, and its viscosity was 60~90 cps at 25℃. Another reactive diluent as an aliphatic epoxy resin was purchased from Kukdo Chem. Co., under the trade name of BDGE. Its equivalent weight was 120~140, and its viscosity was 15~30 cps at 25℃.
2.2 Partial discharge resistance test
DGEBA (100 g), THPA (92 g) and reactive diluent (10 g) were well-mixed with a high-speed agitator at 5,000 rpm for 10 min, and BDMA (1 g) was mixed with the agitator for 3 min. The mixture was poured into a mold having a cavity of 100×100 mm2 with 1 mm thickness. Then, it was cured at 120℃ for 2 hr, and post-cured at 150℃ for 2 hr, and then cooled slowly at a rate of -0.5 ℃/min until room temperature, to avoid internal stress. The surfaces of specimens were then cleaned in distilled water by using an ultrasonicator, in order to remove any particles, because they resulted in surface flashover.
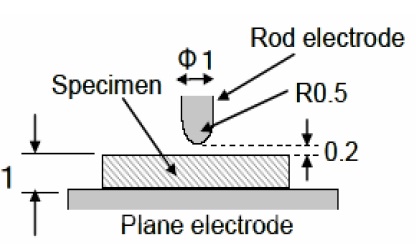
The partial discharge resistance was tested in a rod-plane electrode arrangement, as illustrated in Fig. 1. Rod-like tungsten electrode, whose diameter was 1 mm with the curvature radius of 0.5 mm, was configured with a gap of 0.2 mm from the upper side of the specimen of 1 mm thickness, and the lower plane tungsten electrode was adhered by a silver paste.
Alternating current (ac) of 5 kV, with three different frequencies of 60, 500 and 1,000 Hz, was applied to the specimen for 96 hr (4 days), using high voltage (HV), applied by ac Endurance Voltage Tester (Haefely, Germany).
The morphology image was captured by using a video microscopy system (ICS-305B, SOMETECH Inc.), and the surface roughness of the erosion samples was analyzed, by using a Dektak-8 surface profilometer (Veeco Instruments Inc.), in order to observe the erosion depth and area.
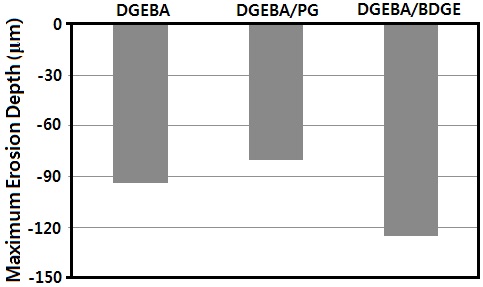
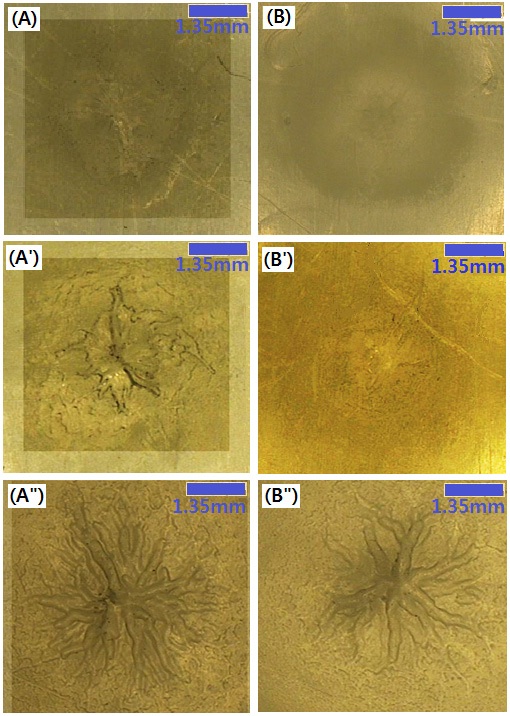
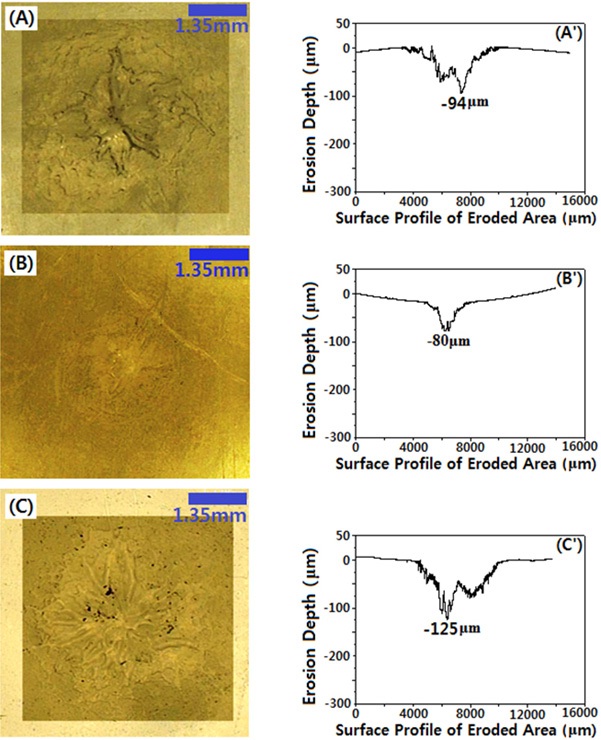
Figure 2 shows microscopic images of the eroded of the eroded surface of the specimens: (A) DGEBA,(B) DGEBA/PG, and (C) DGEBA/BDGE, after applying ac 5 kV with 500 Hz for 96 hr (4 days). Their surface profiles were also displayed, and the depth of the deepest eroded gorge was compared in Fig. 3. As was reported in the study performed by Tanaka et al. [12], light was emitted from the partial discharge, which was not dependent on the deterioration time. Partial discharge occurred at the end of the rod electrode in the initial state, and was maintained throughout the entire state. The specimen surface was degraded, and changed its color to black at the end of the rod-like electrode, after the application of high voltage for 96 hr (4 days). This was due to the epoxy resin chain being degraded and vaporized from the surface, because the chain was oxidized, due to the discharge
in the air.
The erosion morphology in the DGEBA system showed severe uneven erosion, with the diameter of 4,200 μm, at the surface of the sample around the rod-like electrode. The maximum erosion depth was -94 μm. As PG as a flexibilizer was introduced to the DGEBA system, i.e in the DGEBA/PG system, the erosion morphology was somewhat even, and the diameter was 1,300 μm, with the maximum erosion depth of -80 μm. This meant that PG had a good effect on the partial discharge resistance of the DGEBA system; moreover, it was used as a diluent. As BDGE as a chain extender was introduced to the DGEBA system, i.e in the DGEBA/BDGE system, the erosion morphology was more uneven, than that of the DGEBA system. The diameter of the erosion circle was about 4,400 μm, with the maximum erosion depth of -125 μm, which was 33% deeper than that of the DGEBA
system. This meant that the BDGE had a bad effect on the partial discharge resistance of the DGEBA system. This was because the BDGE had aliphatic structure, which was a weak chain to the electrical strength; while DGEBA had aromatic structure, which had good electrical strength.
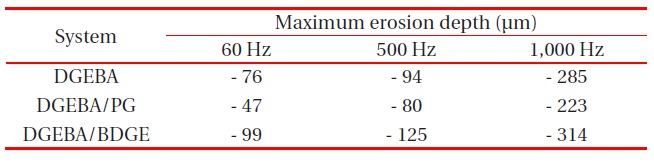
The effect of electric frequency on the partial discharge resistance was studied, after applying ac 5 kV with 60, 500, and 1,000 Hz for 96 hr (4 days). The systems were (A) DGEBA, and (B) DGEBA/PG; and the prime was for 60 Hz, double prime was 500 Hz, and triple prime was 1,000 Hz. The eroded surface of the specimen was observed by optical microscope, and its image shown in Fig. 4. Its surface profile was also analyzed by using a surface profilometer, and the maximum erosion depth was

Maximum erosion depth for the three systems, after applying ac 5 kV with 60, 500 and 1,000 Hz, for 96 hr (4 days).
measured, and is listed in Table 1. As the electric frequency increased, the erosion morphology became severely uneven, and the eroded diameter became broad, regardless of the system. In the DGEBA system, the maximum erosion depth at 60 Hz was -76 μm, and that at 1,000 Hz was -285 μm. In the DGEBA/PG system, the maximum erosion depth at 60 Hz was -47 μm, and that at 1,000 Hz was -223 μm. The erosion morphology was most uneven, and the eroded diameter was broadest in the DGEBA/BDGE system, regardless of the electric frequency; and the erosion morphology was most even, and the eroded diameter was smallest, in the DGEBA/PG system, in all electric frequencies. As explained in Fig. 2, PG had a good effect, while BDGE had a bad effect on the partial discharge resistance of the DGEBA system.
The effects of electric frequency on the partial discharge resistance for three epoxy systems were carried out, by applying 5 kV alternating current, in a rod-plane electrode arrangement. At 500 Hz, the DGEBA system showed severe uneven erosion morphology, with the maximum erosion depth of -94 μm; while the DGEBA/PG system had some even morphology, with the maximum erosion depth of -80 μm. The erosion morphology of the DGEBA/BDGE system was more uneven, and showed 33% deeper erosion, than those of the DGEBA system. These results meant that PG had a good effect on the partial discharge resistance of the DGEBA system, while the BDGE had a bad effect. Similar tendencies were found at 60, and 1,000 Hz.