Polymer composites are now being used to replace metal parts and electrical insulation in many applications, like power electronics, motors, transformers, and heat exchangers. Polymeric composites have advantages over metal due to their light weight, good corrosion resistance, and low-temperature processing. However, they have some limitations, such as the low thermal conductivity exhibited in all polymers. Hence, polymeric material is not good for many products like wire enamels, cables, heat sinks for electronics, circuit laminates, and other electrical insulations. There is a need to develop polymeric composites with good thermal conductivity. It is the thermal conductivity of polymers can be enhanced with the addition of thermally conductive fillers like carbon black, carbon fibers, ceramics, and metal particles [1-5].
Unsaturated polyester resin is used as an electrical insulator in electrical equipment and motor-wire enamels. Due to its poor thermal conductivity, it has very limited application in electrical insulation. Graphite is usually reported as the best conductive filler because of its good thermal conductivity, low cost, and fair dispersability in polymer matrix [6-9]. Surprisingly, the porous walls of carbon microtubes (CMTs) exhibit a highly ordered lamellar structure, and the wall exhibits a layered graphite crystal structure. Therefore, the use of CMTs is more justified than graphite.
This study reports on the development of CMT-UPR composites and the effect of up to 50% CMT loading on the thermal diffusivity. High filler loadings (>20 vol.%) are typically necessary to achieve an appropriate level of thermal conductivity in thermally conductive polymer composites. Moreover, the high filler loading dramatically changes the mechanical and electrical behavior of the polymer. Hence, the mechanical and electrical properties of the CMT-UPR composites are also evaluated.
The unsaturated polyester resin used in the preparation of UPR-CMT composites was obtained from M/s Naphtha Resins, Bangalore, India, and was used as received. The resin was preaccelerated with 0.2% cobalt naphthanate (6% Co content), and had a solid content of 55%. Styrene was used as the reactive diluent. The acid value of the composition was 14 mg KOH/g resin, and the viscosity was 330 mPas (@ 25℃ and 50 rpm). The initiator used for the cure of the unsaturated polyester resin was methyl ethyl ketone peroxide (MEKP) obtained from M/s Naptha Resins, and was used as received. The carbon microtubes were obtained from Teijin, Japan. A carbon microtube comprises a hollow, tubular structure with a porous wall, and has a diameter ranging from about 10 μm to about 150 μm, with a density of less than 20 mg/cm3.
The UPR-CMT-composites were prepared by adding varyingamounts (0 to 50 phr by weight) of hollow micro carbon tubes to the unsaturated polyester resin under mechanical agitation. The CMTs were added on a parts per hundred basis (phr). 1 phr would indicate that 1 g of the CMTs was added per 100 g of resin. The mixture was then subjected to ultrasonication coupled with mechanical agitation. Following the dispersion of the CMTs in the polymer matrix, the dispersion was degassed, and the required amount of initiator was added and stirred. The composition was then poured into Teflon and metal molds and allowed to cure at room temperature 25 ± 1℃ for 12 hours, followed by post-curing at 80 ± 1℃ for four hours. The composites were then allowed to stabilize for 7 days at 25 ± 1℃ and 50% relative humidity before any testing was carried out.
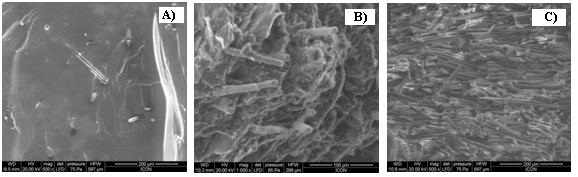
The dispersion of CMTs in the UPR matrix was analyzed by scanning electron microscope and is depicted in Fig. 1.
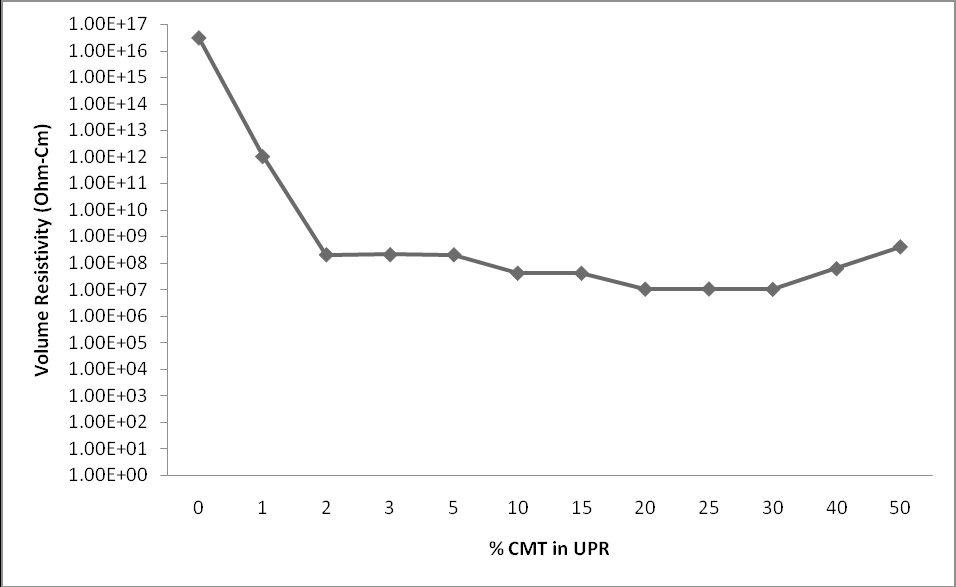
3.1 Surface and volume resistivity
The surface and volume resistivity of the UPR-CMT composites were measured using an electrometer (model 6517, Keithley) according to ASTM D 257-2007. The samples used for evaluation of the surface and volume resistivity had dimensions of 100 × 100 × 3 mm. The resistivity was measured at an applied voltage of 500 V DC, and the electrification time was 60 seconds.
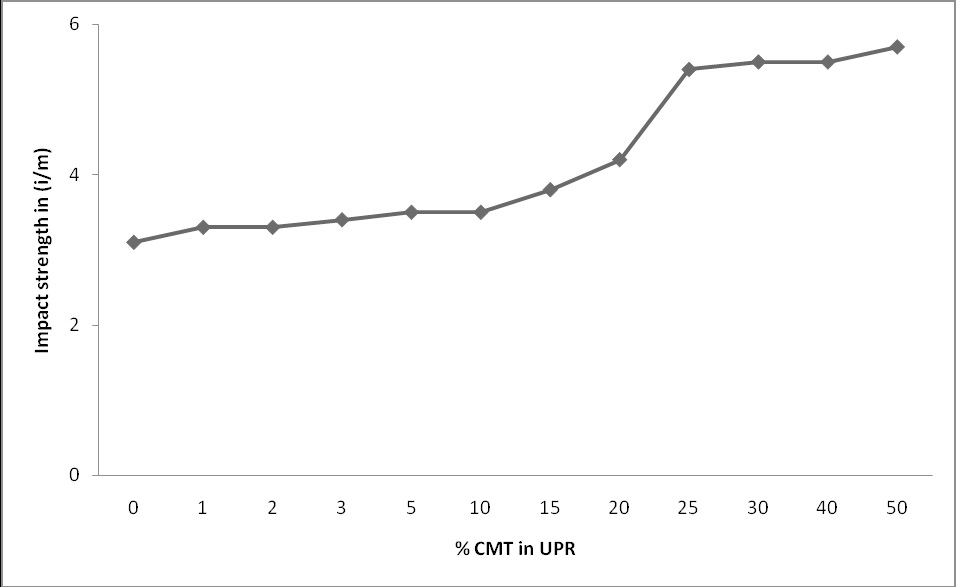
The mechanical properties of the UPR-CMT composites were evaluated using a Lloyd 50 Universal Testing Machine with a 50 kN load cell in the case of tensile properties and a 500 N cell for the flexural properties, with a jaw speed of 2 mm/min and a gauge length of 5 cm. The samples used for evaluation of the mechanical properties had dimensions of 100 × 10 × 5 mm. The impact strength of the samples was evaluated on a Denson Avery Impact tester with a 2.7 J striker with a striking velocity of 3.46 m/s in accordance with ASTM D256.
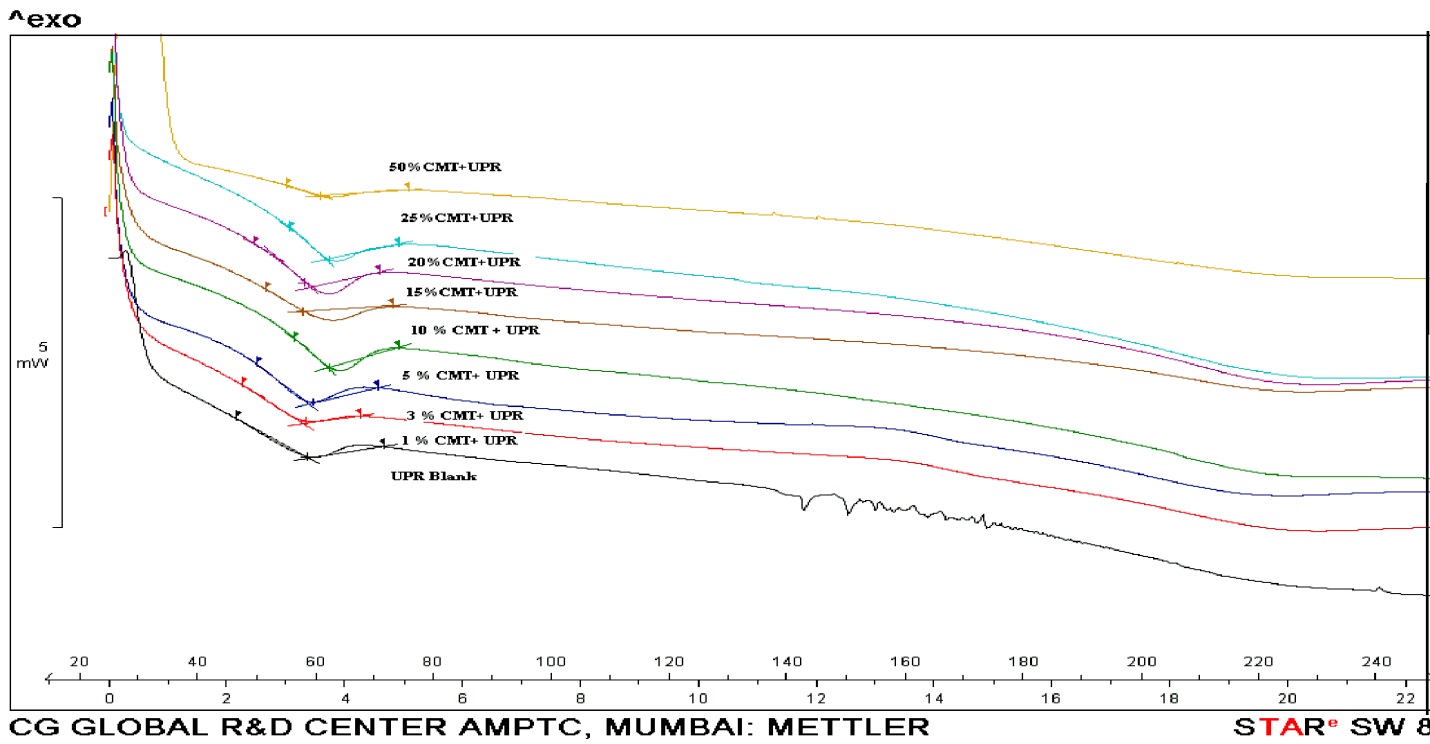
The glass transition temperature of the UPR-CMT composites was evaluated on a Mettler Toledo DSC822e machine with a sample weight of 12~20 mg and a heating rate of 10℃/min in a nitrogen atmosphere. The sample was cycled from 25~250℃ and 250~25℃. The glass transition was evaluated from the second run to eliminate the thermal history from the sample.
The thermal degradation analysis (TGA) of the silica-UPR
composites was done using a Mettler Toledo TGA/DSC-1 machine in a nitrogen atmosphere with a flow rate of 30 ml/min, a sample weight of 15~20 mg, and a heating rate of 10℃/min. The sample was heated from 25~500℃.
3.4 Thermal conductivity measurement
The thermal conductivity and diffusivity of the UPR-CMT composites were measured by laser flash method (LFA 447, Nano flasch, Germany) using samples with 12.5 mm diameter and 3.0 mm thickness. A xenon flash lamp with 150 nm to 2,000 nm wavelength and a pulse energy of 105/pulse and sensor is InSb detector with integral Dewar for cooling. All testing was carried out at temperatures of 25, 35, 45 and 55℃ with four shots.
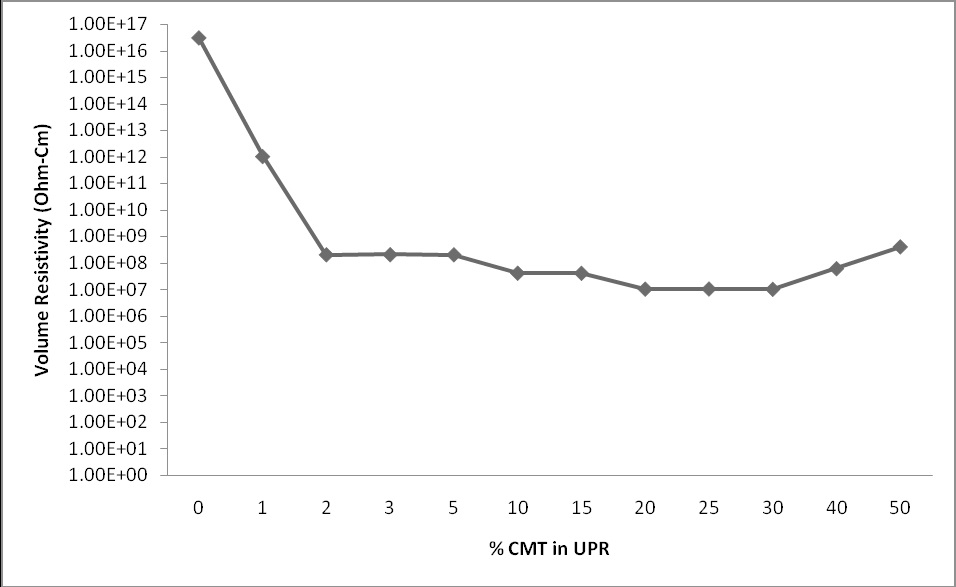
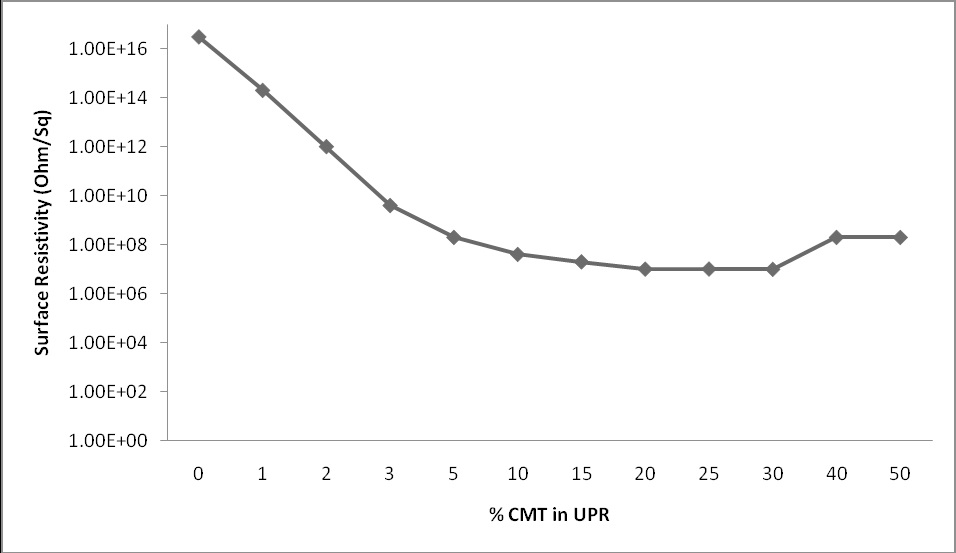
4.1 Surface and volume resistivity
The surface and volume resistivity of the UPR-CMT composites were measured according to the method described, and the results are presented in Figs. 2 and 3. It is clear from Fig. 2 that the surface resistivity of the UPR-CMT composites decreased after the addition of up to 10% CMTs, and was measured as 1.0 × 10⁸ Ohm/sq. The volume resistivity also decreases with increasing CMT concentration up to 2%, and is then constant at all higher concentrations. A drop in surface and volume resistivity was observed due to the lower resistivity of the CMTs compared to UPR, and was constant after percolation was achieved. Further increases in the concentration of CMTs do not affect the surface resistivity.
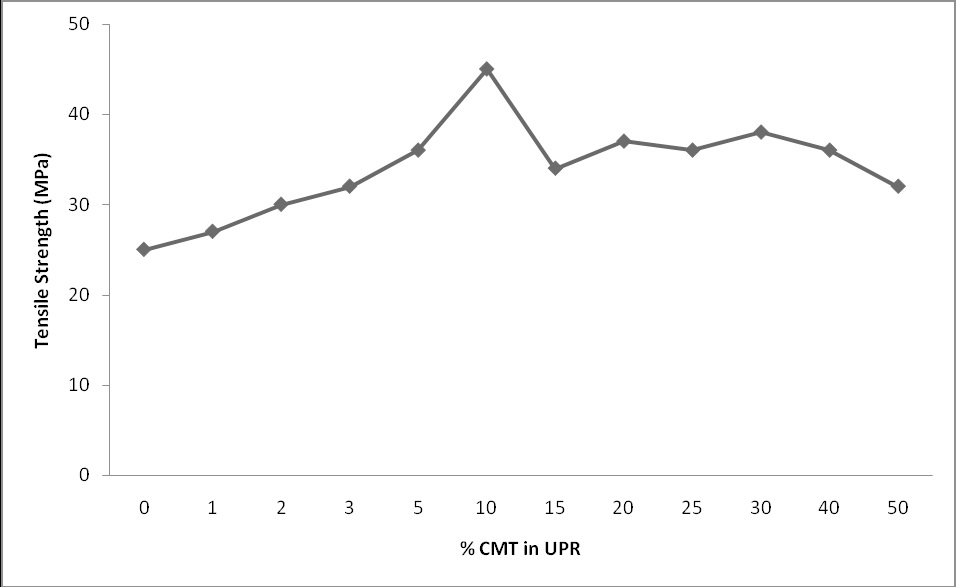
The mechanical properties of the UPR-CMT composites were determined to evaluate their behavior with respect to filler concentration. The tensile strength of the UPR-CMT composites was determined and the results are depicted in Fig. 4. It is clear from the figure that the tensile strength increases with the addition of CMTs to the UPR, and is highest at 10%. The strength decreases at up to 20%, and is then constant at 25 to 50% CMT concentration. This behavior was found because initially, the CMTs provide reinforcement to the polymer matrix at up to 10%, and with further increases in the concentration of CMTs, there is no interaction of the CMTs with the UPR.
The impact strength of the composites was evaluated, and the results are shown in Fig. 5. It is known that the addition of micro filler to a polymer increases the impact resistance of the resultant composites. The impact strength of the CMT-UPR composites is higher than that of the neat UPR. The strength was slightly improved at 1~15% CMT concentration, and then increased at 25%, and was constant after further addition of CMTs. Up to 15% concentration of CMTs, less stress is transferred to the filler as a
result of the less force dissipation to the filler. Once the concentration increases to more than 15%, more stress is transferred to the CMTs, which results in higher force dissipation and leads to a higher impact.
The thermal properties of polymeric composites are another important factor when choosing a particular polymer for a particular application. Figure 6 shows the effect of the addition of CMTs on the glass transition temperature of the resultant composites. The glass transition temperature is dependent on the molecular mobility of the polymer chains in the network. Greater mobility of the chains results in lower glass transition temperature.
It has been previously observed that the inclusion of micro fillers has resulted in both decreases and increases in the glass transition temperature, depending on the nature of the filler and polymer, and processing techniques and coupling agent. There have been a number of theories proposed to explain the increase of the glass transition temperature, based on the degree of interaction between the polymer and the filler surface. It is clear from Fig. 6 that a small increase in Tg was observed after the addition of CMTs (1~50% concentration) to the UPR matrix, which may have been due to the lower mobility of polymeric chains in the composites.
4.4 Thermal conductivity measurement
The heat transfer in carbon microtubes may be correlated to a photon-conduction mechanism. This study aims at trying to understand the thermal conduction mechanism involved in CMTUPR composites. The thermal conductivity at room temperature is represented by the following relation:
K = DρCp
where D is the thermal diffusivity (mm2/s),
the thermal conductivity has been measured by means of error theory as follows:
△K = DρCp + D△ρCp + Dρ△Cp
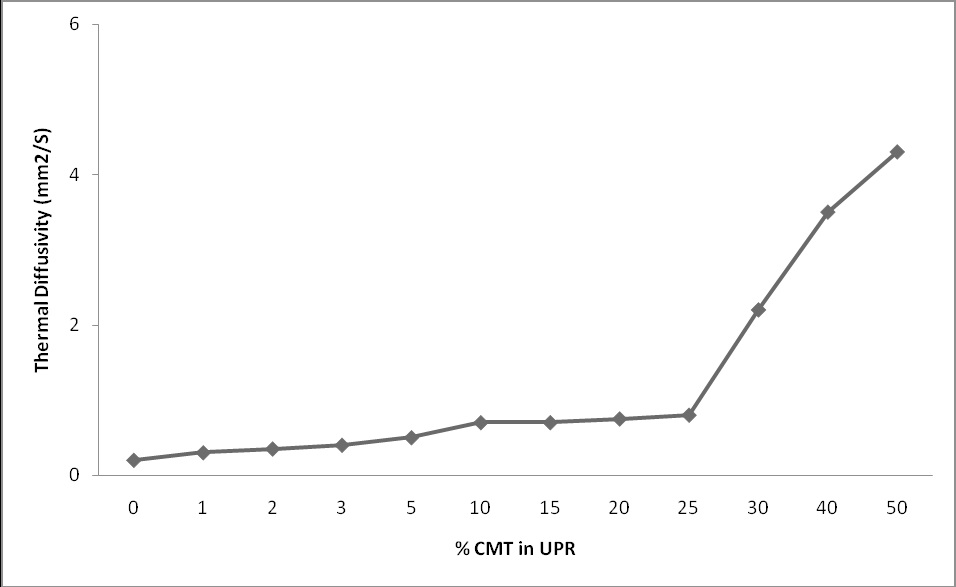
The thermal diffusivity and the density of the CMT-UPR composites were measured. The thermal diffusivity values of the composites as a function of carbon microtube concentration are represented in Fig. 7. As expected from the large thermal diffusivity of the CMTs compared with that of neat UPR, an increasing general trend in the thermal diffusivity with the addition of CMTs is observed.
Initially, the change in thermal diffusivity is small for concentration up to 10 wt% CMT, and a rapid increase in D is achieved until 50 wt%. This behavior may be due to the existence of a UPR-CMT interfacial thermal resistance, as shown in Fig. 7. Further addition of CMTs results in a linear increase in the thermal diffusivity, reaching an increase of 4.0 for 50 wt% composites. This increase may be due to the formation of a more extensive conductive network [9].
The thermal diffusivity of CMT-UPR composites increased up to 4.056 W/m K at 50 wt% loading of CMT filler from a minimum value of about 0.210 W/m K at 1 wt% filler. At higher CMT filler loading, the mechanical properties increased up to 80% in the tensile strength and 66% in the impact strength. The surface and volume resistivity reached minimum values of 107 Ohm/sq and 108 Ohm-cm at 50 wt%, from maximum values of 1017 Ohm/sq and 1015 Ohm-cm for neat UPR. Hence, the composites moved from the non-conduction range to the antistatic range. The thermal behavior of the CMT-UPR composites were determined by differential scanning calorimeter (DCS) and thermal gravimetric analysis (TGA). The glass transition temperature and thermal stability of the composites increase with the CMT concentration.