The transport of moisture in case of drying of CT’s with a porcelain cover. The diffusion is by two different processes
(a) Sorbed vapor transport (internally)
(b) Surface diffusion by surface jumps (externally on paper surface)
The sorbed vapor transport unlike capillary condensed flow is not dependent on the contact angle. Generally, in case of capillary condensed flow the flow gradient is due to changes in contact angle causing very large pressure gradients within the capillary. These gradients subsequently cause flow of moisture in the capillaries. In our case, since the moisture inside paper is transported in the form of vapor, surface tension effects are not very significant. The pore sizes in our paper system are too big for moisture to condense inside capillaries. The value of pore sizes required for condensation has been reported in the previous report.
The sorbed vapor transport follows the Knudsen mechanism. Hence, the transport is due to the generation of random voids inside the paper due to the mobility of cellulose in paper. Once the moisture rises to the surface, then the transport is through surface jumps. The rate of jumps on the surface is a strong function
of the spreading pressure. The lower the spreading pressure, the higher the independence but the velocity of transport decreases. Now, in our case it is preferable to have a lower spreading pressure. The reason being the distance between two subsequent paper layers is very minimal, there is aluminum foil which restricts radial mobility, and at the same time it provides a counteracting force. Simply stated we would like a state where the water molecules coming out are just suspended in a vacuum without any pressure driving gradient. If such a situation exists then surface transport would be possible and the flux on the surface will be a function of concentration on the surface, the drag resistance, and initial kinetic energy [1].
The surface transport mechanism is very much like the motion of a projectile (As shown in Fig. 1). The only difference is that the drag force in this case is a function of interaction between water molecules (hydrogen bonding). Hydrogen bonding would be decreased greatly in the vapor phase. The drag force is the resistance to motion of a molecule due to frictional forces exerted by the medium but in this case there is no medium existing and hence what matters is actually the initial velocity of the molecules [2-4]. The initial velocity of the molecules is dependent on the vapor pressure and the temperature of operation. In this case our temperature of operation is around 120 degrees, which is not very high. The crux is the vapor pressure. The two possible cases would be a vapor pressure higher than the surrounding pressure or else the vapor pressure lesser than the surrounding pressure. The vapor pressure is different from the surrounding pressure since if an energy balance is applied it would be observed that a lot of the applied pressure energy is converted to kinetic energy within the capillaries of paper [5,6]. This is due to the increased resistance to motion in the capillaries which causes this conversion. A capillary is like impedance which causes a conversion of potential to kinetic energy. The vapor pressure is generally lower than the surrounding pressure at any given time, at the point of efflux. Hence, there is always a radial pressure gradient. This radial pressure gradient would cause the vapor molecules to actually collide with the aluminum foil. The reaction generated by the aluminum foil would actually make the molecules go back inside the paper capillaries [6]. The imparted velocity is more than what is required for the molecules to remain at the surface. There are two explanations to justify. The pressure gradient driven motion of the vapor molecules is accelerating in nature since there is no resisting medium around (vacuum). Hence, the impact velocity and the effusion velocity are different. Since the impact is elastic, the same velocity more or less replicates in the reverse direction. This velocity being greater than effusion velocity would cause the vapor molecules to seep in beyond the paper surface. The net effect is that the overall path of diffusion is much longer and the diffusion times are much higher [7,8].
The perfect mode of operation should be where the external pressure or the vacuum level is not increased beyond the vapor pressure of the effusing gas out of the paper so that the water molecule smoothly moves along the surface outside. When the amount of moisture in the paper is very low then pressure reduction is required. The dynamic mobility of the chain is the same in a coarse or fine vacuum since mobility is temperature dependent and the temperature of operation is the same in both cases or varies by a maximum of 5 degrees (very less). With very low moisture content the transport resistance in the sorbed phase is increased tremendously since each vapor molecule has to go through a series of cellulose chains before it can travel via voids. Since temperature cannot be increased a reduction in pressure is required which imparts more potential energy to the molecules and it also helps in the creation of a continuous medium for flow. For example, imagine a single droplet of water falling across a paper surface and a thin film of water. Obviously, the throughput and mobility would be much higher with the film. In case when the moisture content is significantly low to generate a continuous film medium on the surface, higher volumes would be required which can be attained by operating at a lower pressure. To conclude, the moisture diffusion in case of this system comprises
* Capillary Diffusion and
* Surface Diffusion
The exact vacuum level of operation depends on which diffusion mechanism is controlling [6]. The resistance for surface diffusion is a function of ejection velocity of moisture and varies with the vacuum level; hence it is essential to operate at a vacuum level where the pressure differential balances the effusion velocity. This would ensure the shortest path and thus the least amount of time for drying.
2.1 Process cycle and simulation technique
The water collection rate and the drying process times are known. The process was modeled to predict the drying process times and the water collection rates. The predicted value was compared with the actual value and the model was validated. The effect of changes in the process cycle was further validated by the type of tests conducted on the CT’s. A statistical analysis of the observed test results was also performed. The aim of the statistical analysis was to determine the effect of changes in process parameters on tan delta and capacitance.
A 2-D process simulation was performed using a triangular meshing scheme [9,10]. The diffusion coefficient was estimated using the goal seek method where the mass transfer coefficient was continuously varied until the point where the actual experimental data points were replicated. The replication of the experimental data points was for the old process. The validation was done with a prediction made for the adopted new process. The assumption is that the mass transfer diffusion coefficients are a property of the paper-aluminum foil system. Hence, it would remain the same. The effect of the change in the processing technique would cause a change in the mass transfer fluxes along the CT’s. This change would cause a change in the overall observed mechanism of mass transport in the bulk phase. The starting mass transfer coefficient was that of moisture diffusion within the cellulose capillaries which has been determined experimentally at the lab scale and is available in the literature. The entire CT is assembled with the porcelain housing and then put into a vacuum oven for drying. Hence, the air comes in direct contact with the paper only through the gap between the porcelain housing and the paper. The direction of diffusion is only longitudinal in nature since there are aluminum foils in the radial direction and they are impermeable to moisture [11,12]
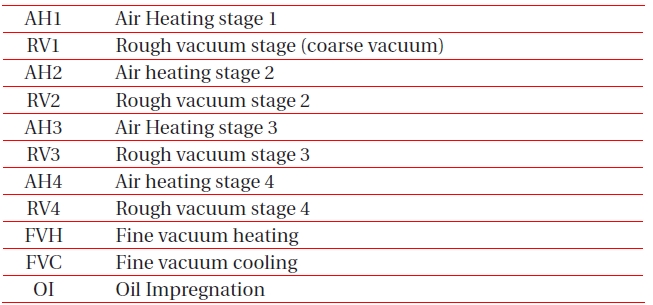
The processing flow chart for the CT is as follows.
The cycle runs through the following stage as shown in Fig. 2. The proposed new cycle had variations in the cycle times for each stage with a limiting condition that the dissipation factor should remain the same.
The dissipation factor of the CT’s processed by the new technique was measured. The new process involved the change in process parameters for the different stages involved. Therefore, testing was essential to ascertain that the jobs are completely dried by the new process too.
2.2.1 Tan delta and capacitance
The standard procedure for assessing the health of the insulation used in a CT is by measuring the tan delta. The tan delta value indicated the degree of polarization within the insulation since it is subjected to heating cycles. Pure cellulose has a tan delta of 0.18% and a paper insulation showing a tan delta below this value would indicate severe degradation. Generally, a tan delta value of up to 0.3% is acceptable commercially. The tan delta measurements are performed using the doble tan delta bridge.
2.2.2 Thermal Properties
The glass transition temperature of the composites was evaluated on a Mettler Toledo DSC822e machine with a sample weight of 10-20 mg and a heating rate of 10℃/min. The sample was cycled from 25-250℃ and 250-25℃ and same repeated. The glass transition was evaluated from the second run to eliminate thermal history from the sample. The test was conducted under a N2 flow of 10 ml/min. The thermo gravimetric analysis evaluated on a Mettler-Toledo TGA/DSC1 machine with a heating rate of 10℃ /min in a nitrogen atmosphere was maintained at flow rate of 20 ml/min. For each test 10-20 mg of the sample was taken and the test was carried out in a 50 ml alumina crucible. The sample was cycled from 25-150℃.
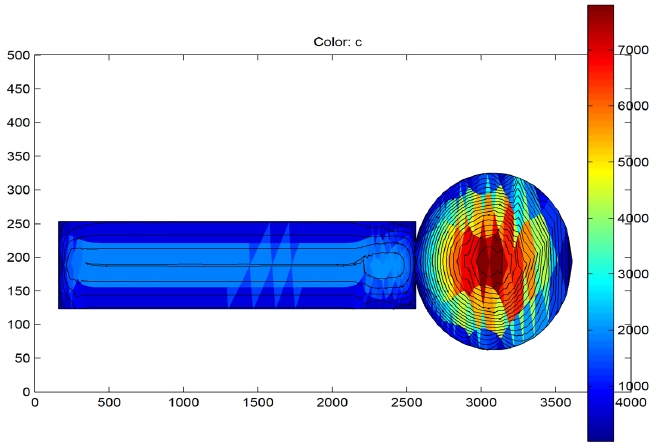
3.1 Mass transfer flux patterns
The mass transfer flux profile along the CT is shown in Fig. 3. The simulation patterns across the gut and the bushing regions are different. In the gut region it can be seen that the mass transfer flux is highest near to the centre of the gut. This observed result makes sense since the gut of the CT is not covered with porcelain during drying hence radial and axial diffusion is possible increasing surface area of exposure and hence drying rate. The outer paper layers would become dry first hence the mass transport flux would be the lowest at the outside. The flux would be highest at the centre since the centre of the gut would be the last to dry. Hence, the highest flux (in red color) is at the centre. Also, the flux lines in the gut region are non-spherical in nature indi-
cating that the mass transfer is possible in radial direction as well in the gut region. This is due to the absence of aluminum foils in the gut region. In addition, unique flow patterns are observed in the bushing region. It can be seen that the mass transfer flux is longitudinal in nature. Furthermore, it can be seen from the profile that after a length of 2,300 mm along the bushing there is a perpetual non-terminating loop. This is a very interesting behavior observed from the simulation results.
The bushing section has an aluminum rod at the centre with insulation build up on the both sides. Since the thermal conductivity of the aluminum rod is much higher than that of the paper - aluminum composite insulation system, the aluminum rod heats up quickly [9,11,12]. Hence, the paper layers, which are very close to the aluminum rod, dry quickly. Now the secondary paper layers which are far away from the central aluminum rod do not dry that quickly as compared to the central layers or the layers of paper close to the aluminum rod. As a result, the moisture molecules are driven towards the layers close to the aluminum rod at the bottom since the concentration of moisture in the paper layers near the rod is less as compared to those far away from the rod. Now once the moisture molecule jumps inside to the dried region it again attempts to jump out. This creates a self terminating loop and the moisture in that region is never able to escape. The only way to breach this loop is to change the level of vacuum or to change the temperature of the system. Thus, a vacuum break is very essential to ensure that maximum moisture is removed.
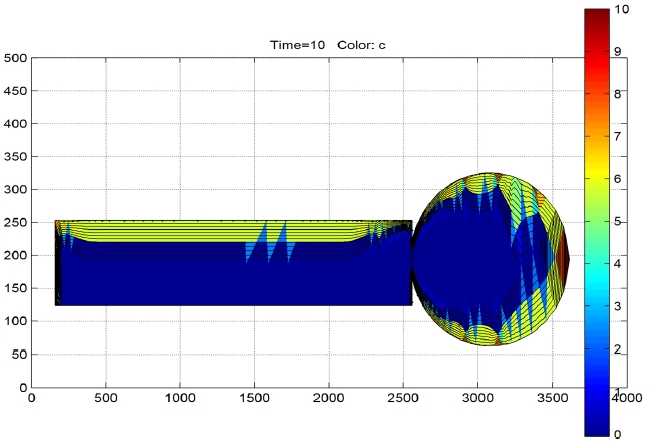
A dynamic simulation was performed with a time step of t
=4 hours as shown in Fig. 2. After 10 time steps or 40 hours it is observed that only the first 20 mm thickness of the insulation is dried along the bushing as shown in Fig. 4. Based on this result the time required for complete drying of the CT was predicted and compared with the current cycle times and they were found to be comparable. Hence, the suggested mechanism would suffice.
3.2 Air Heating Cycle optimization
The theory of flow across tube bundles used for designing heat exchangers was used to predict the airing velocities that would be required and the distance between the jobs that should be maintained to ensure that the jobs are heated up in the shortest possible times.
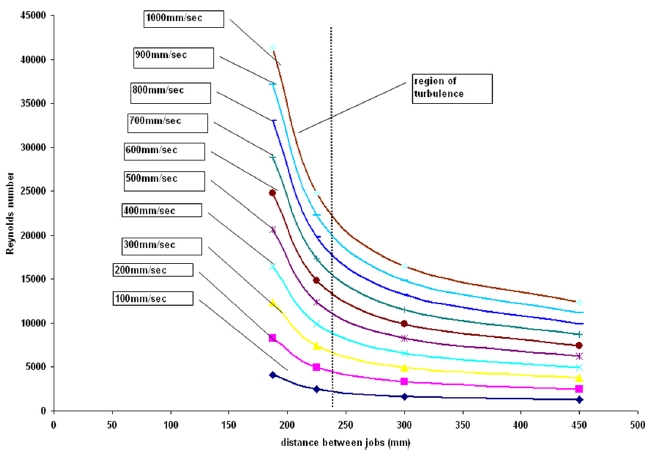
Figure 5 presents the effect of staggering on the Reynolds number inside the autoclave. The aim of this study was to determine the optimum distance between jobs that will result in a higher Reynolds number and generate turbulence. The simulation result shows that when the distance between subsequent jobs (linear) is less than 250 mm, the air velocities are in the turbulence regime. The inlet velocities of air are varied from 100mm/sec to 900 mm/sec. It can be seen from the figure that as the inlet velocity is raised or increases, the rise in Reynolds number becomes steeper which is justifiable since with a higher inlet velocity the attainment of turbulence would be quick and hence rise would be steeper. This result can be effectively used to determine the range of airing velocities to be used and the distance between the jobs to be maintained to attain turbulence and better heat transfer rates.
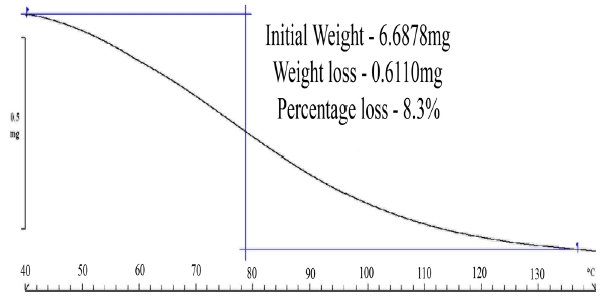
The TGA studies (Fig. 6) on paper samples saturated at 90%RH
revealed that the paper samples at a RH 90% can uptake a maximum of 8.3% of moisture by weight. Interestingly, the moisture removal process continues till the 130℃ mark indicating a probability of hydrogen bonding between water molecules raising the activation energy for removal of moisture from the paper samples [13].
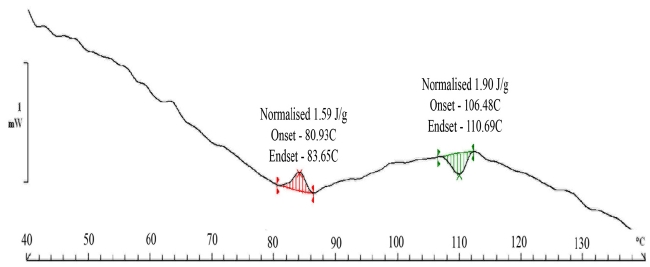
The DSC (Fig. 7) scans show an exotherm at the 60 to 70℃ range. This can be attributed to the molecular rearrangement that happens inside paper as moisture is removed from the system. The transport of sorbed water, which is our primary mechanism, is caused by the hydrogen bonding of water molecules with cellulose. The removal of the water molecule from the cellulose -water structure leads to a rearrangement of cellulose fibers which is an exothermic process since the cellulose fibers are now more organized. The process for the organization of fibers is normally exothermic. The organized state has a higher resistance to diffusion and it is evident from the fact that the rate of loss of moisture becomes very sluggish. The interesting thing is that the rearrangement takes place at around 90℃. Alternatively, it can be argued that the sluggishness can be associated with the reduction in moisture content of paper samples reducing the overall flux of mass transfer or in simple terms the diffusion rate. However, clearly, most of the moisture comes out at a lower temperature since it is surface adsorbed. The moisture which is chemically bound would definitely take more time to come out from the system. This moisture is much lower in quantity as indicated by the DSC scans. The equilibrium moisture content in the paper samples varies in the range of 8 -10%. The paper samples were subjected to a relative humidity of 90% for 24 hours. The activation or enthalpy for moisture removal is 1.90 J/gm. at a temperature of 100 degrees. This value is more than the value observed for cellulose in literature. The value reported for cellulose is 1.2 J/gm in this temperature range.
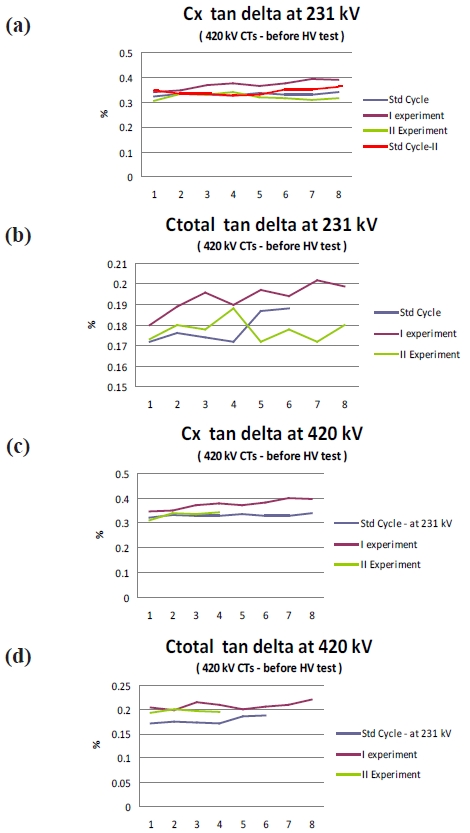
It can be seen (Fig. 8) that with the new cycle the specific value of tan delta has increased. However, the value is still within the limit and the value is very stable at 0.3 times and 1.3 times the rated voltage to the fourth decimal place. Interestingly, the tan delta values have relatively stabilized with the new experimental cycle as compared to the old cycle. The specific value of tan delta increases but then generally the design of the CT’s is performed with a sufficient margin and hence the rise in the value does not affect the performance of the CT.
A new process cycle was applied for the processing of CT’s and the CT’s were found to be of good quality as confirmed by the type of test results. The mass transfer process in the vacuum drying of a CT inside an autoclave was modeled and the simu-
lation trends were analyzed. The simulation trend reveals the formation of non terminating loops which can only be broken by changing the pressure or temperature. The dynamic simulation results have revealed that only 20 mm of the insulation is dried after 40 hours of processing. The drying times are high since the drying is done with a complete porcelain assembly. The TGA studies on paper revealed that there is molecular rearrangement of cellulose happening at a temperature of 60-70 degrees and the paper uptakes a maximum of 8 - 9% moisture. It is also evident that the staggering of jobs can improve heat transfer coefficients. The mass transfer and air heating cycle simulation results led to a new cycle and a reduction in cycle time was achieved. The mechanism of mass transport in case of drying of CT’s with porcelain housing was also understood.