Measurement of tropospheric winds has been recognized as one of the most important measurements for the atmospheric sciences. Global tropospheric wind measurements are routinely used for the improvement of large scale numerical weather prediction. High-accuracy measurements of the wind field on a limited scale can reveal local hydrodynamic properties such as streamlines and turbulences, which are essential for better understanding of mesoscale dynamic processes, air-mass transport and exchange of energy and matter with the surface. Modern remote sensing of wind fields in real time is becoming indispensable in a number of applications, such as airfield traffic control [1] and sailboat racing [2] where detailed knowledge of wind speed and directions provides increased safety or competitive advantage. One of the devices capable of these kinds of measurements is a Doppler wind LIDAR, which has so far proved to be a valuable tool in fixed location experiments. A number of applications would, however, require the operation of a Doppler wind LIDAR in a mobile environment, which has so far not been successful due to sensitivity to shock and vibrations, which resulted in critical failures such as misalignment of the optical path and damage to optical components. To stabilize a Doppler LIDAR system to the degree where it is possible to perform wind field measurements in motion, a shock absorption and vibration isolation system was designed and implemented.
In our study we used an incoherent vehicle-mounted Doppler wind LIDAR based on an Iodine filter at 532 nm, developed for atmospheric wind field measurements at the Ocean Remote Sensing Institute, Ocean University of China. Excellent performance of wind field measurements by this system has been confirmed up to the heights of 15 km in the night and 12 km in the day time [3]. The system has also shown good performance in measuring sea surface winds (SSW) in high spatial and temporal resolution [4]. All these measurements were performed with the LIDAR system stationary, level-adjusted and stable, as the exact direction of the laser beam was critical for its good performance in elevation-over-azimuth scans [5]. Without an appropriate vibration isolation system, shock and vibration from the vehicle engine rotation, pumping exhaust and uneven road surface affect the LIDAR directly and were found to be the cause for system failures such as optical path misalignment and optical component damage [6,7]. These failures severely limited LIDAR operation.
In order to ensure stationary LIDAR operation immediately after it is transported to the measurement site, and the mechanical stability of its optical system during LIDAR operation in motion, a shock absorption and vibration isolation system was designed and implemented. The ability of a Doppler wind LIDAR to perform wind field measurements in motion may enable its use in a number of new vehicle-mounted, airborne and shipborne applications.
II. DESIGN OF THE VIBRATION ISOLATION SYSTEM
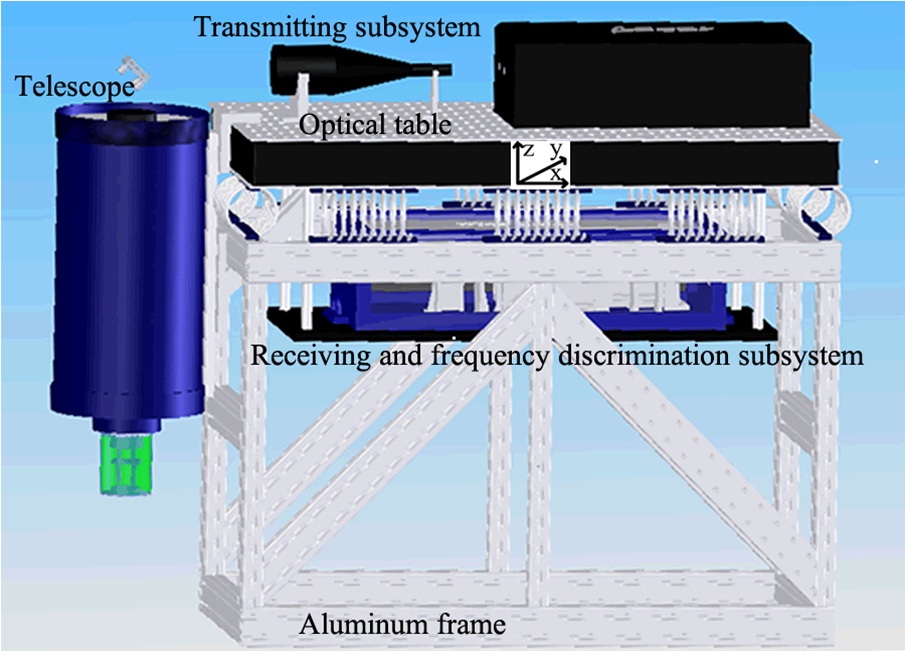
The incoherent vehicle-mounted Doppler wind LIDAR consists of four main components: the subsystem for the transmission, for the reception and frequency discrimination, for the data acquisition and the subsystem for scanning control [8]. Optical components are installed on a doublelayer optical table, which is mounted on a robust aluminum frame to ensure the desired strength and rigidity of the entire optical system with a total weight of 374 kg. The transmitting subsystem and the receiving telescope are mounted on its upper layer, while the rest of the receiving
and frequency discrimination subsystem is mounted on its lower layer (Fig. 1).
The conceptual idea of the vibration isolation system design is to isolate the optical part from the vehicle and the rest of the LIDAR and to thus reduce the harmful influence of vibration on optical components. In our case, we used ten wire rope isolators (M12-425-08 by IDC Shock & Vibration Isolation Specialists, USA), which have been proven in a variety of applications and performance tests [9]. The rigidity center of our vibration isolation system was designed to coincide with the center of gravity of the optical system and the isolating suspension elements were in the horizontal plane arranged uniformly and symmetrically around the center of gravity. This was shown to improve vibration isolation [10]. The isolators were installed between the upper optical table and the aluminum frame, each carrying equal vertical static loads of about 37.4 kg, which was within their designed static load range [11].
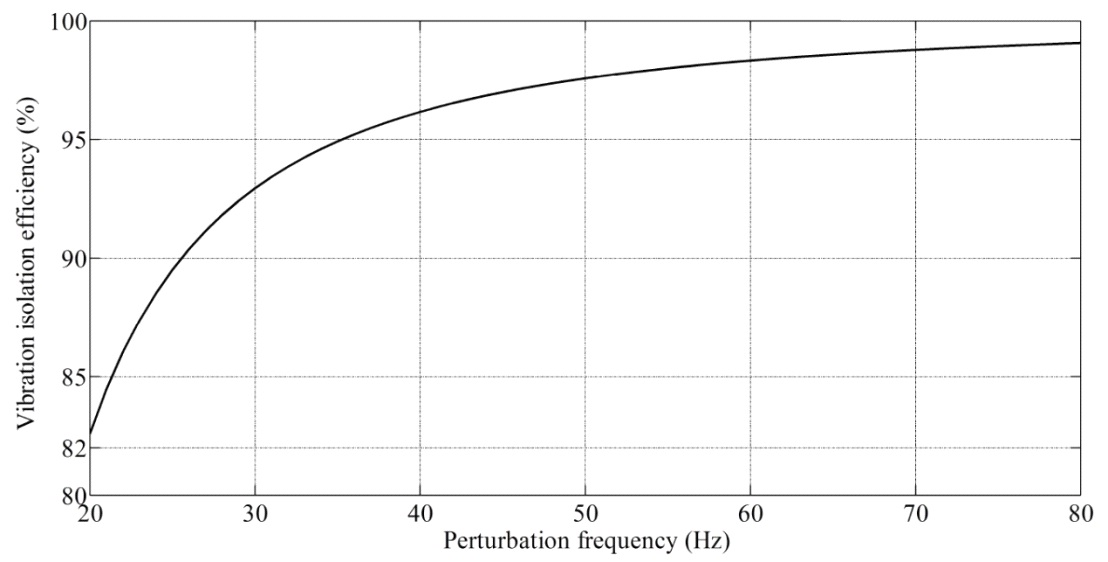
The system was subsequently tested through the analysis of the vibration isolation efficiency, the anti-shock effect and the LIDAR data quality of the wind field measurements performed in motion. The frequency range of perturbations due to the interaction of the vehicle with the road surface was taken to be 5-500 Hz, of perturbations due to automotive engine rotation 13-80 Hz and the total vibration frequency of a vehicle in motion was taken to be above 20 Hz [12].
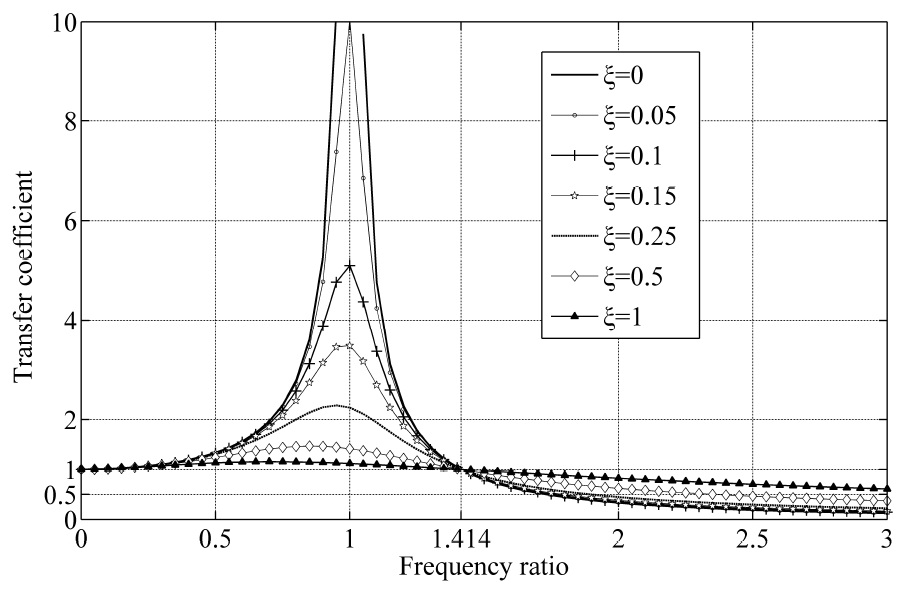
The extent of vibration isolation can be expressed by transfer coefficient

The isolators thus play an important role in the design of vibration isolation, as they define the eigenfrequency and thus the frequency ratio. The isolators should not be too soft, as this results in larger system size and the isolation system is easier to shake, which affects the stability of the optical table [13]. In the design, dynamic parameters of the isolator candidates, such as dynamic stiffness coefficient, peak response frequency and vibration isolation efficiency were considered. For the selected M12-425-08 isolator the total vibration stiffness of the system is about
was found to be about 7.7 Hz. The peak response frequency

For the coefficient
is graphically presented in Fig. 3. For perturbation frequencies above 20 Hz the efficiency
Short, abrupt perturbations (shocks) can also influence LIDAR measurements and cause serious damage to the optical components, so the response of the optical system to this kind of stimulations was also tested. Total shock stiffness

the eigenfrequency of the vibration isolation system to shock excitations
III. THE EFFECT OF THE VIBRATION ISOLATION SYSTEM ON THE LOCKING FREQUENCY
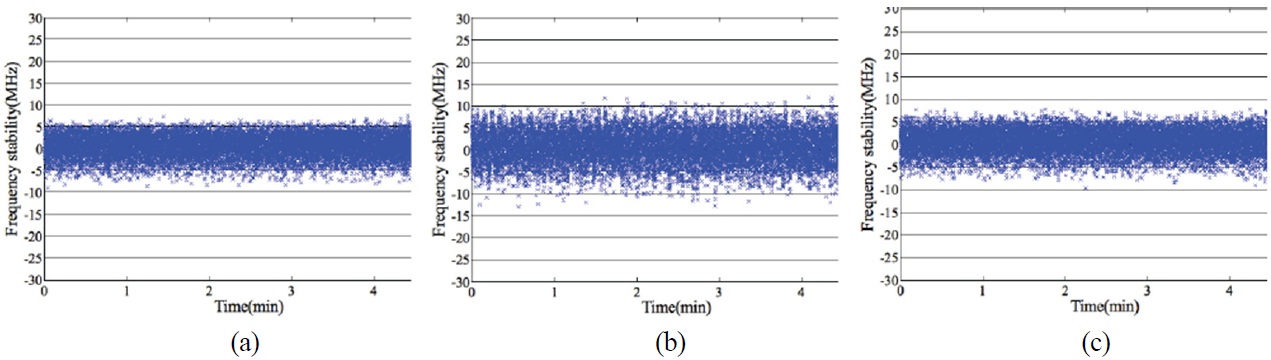
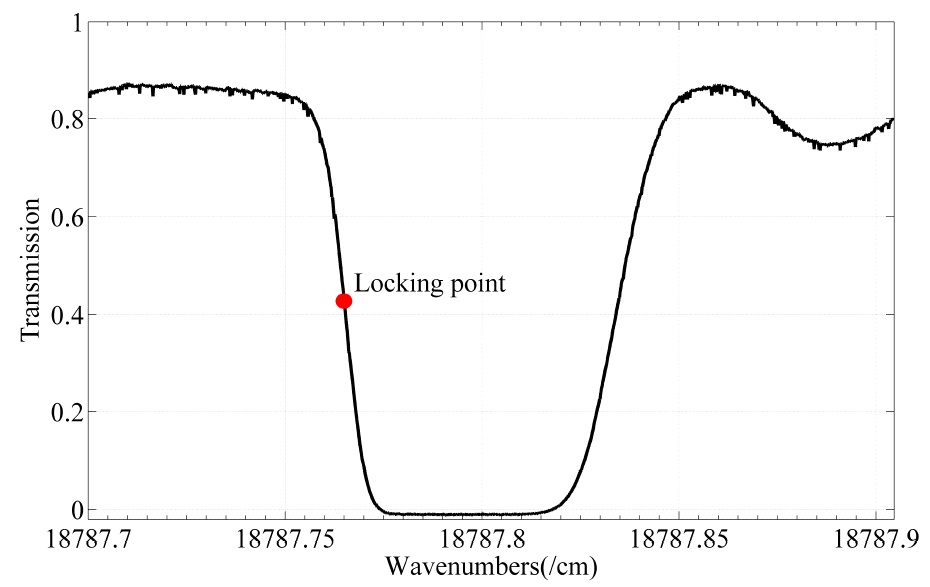
For successful operation of a Doppler wind LIDAR single longitudinal mode operation and frequency stability are essential. The pulse laser transmitter of our mobile Doppler wind LIDAR is excited by a dual wavelength seed injection laser and provides a tunable single longitudinal mode with the required frequency stability [15]. The stability of the laser frequency is obtained by locking the second harmonic of the seeded laser to the mid-point of a wing of Iodine absorption line no. 1109 near 532 nm [15,16], as shown in Fig. 4. The vibration isolation system was required to preserve the frequency locking effect under vibration and
was tested by simulated automotive engine excitations in a stationary environment. Comparisons of the locking frequency effect with and without the vibration isolation system are shown in Fig. 5. The standard deviation of the locking frequency uncertainty in a completely vibrationless environment was found to be 2.54 MHz (Fig. 5, left). The vibration isolation system was found to considerably improve the frequency stability, as the uncertainty increased to 4.78 MHz (Fig. 5, center) in the case of direct exposure to vibrations at 1800 rpm and only to 2.63 MHz (Fig. 5, right) when the system was in the plane.
IV. WIND FIELD MEASUREMENTS IN MOTION
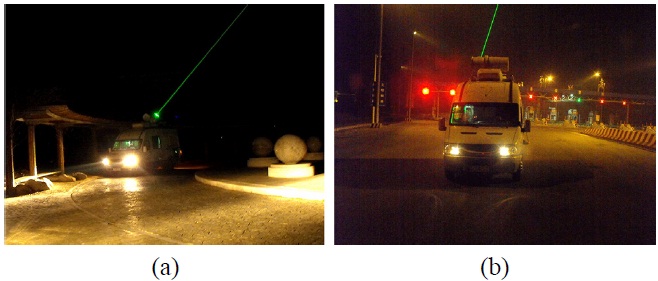
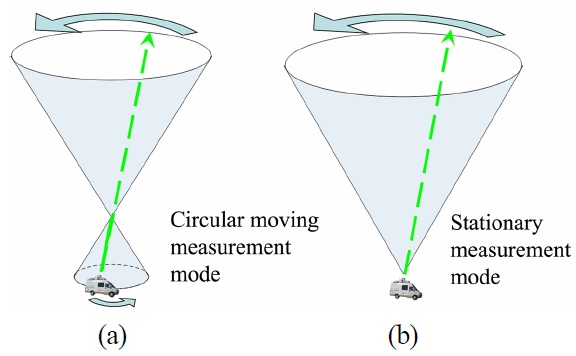
With the vibration isolation system installed, we performed a number of measurements in motion, both along a circular test track and in real highway traffic conditions. As shown in Fig. 6, measurements performed during circular motion of the vehicle with fixed elevation and azimuth angles of the LIDAR are equivalent to stationary scanning measurements with the laser beam direction controlled by an elevation-over-azimuth scanner. In both cases,

where
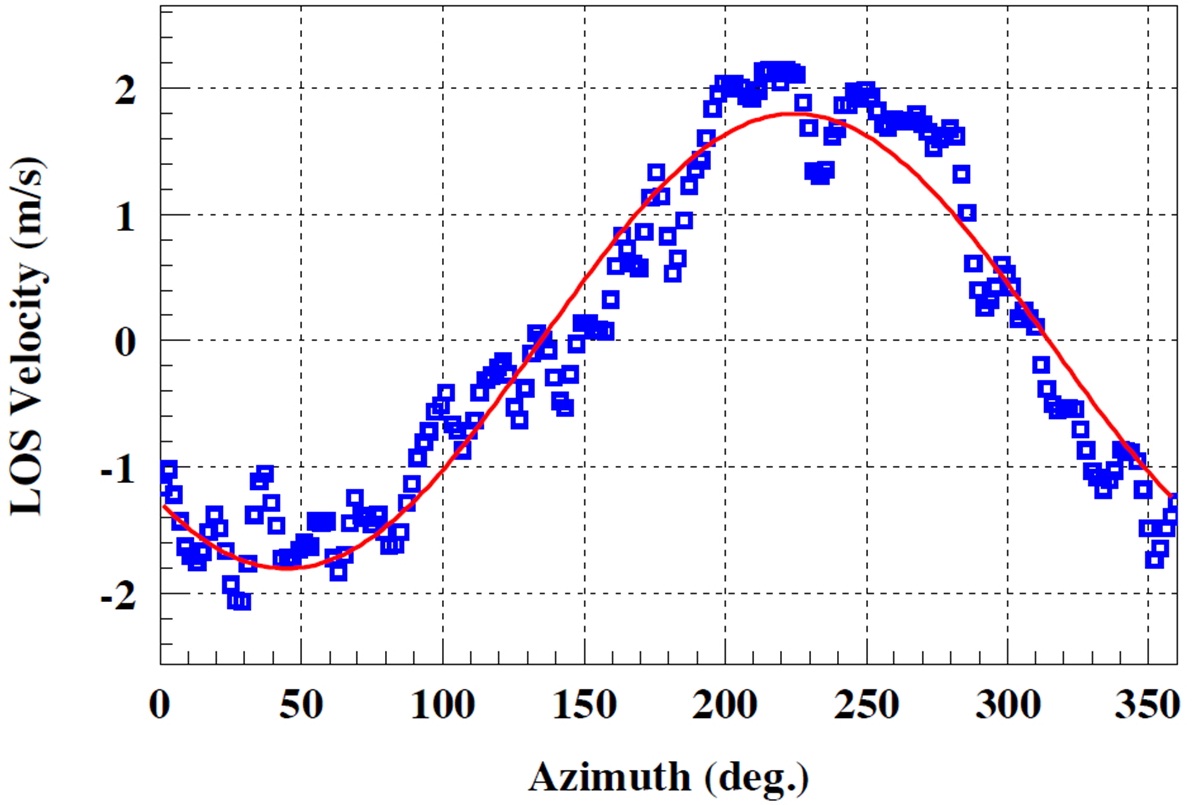
movement should be sinusoidal; the fits to LOS velocity at different altitudes then yield the wind direction and speed [5]. An example of the measured LOS velocity averaged over 9 loops with 45 deg elevation for the altitude of 0.5 km is shown in Fig. 8, where open squares represent data points and the full red line the cosine function fit. The retrieved values of the wind speed and horizontal wind direction (

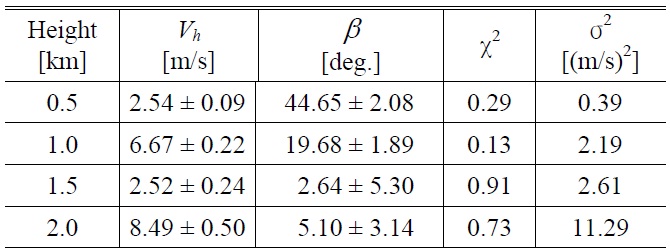
Summary of the retrieved wind speed Vh, the azimuth angle β of horizontal wind direction, the χ2 of the cosine fit and the variance σ2 of the distribution of the VLOS data points with respect to the fitted cosine curve for four different heights. Uncertainties of Vh and β were obtained from the fit
respect to the fitted cosine curve are summarized in Table 1 for four different heights. Deviations of the data points from the expected cosine dependence in azimuth are due to irregularities in the circular shape of the track and wind fluctuations.
In addition to circular motion measurements the mobile Doppler LIDAR was tested in regular expressway traffic to confirm the stability of the LIDAR measurements in realistic conditions (Fig. 7, right). The data from azimuthal scanning was displayed real time on the wind LIDAR’s data acquisition system and its performance was found to be good, as the vibration isolation system successfully reduced the induced the vibration and kept the optical system stable enough to be able to operate without any problems [17].
To conclude, we designed, constructed and implemented a vibration isolation system to protect the optical components of a mobile Doppler wind LIDAR from shocks and vibrations which arise when performing measurements in motion. In the tests, the system demonstrated high vibration isolation efficiency of more than 82% in the main vibration area and good anti-shock protection with shock dynamic deflection smaller than maximal deflection of the isolator. The implementation of the vibration isolation system also greatly improved the stability of the locking frequency of the seeded laser. Wind field parameters, including the planposition- indicator of the line-of-sight velocity and wind velocity and direction profiles were successfully obtained from LIDAR measurements in pre-determined circular motion as well as in regular expressway traffic. High quality of the obtained results encourages applications of our vibration isolation system to LIDARs at other mobile platforms, such as to ship-borne and airborne LIDARs.