The international society is recently confronted with a global environmental problem called the climatic change which has been induced by human activities since the industrial revolution. In an effort to actively regulate greenhouse gas emissions which directly causes global warming and the resultant climatic change, the United Nations Framework Convention on Climate Change was adopted in 1992 [1].
To impose obligations to reduce greenhouse gas emissions from developed countries, the Kyoto Protocol was ratified in 1997. Kyoto Protocol, which took effect as of 2005, establishes mandatory reduction goal of 5.2% as compared to 1990 vis-a-vis 38 developed countries. It also adopted new enforcement tools based on market principles such as joint implementations, clean developments, and emissions trade, etc.
Although the Republic of Korea joined the Convention on Climate Change in December, 1993, it is presently not under the reduction obligations because it does not belong to the Annex I. It is rather a non-Annex country. However, since Korea is one of the 15 largest emitting countries of greenhouse gas in the world and does not belong to the Annex I countries among the OECD members, there is growing international pressure on Korea to assume the reduction obligations [2].
The government of Korea is moving actively in response to such demands. A national vision of low-carbon green growth was being announced in 2008. In 2009, at the general meeting of the member countries of the Convention on Climate Change, it declared a voluntary goal of reducing the greenhouse gas emissions by 30% in comparison to business as usual (BAU) by 2020 [3]. As part of such reduction efforts, in accordance with Article 26, Section 2, of the Enforcement Ordinance of the Low-carbon Green Growth Fundamental Law, guidelines on management and operation of the targets for greenhouse gas and energy have been established and published. The government is urging enterprises with mass consumptions of energy and large buildings to strive for reduction efforts. It goes without saying that colleges and universities fall into the categories of large enterprises owning large buildings. In 2006, it was found that 23 colleges and universities were included in the 190 largest consumers of energy in the country (consuming 769,799 MWh of electricity) corresponding to 13% of the total consumption of 5,807,431 MWh from those largest consumers [4]. Since colleges and universities are such massive consumers of energy and such large emitters of greenhouse gas, measures to reduce the consumption of energy and emission of greenhouse gas by colleges and universities are requested. Consequently, our research herein aims to establish greenhouse gas inventory through the calculation of greenhouse gas emissions by universities. Based on such data on the greenhouse gas emissions, a projection of greenhouse gas emissions by colleges and universities between 2010 and 2020 have been made. At the same time, by concerning the reduction of greenhouse gas emissions, which is dependent on the amount of consumption of electricity in the area of scope 2 which occupies the largest portion among the various sources of emissions, an assessment has been made as to the amount of potential reduction in consequence of the reduction technology introduction and participation in the energy saving programs by members of colleges and universities.
The simulated reduction has been analyzed utilizing Longrange Energy Alternatives Planning (LEAP) system model which was developed by the Stockholm Environment Institute in the United States. LEAP model is the first energy model that has given consideration to the environmental impact. Since it builds up the modules incorporating categorized production, importation, conversion, demand, etc. of energy, it is possible to analyze the ripple effects of energy policies or technological changes. It also has the additional advantage of making it easier to supplement different methods for various categories. Furthermore, this model makes it possible to make descriptions by employing the functions included in the temporal system analysis, thus, the temporal changes of input variables may be easily reflected. In addition, the model contains built-in database of greenhouse gas emissions coefficient and technologies so that simulation of reduction of greenhouse gas may be properly done as applied to the reduction scenario of colleges and universities [5,6].
Previous studies [7] have already reported greenhouse gas
[Table 1.] List of greenhouse gas emission sources
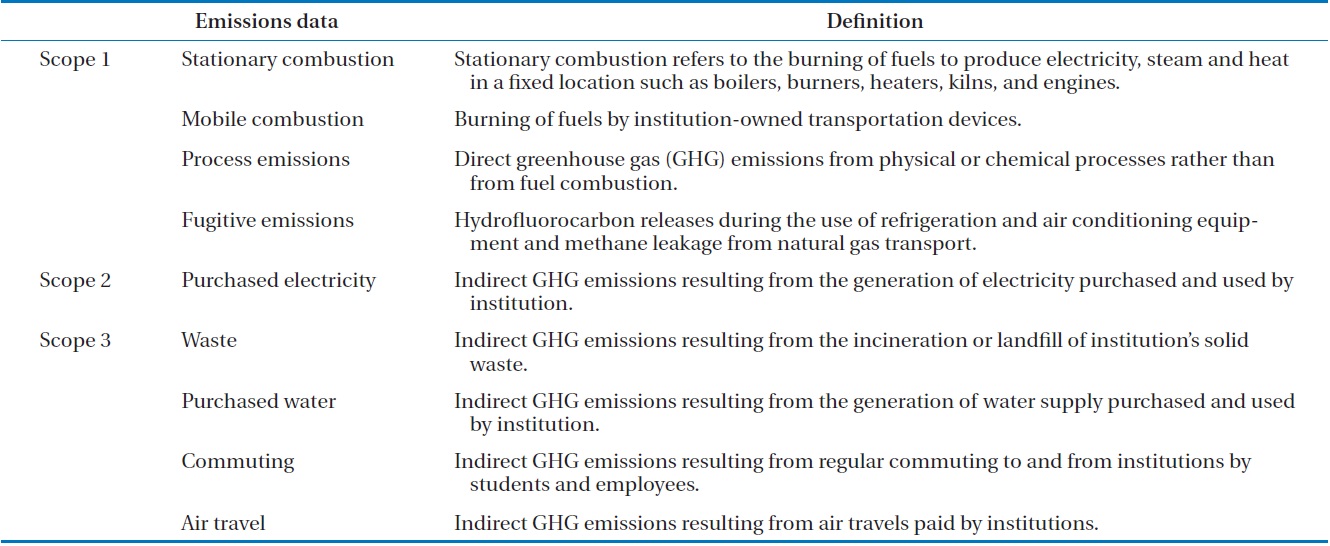
List of greenhouse gas emission sources
[Table 2.] Greenhouse gas inventory reference
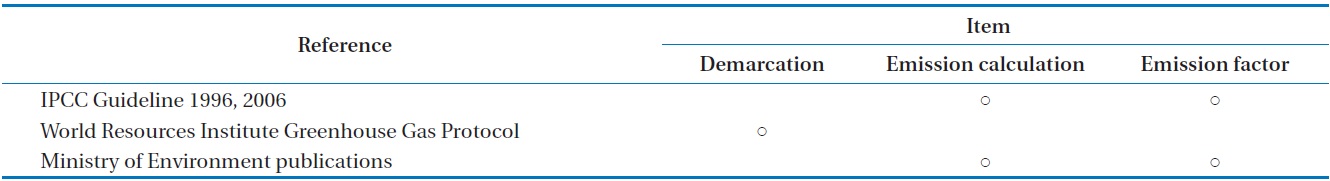
Greenhouse gas inventory reference
emissions and potential reductions with various scenarios by LEAP model in A University. This study focused on the action programs of the engineering building within A University such as the reduction technology and energy saving programs. Through the application of action programs on the engineering buildings of colleges, the amounts of the electricity being consumed and the potential amounts of reduction have been computed in the standard laboratory.
2.1. Calculation of Greenhouse Gas Emissions
Greenhouse gas inventory has been established in conformance with the guidelines for calculation of greenhouse gas emissions for each category based on the activities data of the administrative building of A University [7]. The various types of emissions contained in the greenhouse gas inventories have been classified into direct emissions, indirect emissions and other indirect emissions following the classification method [8] of the reporting standard for the American College & University Presidents Climate Commitment. Greenhouse gas emissions from each source as classified in Table 1 have been calculated by applying the methods of the referenced literature [9-11] as presented in Table 2 to the data on the amount of energy consumptions for each category.
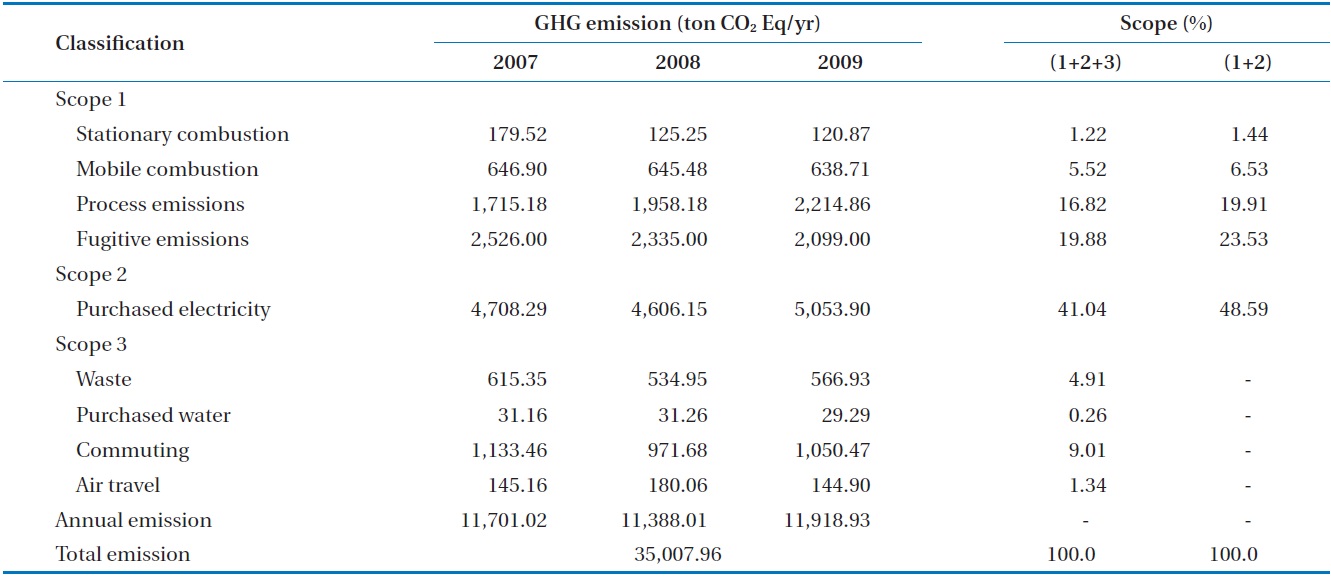
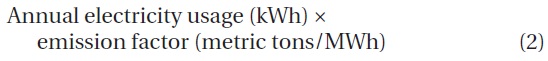
The A College’s greenhouse gas emissions as calculated by means of the aforesaid methods are 11,701 ton CO2 Eq/yr in 2007, 11,389 ton CO2 Eq/yr in 2008, and 11,919 ton CO2 Eq/yr in 2009
[Table 3.] Greenhouse gas (GHG) emissions resulting

Greenhouse gas (GHG) emissions resulting
in Table 3.
Eqs. (1) and (2) represented the emission for CO2 and CO2E from CH4 and N2O emissions in scope 1 and indirect greenhouse gas emissions due to electricity usage in scope 2.
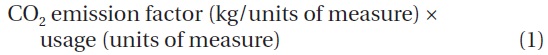
Since IPCC guidance [9] illustrated the emissions calculation methodology for calculating scope 3, not all calculating methodologies were described in this paper.
The majority of the emissions on campus were originated from scopes 1 and 2. Especially scope 2, which is the indirect emission caused by consumptions of purchased electricity, emitted an annual average of 4,789.44 ton CO2 Eq/yr during the three year period. The quantity of scope 2 emissions equals 41% of the total emissions of all categories and 49% of the combined scopes 1 and 2 emissions. Such statistics clearly coincide with the general characteristics of the greenhouse gas emissions from other colleges and universities.
3.1. Projection of Future Greenhouse Gas Emissions
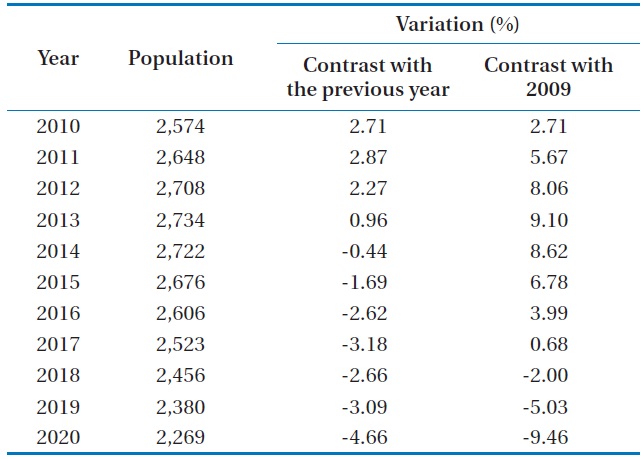
Based on the data on greenhouse gas emissions during the period of 2007?2009, greenhouse gas emissions on campus have been forecasted through 2020. The estimation was done by reflecting the estimated energy consumption during the period of 2010?2020 and by applying the rate of increase or decrease of school age populations published by the Statistics Korea [12].
As shown on Table 4, the populations of college age will increase up until 2013 but will decrease thereafter.
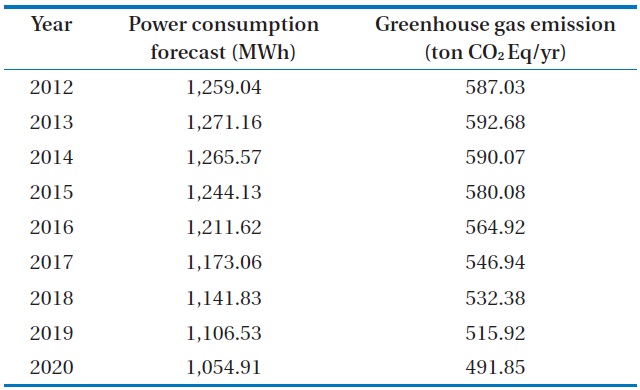
The power consumption and the greenhouse gas emissions for the Engineering College building, which was retrieved from the aforesaid data on the greenhouse gas emissions on campus, was 1,179.64 MWh, 550.01 ton CO2 Eq/yr in 2007, 1,154.05 MWh, 538.08 ton CO2 Eq/yr in 2008, and 1,165.13 MWh, 543.24 ton CO2 Eq/yr in 2009, respectively. From the results of the previous study [13], Table 5 presented the relationship between the school-age populations and greenhouse gas emissions on the basis of historical data. This trend indicated the decrease of school-age populations which resulted in the reduction of greenhouse gas emissions.
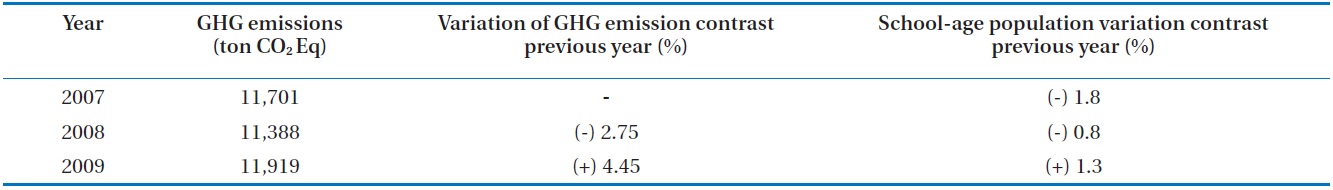
Based on the data in Table 5, the projected amounts of future power consumptions and greenhouse gas emissions have been obtained by applying college students’ population data from the Statistics Korea to the above database shown in Tables 6 and 7. According to Table 6, the change of the Engineering College building’s power consumption shows a similar trend to that of the actual power consumptions. Further, considering that the amount of actual power consumption during the years of 2010
[Table 4.] School-age population of the university

School-age population of the university
Relationship between the greenhouse gas (GHG) emissions and school-age population of A university
[Table 6.] Annual power consumptions of engineering building
Annual power consumptions of engineering building
and 2011 and the projected amount for the same period do not differ significantly, we can conclude that the amount of energy consumption and emissions during the period of 2012 through 2020 as projected in Table 7 is reliable.
3.1.1. Calculation of potential reduction in consequence of application of reduction technology
3.1.1.1. Method of applying reduction technology scenario
Scope 2’s electricity has been reclassified in contrast to the projected greenhouse gas emissions, which will change according to the college population, into the categories of power consumption. The resulting reduction from the reduction technology has also been calculated for each category of power consumption. The application scenario of reduction technology has been limited to one building of the Engineering College and the power consumption during the period of 2007 through 2011 has been reclassified by different uses including illumination, heating and air conditioning, and other uses. The future power consumption has been estimated through to 2020 by means of applying the change of college student population to the past consumptions of electricity for each category. It has been assumed that reduction technology, such as the installation of indoor sensors and change of light emitting diode (LED) lighting fixtures, will be adopted and the degree of adoption has been
[Table 7.] Power consumption forecast and verification by 2010?2020
Power consumption forecast and verification by 2010?2020
borrowed from the previous studies on the application methodology of reduction scenario [7].
3.1.1.2. The result of the application of reduction technology scenario
The annual reduction of greenhouse gas emissions for the illumination sector due to the application of reduction scenario is shown on the following Fig. 1. In the Fig. 1, the dotted bars show the reduction as a consequence of the reduction scenario application and the rest indicates the emissions for each illumination sector. The total of all the sectors represents the projection for non-applications of the reduction scenario. If the reduction scenario is not being applied, the power consumption in the illumination sector will be 229.43 MWh in 2012 and 192.23 MWh in 2020, a decrease of 16% as compared to 2012. Such a decrease of consumption reflects the decrease of the college age population. In the event where the reduction scenario is being applied, 94.25 MWh of electricity will be consumed in 2020, which is 51% less than the non-application scenario. The reduction of power consumptions can be converted to 45.68 in terms of reduction of greenhouse gas emissions.
3.1.2. Calculation of potential reductions in consequence of application of standard model laboratory energy saving programs
3.1.2.1. Composition of standard model laboratory
For the purpose of estimating energy consumptions and the potential reduction of greenhouse gas emissions, a standard model laboratory has been hypothesized in a building belonging to the Engineering College.
Spatially speaking, the standard model laboratory consists of professors’ offices and graduate students’ personal labs. A survey was done on the statuses of electrical apparatus for each office and personal lab.
The population of the standard model laboratory has been calculated based on the ratio between the total number of graduate students in the Engineering College and the total number of professors. As of 2010, the Engineering College of A University had 28 full-time professors and 77 students. There were 59 offices and personal labs with the total area of 1,932 m2. The apparatus was grouped into desk peripherals and shared apparatuses. The annual power consumption at such a standard model
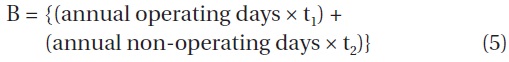
aplaboratory was calculated by considering the following process of Eq. (3) with (5):
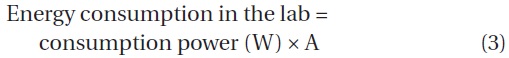

A: annual power consumption by electrical apparatus
B: annual operating hours distributed to electrical apparatus
t1: operating days distributed to each mode
t2: non-operating days distributed to each mode
In the equation, power consumption (W) indicates the hourly consumption of electricity for each electrical apparatus. Power consumption by the apparatus belonging to the standard model laboratory has been calculated based on the actual measurement.
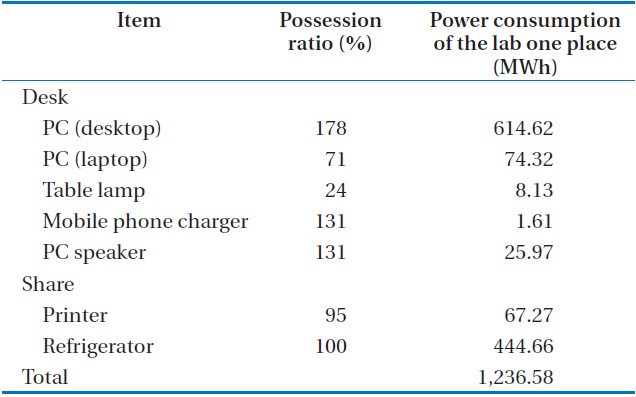
[Table 8.] The power consumption of laboratory unit

The power consumption of laboratory unit
[Table 9.] Annual power consumptions of standard model laboratory

Annual power consumptions of standard model laboratory
Table 8 shows the actual measurement data and the possession ration of electronics in each laboratory.
The projected annual power consumption by the standard model laboratory for 2012 and thereafter is shown on the following Table 9.
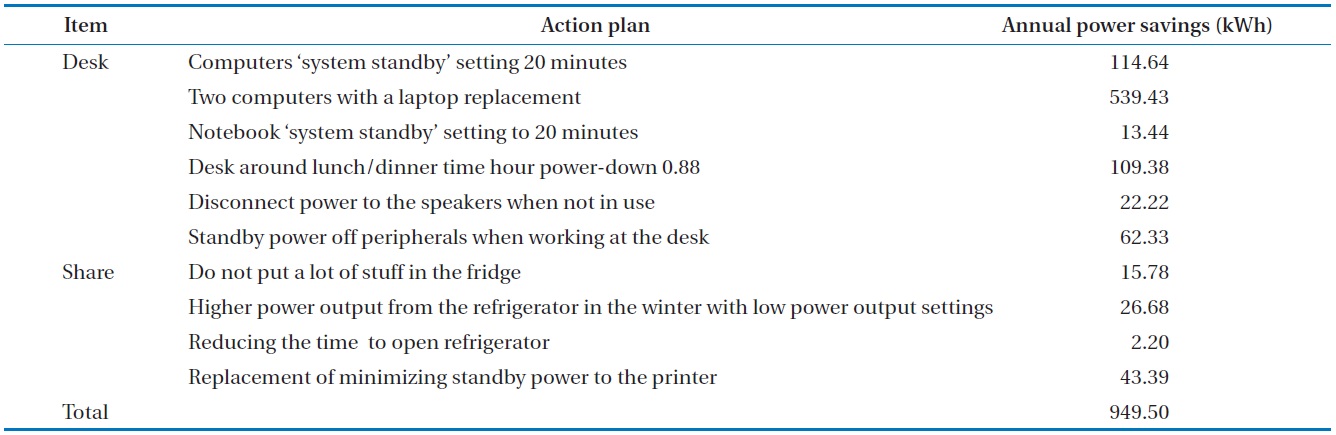
As for the action program list with the purpose of calculating annual reductions for each lab after applying the action program, the actual value measured by Graduate School for Health and Environmental Studies, Seoul National University and the Kyoto University’s manual for pro-environmental behavior, etc. were used [14]. The action program list and the amount of reduced power consumption are shown in Table 10.
It has been found that the energy saving action program is responsible for the reduction of 949.5 kWh for each standard model lab and the total reduction for all 59 standard model labs in the Engineering College building has been calculated to 56,020.5 kWh. Based on the above calculations, the comparisons between the current power consumption by the standard model lab and the reduced amount attendant upon the participation rate in the annual energy saving action program by each standard model lab have been estimated. It has been assumed that the rate of participation by the Engineering College’s standard model labs is 0% up to 2010 with addition of 10% for each year beginning from 2011, therefore, it will be 80% in 2018.
3.1.2.2. The result of the application of energy saving action program to the model standard laboratory
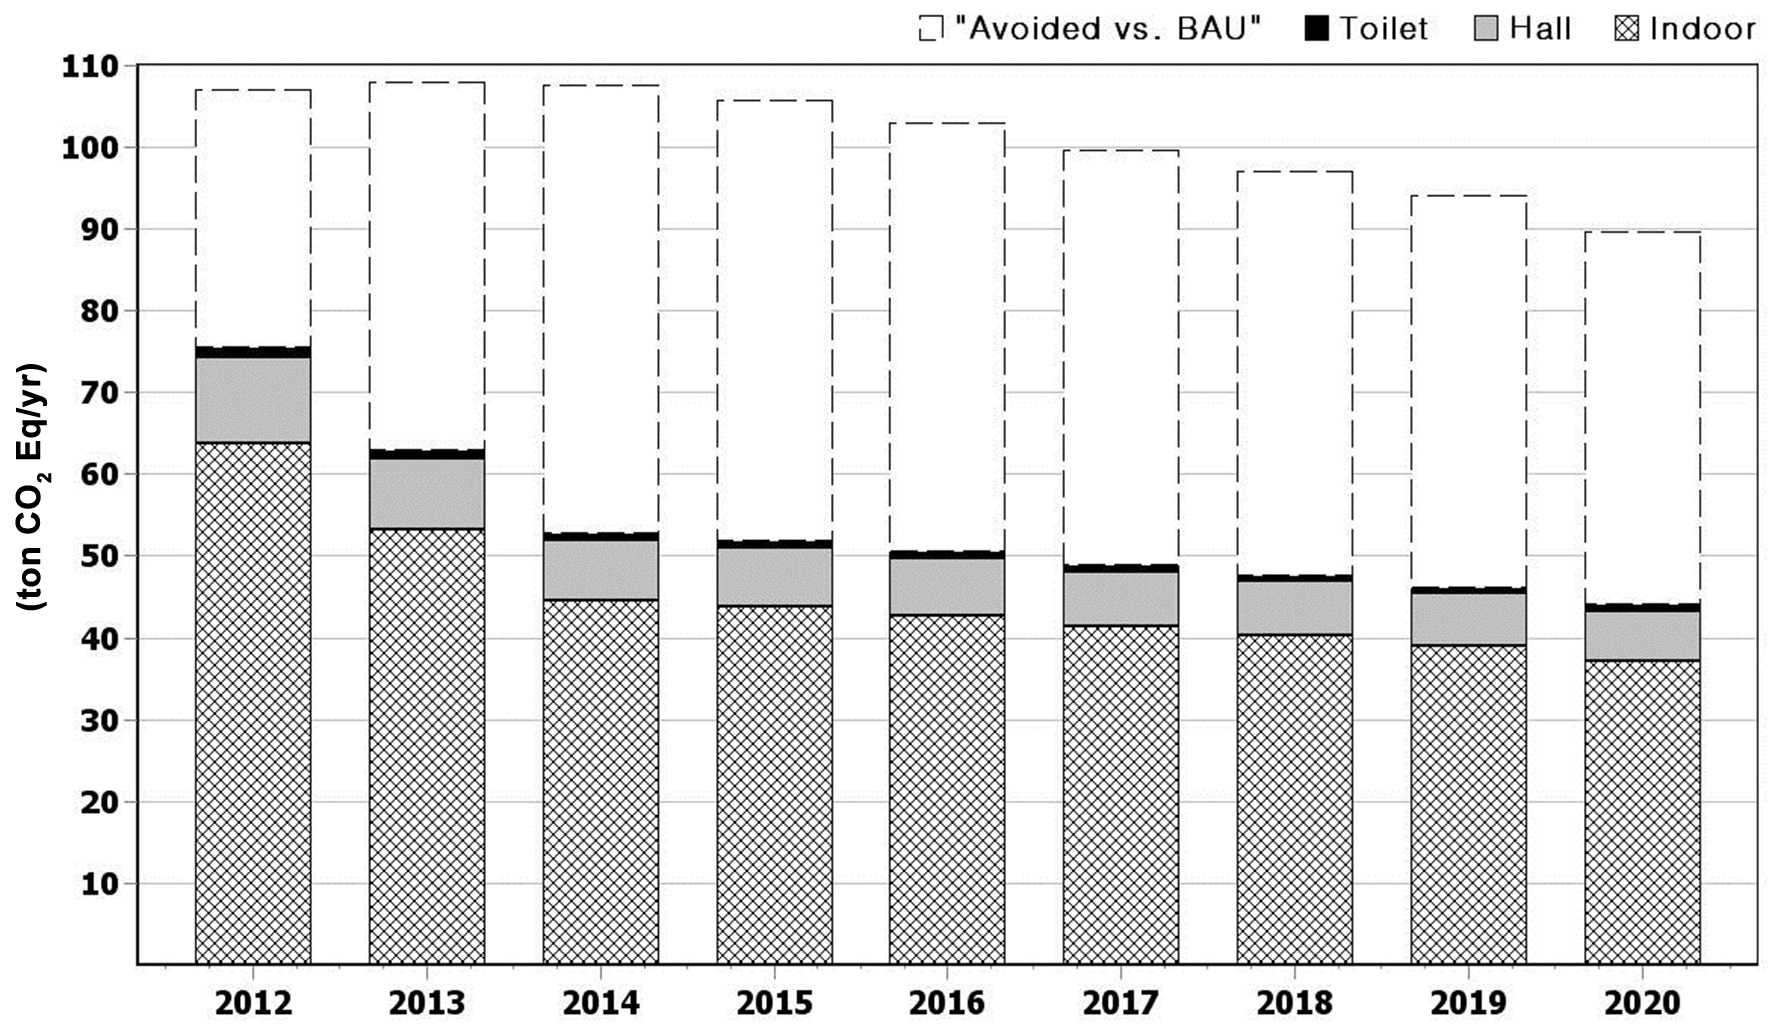
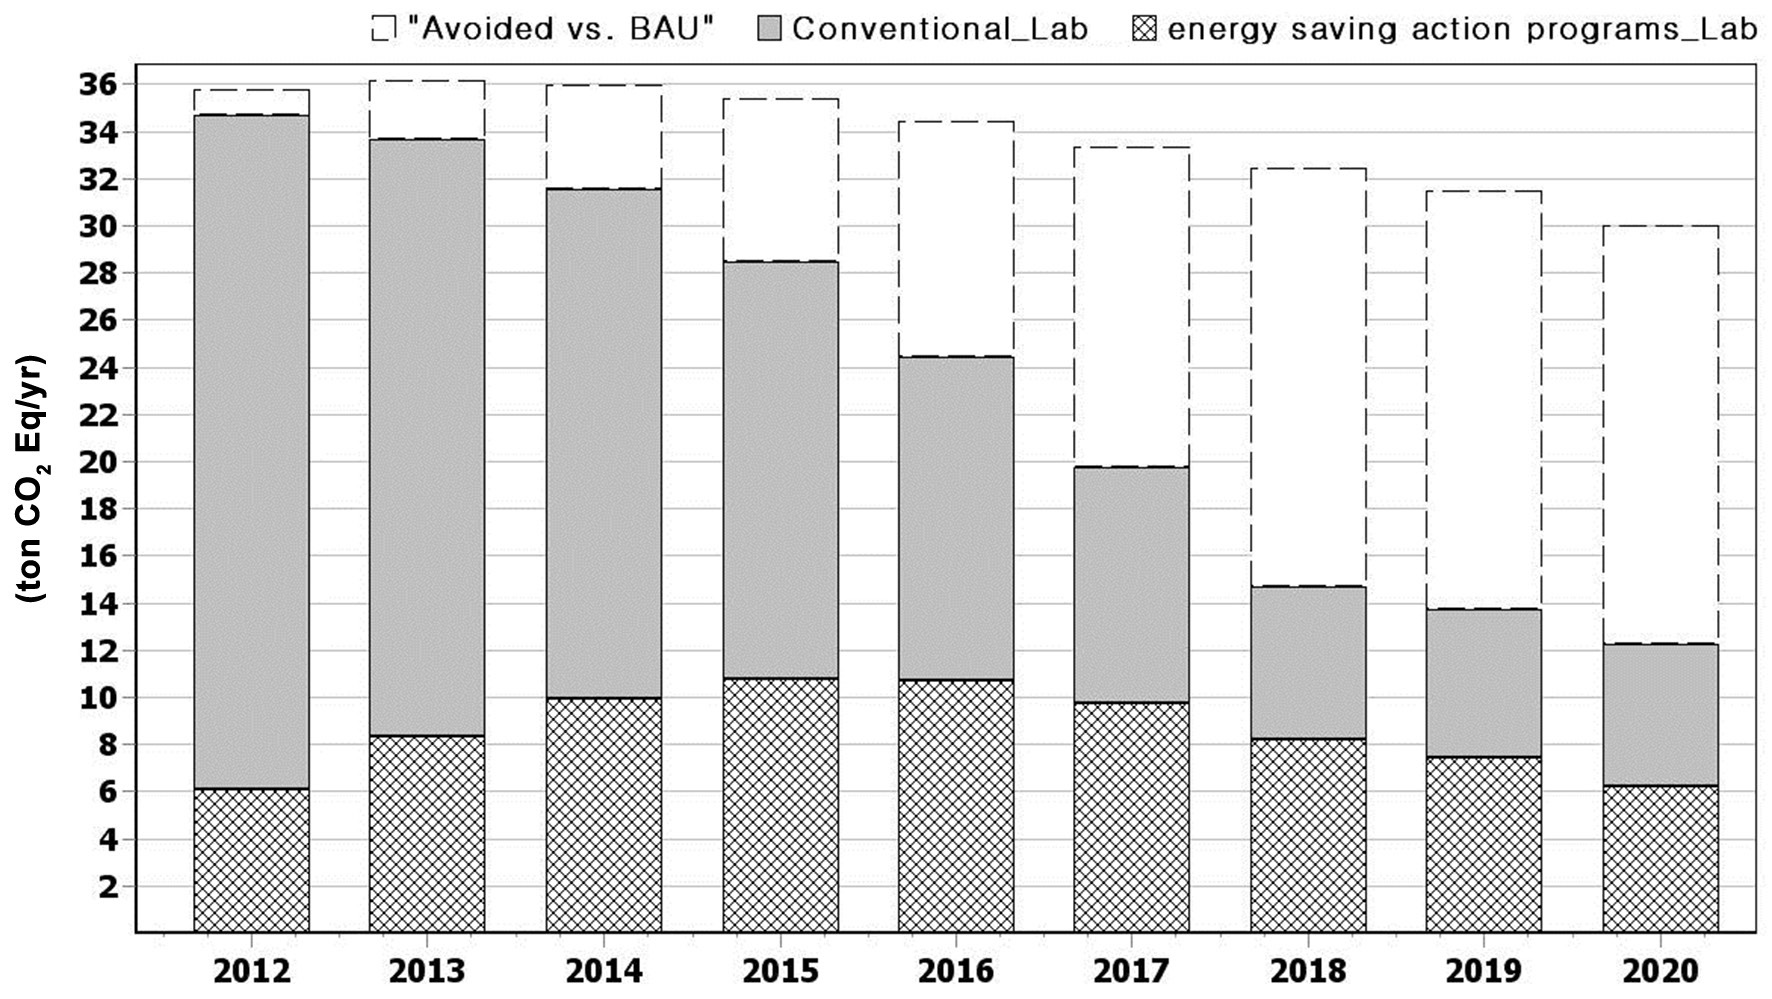
Fig. 2 demonstrates annual greenhouse gas emissions due to the application of the energy saving action program to the standard model laboratory. The dotted bars represent the reduction as a result of the application of the scenario and the remaining bars represent the greenhouse gas emissions in the event of participation or non-participation in the action program. The total of the three values represents the projected greenhouse gas emissions when the reduction action program is not being applied. If the reduction scenario is not applied, emission of 35.79 ton in 2012 is expected to decrease by 16.2% to 29.99 ton in 2020 when keeping the decrease of school-age population. On the other hand, in the event the energy saving program, the emission
[Fig. 2.] Greenhouse gas emissions simulation results of standard model Lab. BAU: business as usual.
[Table 10.] List of energy-saving action programs

List of energy-saving action programs
will be 7.79 ton in 2020. Compared to the above projections in 2020, it represents savings of 22.20 ton, equivalent to a 74% reduction.
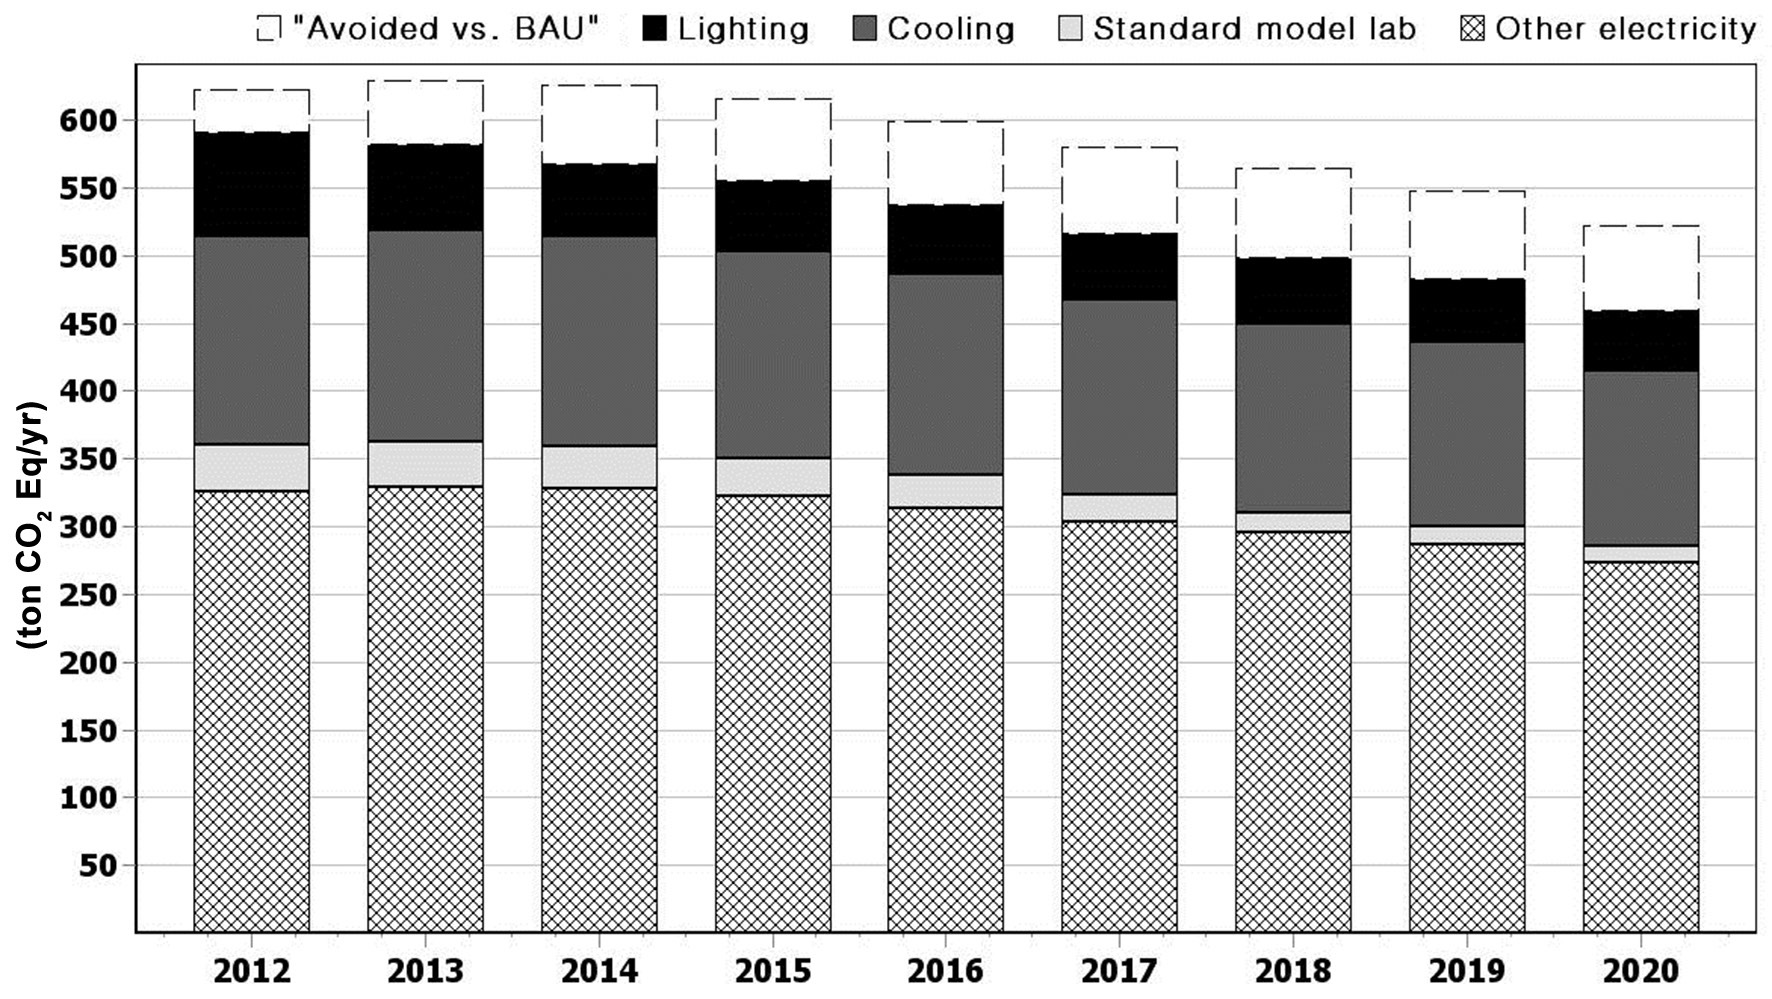
Fig. 3 shows the greenhouse gas emissions simulation results of the engineering building power sector with the application of the energy saving action program for the standard model.
The A University’s greenhouse gas emission is expected to decrease from 11,701.02 ton in 2007 to 10,791.31 ton in 2020 which also reflects the decrease of college-age population. The largest source of emission is the purchased electricity in the area of scope 2 which equals annual average of 42.1% during the period of 2007 through 2020 and can be converted to annual average emission of 5,102.35 ton. For the purpose of reducing greenhouse gas emissions caused by such large consumptions of purchased electricity, the sources of purchased electricity in a building belonging to the Engineering College have been categorized into illumination, heating and air conditioning, and other uses. And, the potential reduction of the on-campus greenhouse gas emissions has been simulated by applying reduction scenarios such as the introduction of applicable reduction technology for each item and the energy saving action programs.
Supposing that the Engineering College does not make any efforts for reduction, the greenhouse gas emissions caused by purchased electricity is forecasted as 584.02 ton in 2007 which will decrease by 11% to 521.84 ton in 2020 in abreast with the decrease of the school-age population. However, when the introduction of reduction technology and energy saving action program are applied as reduction scenarios, the greenhouse gas emission in 2020 is expected to be 453.96 ton representing a 13% reduction than compared to the BAU. The actual reduction comes to 67.88 ton. The reason that the reduction is somewhat lower than initially expected is because, in the first place, the simulation is limited to only one Engineering College building thereby resulting in less contributions to the overall reduction efforts, and secondly, because the calculation has only been made based on the currently available measures.
In order to enhance higher reduction in the future, it would be advisable to classify the emission sources in more detail according to the users; to build up database for calculation of additional reduction action program as well as other uses of electricity which contribute to the greenhouse gas emissions; and to itemize emission sources in a more detailed manner. Furthermore, it would be necessary to expand the reduction action program on the level of the school policy so that it may be applied to the personal apparatus in all the buildings.