Mountains are important habitats for a diversity of organisms in continental ecosystems. The altitudinal gradients formed in mountain ecosystems are an important physical factor that influences biodiversity and species distribution patterns because altitude affects temperature and precipitation, thus influencing the ecological and physiological adaptation of plants, mammals, birds and invertebrates (Lomolino 2001). Therefore, mountains represent a remarkable, distinctive system valuable for evaluation of ecological and biogeographical patterns and theories of species diversity (Korner 2000, Grau et al. 2007).
Many studies have documented the altitudinal richness patterns of plants (Lee et al. 2012), mammals (Rowe 2009), birds (McCain 2009) and invertebrates (Liew et al. 2010). Observed patterns have differed among taxa and regions. Three main types of richness pattern in relation to increasing altitude are reported: (1) a monotonic decrease, (2) a plateau at low altitudes, and (3) a humpshaped distribution with high richness at intermediate altitudes (Rahbek 2005). Of these patterns, the humpshaped pattern is reported to be the most common. Although the mechanisms underlying altitudinal richness patterns are still subject to debate, typical explanations include the influence of variables such as climate, area, geometric constraints or the mid-domain effect (MDE), productivity and evolutionary history (McCain 2009). Climatic variables are considered to be the most widely supported predictors of worldwide species richness (Rowe 2009), because they directly limit a species’ distribution when the physiological tolerance of the species is exceeded and indirectly affect photosynthetic activity and other biological processes. Previous studies indicate that the area of altitudinal bands explains a large proportion of the variation in species richness (Karger et al. 2011), in a similar manner to the well-known species?area relationships. Species?area predictions posit that a larger area provides increased habitat diversity, which may harbor a larger number of species, and an increase in area is accompanied by both a decrease in the extinction rate and an increase in speciation or colonization (Rosenzweig 1995). Recent studies suggest that the MDE, or geometric constraints, is also highly effective at explaining altitudinal patterns of species richness (Kluge et al. 2006, McCain 2009). The MDE postulates that geometric constraints on species ranges within a bounded domain yield a middomain peak in richness regardless of ecological factors (Colwell and Lees 2000). The MDE is abiotic and stochastic, and is founded on the premise that the spatial distribution of species richness is constrained by the shape of landmasses and by species range size. Under these conditions, random replacement of species ranges within a bounded domain creates an overlap of species ranges and thus a peak of species richness toward the center of the geographical domain (Colwell and Hurtt 1994, Colwell and Lees 2000). Productivity is an additional variable that may influence species richness patterns. Although the relationship between species richness and productivity is controversial, with disagreement over whether productivity controls or is controlled by species richness (Loreau et al. 2001), productivity is frequently cited as a fundamental determinant of species richness (Chalcraft et al. 2004). Waide et al. (1999) reviewed productivity?species richness relationships and identified four types of relationship: negative, positive, unimodal, and no relationship.
Despite increased interest in altitudinal patterns of species richness in recent years, few studies have comprehensively analyzed the underlying mechanisms of richness patterns along altitudinal gradients. Moreover, recent rigorous comparative studies suggest that, although area, MDE, climatic variables, and productivity are frequently cited in studies of species richness on mountains, a single variable cannot fully explain the species richness patterns among different groups in a single taxon along altitudinal gradients, and that different variables may drive such patterns among different groups in mountain ecosystems (Wang et al. 2007, Watkins et al. 2006, Lee et al. 2013).
In this context, we examined the distribution of terrestrial plants along an altitudinal gradient on the ridge of the Baekdudaegan Mountains (hereafter ‘the Baekdudaegan’), South Korea. Using data from field surveys, we aimed to (1) explore the altitudinal patterns of species richness for total, common and rare plant species along the ridge of the Baekdudaegan; (2) evaluate the effects of area, MDE, two climatic variables (mean annual precipitation and temperature), and productivity on the altitudinal patterns of plant species richness; and (3) examine whether species richness patterns are related to latitude.
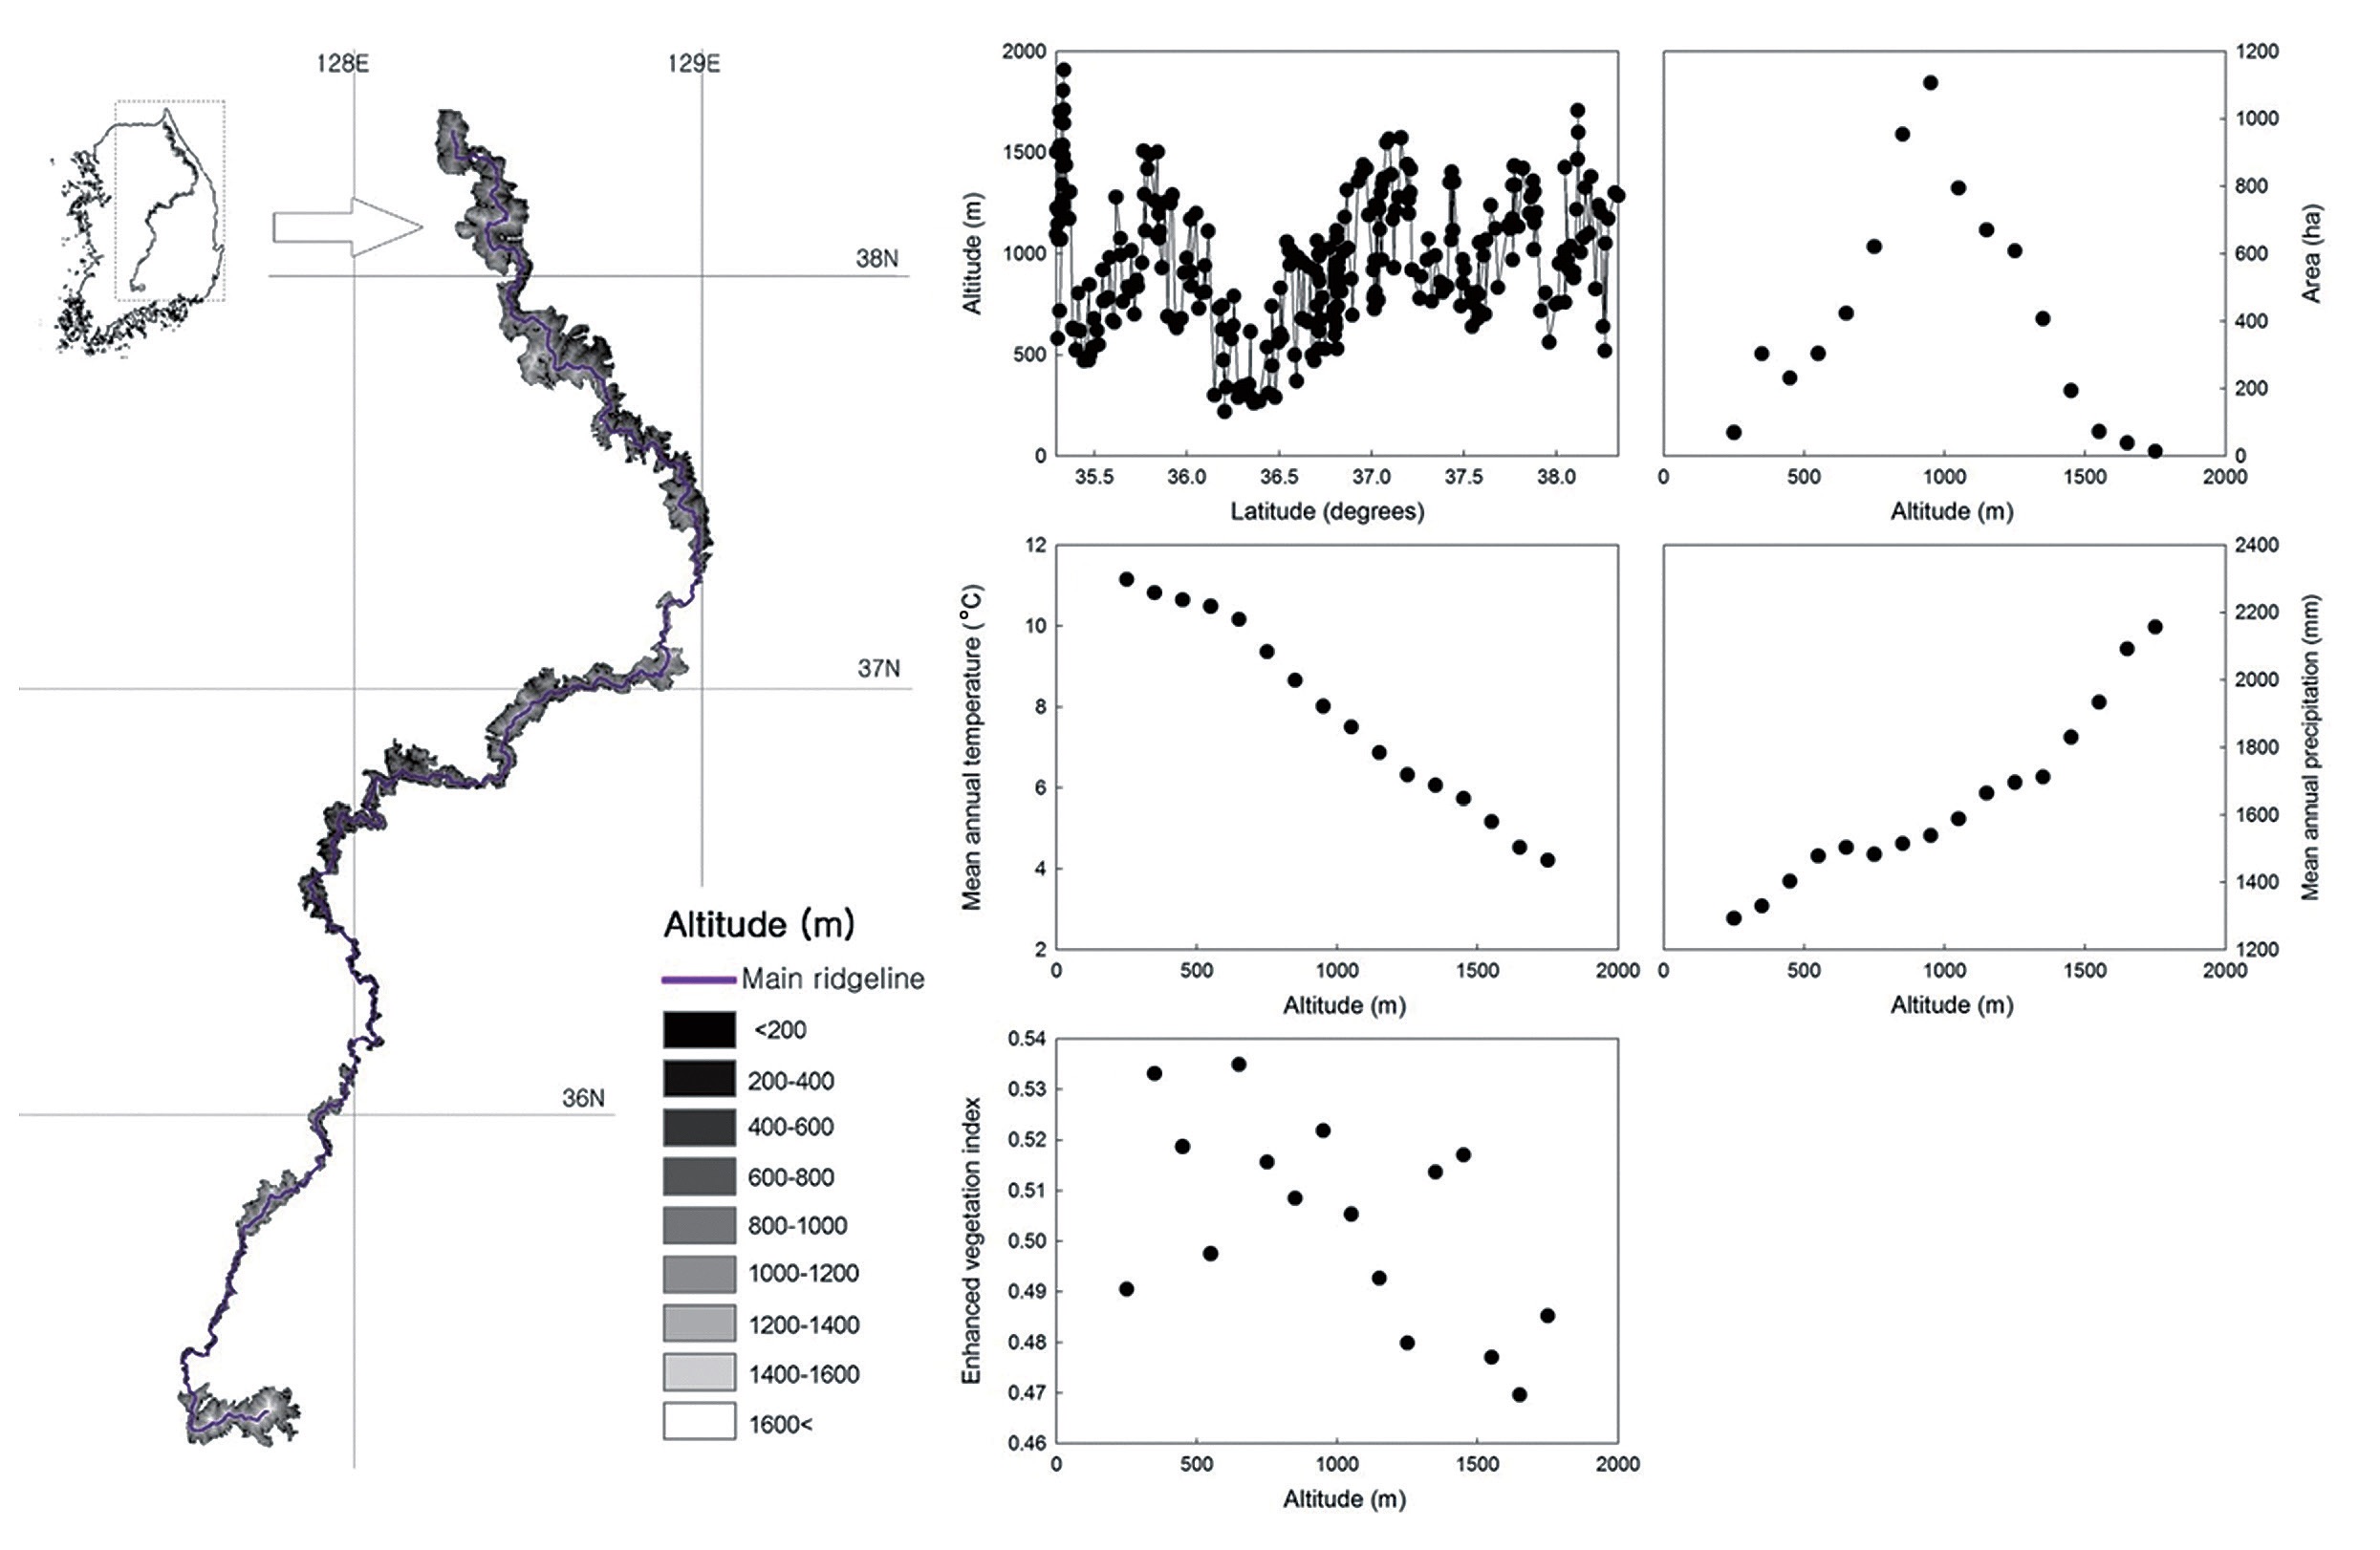
The study transect covered the main ridge of the Baekdudaegan (35°15′N to 38°22′N, 127°28′E to 129°3′E) in South Korea (Fig. 1). The Baekdudaegan consists of about 487 mountains, hills and peaks along the Korean Peninsula and is a major resource for forest biodiversity (Korea Forest Research Institute 2003). The protected area of the Baekdudaegan was designated in September 2005 by the Korea Forest Service; the total protected area, including the main ridge, covers 2,634 km2 (1,712 km2 core area and 922 km2 buffer zone). The main ridge extends about 650 km from Hyangnobong Peak of 1,287 m above sea level (a.s.l.) to Mt Jiri of 1,917 m a.s.l. in South Korea. One can travel along the ridgelines without crossing any rivers or streams. The altitudinal gradient of the main ridge extends from 200 to 1,909 m a.s.l. as indicated by a digital elevation model generated using a mosaic of 1:25,000 topographical maps produced by the National Geographic Information Institute that cover the study area (Fig. 1a).
The Baekdudaegan in South Korea belongs to a mountain ecoregion, and temperate deciduous and mixed forest biome (Korea Forest Research Institute 2003). The soil consists of granite, granite gneiss, and highly deformed and recrystallized sedimentary rocks (Shin 2002). Although the natural environment of the Baekdudaegan
is poorly known because of insufficient survey data, the Baekdudaegan contains many biodiversity hotspots and offers natural habitats for abundant and varied fauna and flora. A total of 1,477 plant species are distributed on the Baekdudaegan (Korea Forest Research Institute 2003), which accounts for 35.2% of the vascular plant diversity on the Korean Peninsula.
The vegetation on the Baekdudaegan can be categorized into 49 communities, including seven planted communities (e.g., the
For field sampling, an imaginary 100-meter-wide transect was established in a north?south direction along the ridge of the Baekdudaegan, and the ridge was divided into 16 altitudinal bands each of 100 m altitude from 200 m a.s.l. to >1,700 m a.s.l.. Although sampling extended to 1,900 m a.s.l., the 1,700 m and higher range was treated as a single band because only a small number of plots were sampled and few plant species were observed above 1,700 m a.s.l. Data on the plant species present within each altitudinal band of the transect were recorded from May 2005 to August 2009. Vegetation sampling was performed to cover the most common and specific physiognomic vegetation types in each 100 m altitudinal band. Data were obtained for a total of 1,100 plots of 400 m2. Within each plot, plants were surveyed in accordance with the method of Braun-Blanquet (1965).
We divided the altitude range into 100 m bands to examine the relationship between plant species diversity and altitude. Plant data for the same altitudinal band were pooled and the number of species observed in each band was considered to be a measure of richness. Plant species were classified into three groups including total, common and rare plant species based on the Rare Plants Data Book of Korea (Lee 2009). The plant species checklists for each altitudinal band are available in Lee et al. (2013).
Two space-related variables, area and MDE, were investigated in relation to species richness. To test species? area relationships, we calculated the area of each altitudinal band along the 100-meter-wide transect. Calculations were performed using a digital elevation model with the 3D Analyst extension in ArcGIS. The MDE null model was used to test the influence of geometric constraints on the spatial patterns of species richness along the altitudinal gradient. We used a novel, discrete MDE model based on Colwell and Hurtt’s (1994) continuous Model 2, which does not require the use of interpolated ranges (Fu et al. 2006). RangeModel ver. 5 software (Colwell 2006) was used for simulation. The simulation process was repeated 5,000 times and expected mean richness and its 95% confidence intervals were used to assess the effects of geometric constraints on the altitudinal gradient. Unlike many recent studies, we did not use interpolated species richness modified from actual distribution records. The justification for interpolation is that undersampling creates gaps in altitudinal distribution (Kluge et al. 2006). However, three problems with interpolation are reported (Grytnes and Vetaas 2002, Diniz-Filho et al. 2003, Kluge et al. 2006). First, it disrupts the crucial control of sampling area and intensity as species are added that were not, in fact, present in the plots. Second, interpolation might artificially increase richness to a higher degree at intermediate altitudes, because gaps are filled only between the lower and upper range limits; this essentially assumes that no individuals of a species have been missed beyond the observed range limits, but that individuals have been missed at sampling points within the range limits. Third, species richness at nearby altitudes is more similar than at distant altitudes, and the resulting spatial autocorrelation inflates Type ? errors. The spurious effects of autocorrelation increase when using interpolated distribution data. However, many studies on altitudinal richness patterns use interpolated data and comparisons of such studies with our non-interpolated results might be difficult. Therefore, we also calculated the interpolated richness for total, common and rare plant species. Observed and interpolated richness patterns showed the same pattern along the altitudinal gradient and were strongly correlated (total species,
The two climatic variables used in this study were mean annual temperature (MAT) and precipitation (MAP). We used digital climate maps produced by the Korea Meteorological Administration and National Center of Agrometeorology to extract the meteorological parameters for each altitudinal band (Yun 2010). The MAT data were dated from 1971 to 2008 and the MAP data were dated from 1981 to 2009. The spatial resolution of the raster data was 30 m for MAT and 270 m for MAP. The MAT and MAP were calculated for each altitudinal band in the transect.
As a proxy for aboveground net primary productivity we used the enhanced vegetation index (EVI), which is preferred over the normalized difference vegetation index because it is insensitive to soil or atmospheric effects and adjusts the red wavelength as a function of the blue wavelength to minimize brightness-related soil effects (Adhikari et al. 2012). MODIS-driven EVI images, composited at 16-day intervals, were downloaded in tiles for the period from January 2004 to December 2009 and mosaicked together using the MODIS reprojection tool. The averaged annual EVIs were used to assess the relationship between the diversity indices and productivity.
The relationships between species richness and the explanatory variables were analyzed for each individual variable using a simple linear regression. Such a linear model tests only for a linear relationship between the potential explanatory variable and species richness, but several scenarios under which a unimodal model is more biologically reasonable are plausible (Kluge et al. 2006). Therefore, we also used a polynomial regression model to detect curvilinear relationships by including a quadratic
term in the regression function. In addition, we used forward stepwise multiple regression models to establish the relative importance of area, MDE, MAT, MAP and EVI as explanatory variables for species richness. Forward stepwise multiple regressions were used to find a set of independent variables that together provided the best fit for diversity indices by minimizing the sum of squared residuals. All linear and quadratic terms for the explanatory variables were used in forward stepwise multiple regressions. Simple and forward stepwise multiple regression models were analyzed with S-PLUS ver. 8.0 (Insightful Corp., Seattle, WA, USA). All possible analyses were conducted for each of the three plant groups.
A total of 802 plant species belonging to 97 families and 342 genera were recorded from the 1,100 plots along the altitudinal gradient (Table 1). More than half of these species were herbaceous (69%; 62 families, 249 genera, and 554 species) and woody plants accounted for 31% of the species (47 families, 99 genera, and 248 species). Common and rare species accounted for 91% and 9%, respectively, of the total plant species.
With increasing altitude, the area of the altitudinal bands increased sharply and then decreased above the 900 to 1,000 m band, thus showing a hump-shaped pattern (Fig. 1b). The MAT declined monotonically with increasing altitude (Fig. 1c), whereas the MAP increased along the altitudinal gradient (Fig. 1d). The EVI generally declined with increasing altitude (Fig. 1e). The MDE null model showed deviation of the observed species richness from simulated richness (Fig. 2). The analysis revealed that for total, common and rare plant species, 56%, 63% and 63% of the data points, respectively, were outside the 95% confidence intervals of the values predicted by the MDE null model.
>
Altitudinal richness patterns and range size
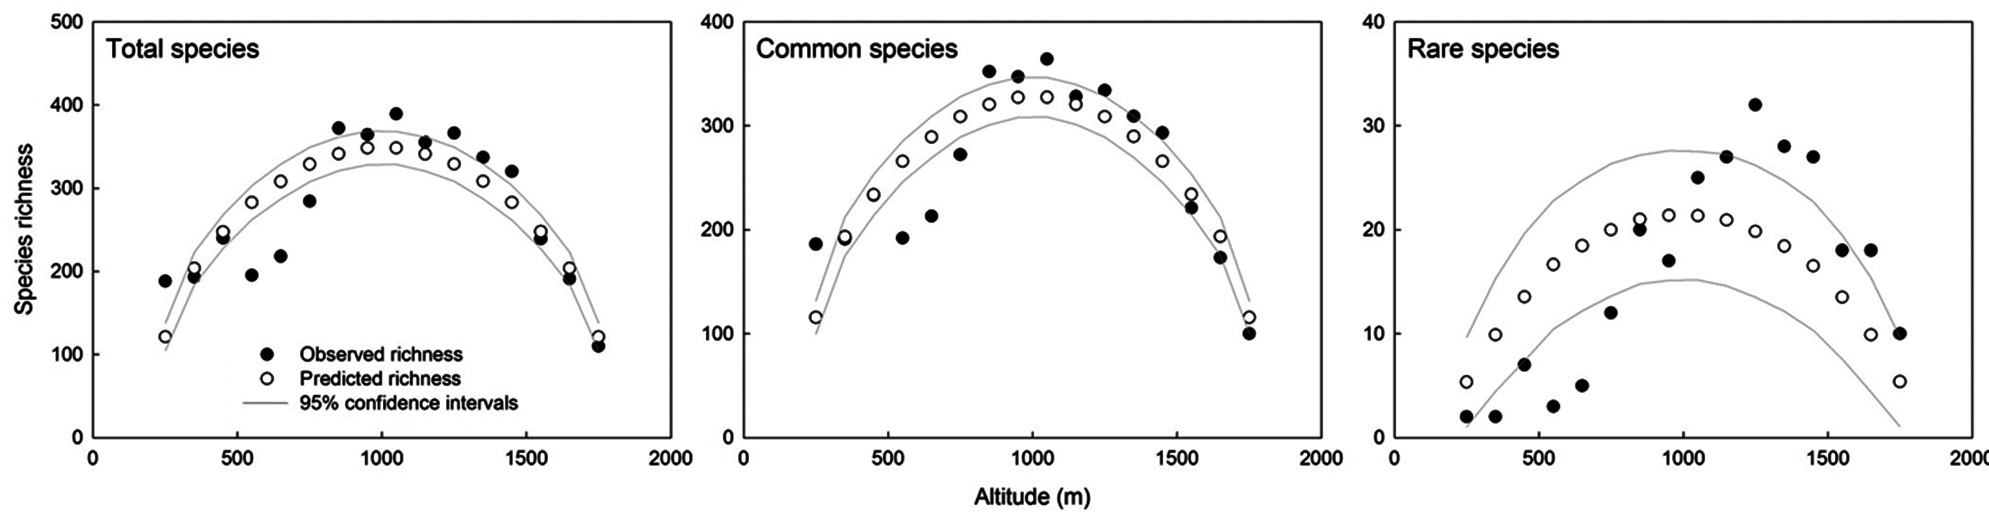
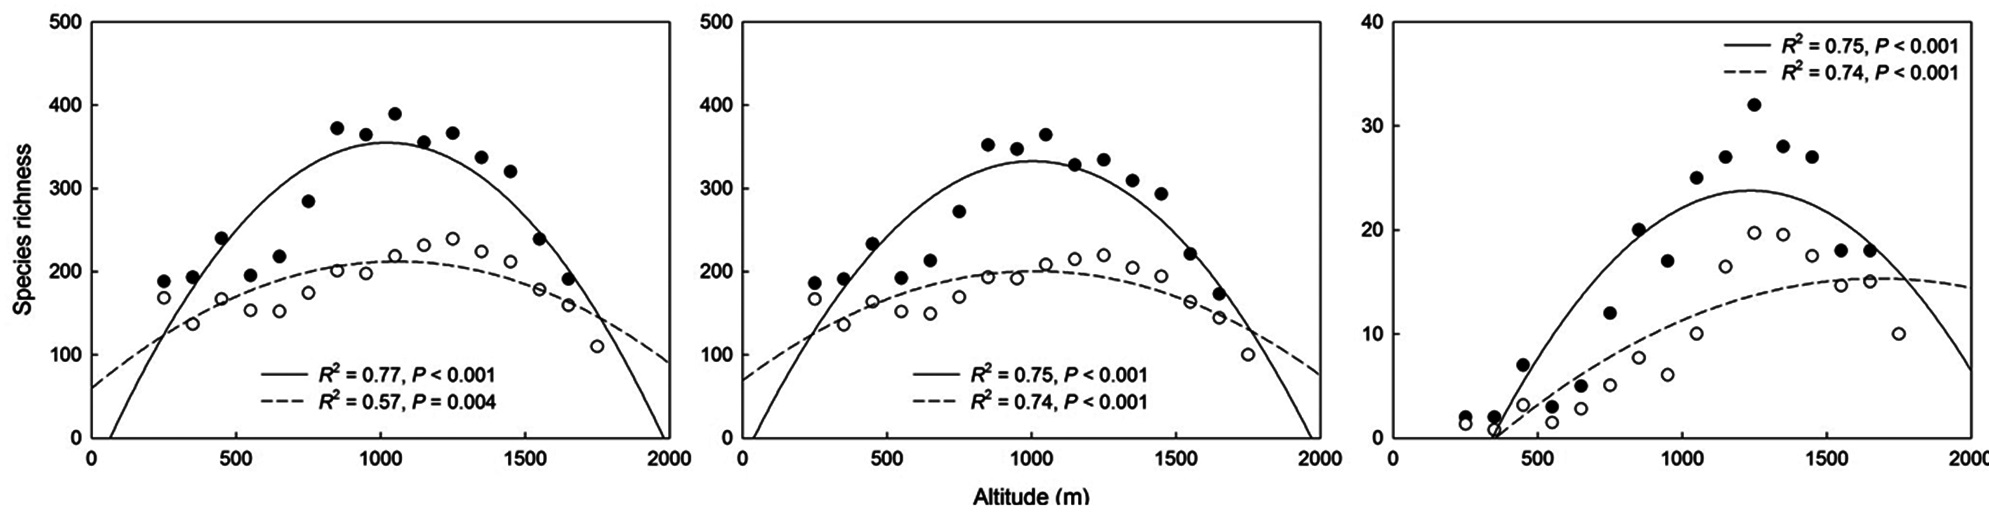
The richness of total and common plant species each showed a hump-shaped pattern with maximum richness recorded between 1,000 and 1,100 m (Fig. 3a and 3b), whereas the richness of rare plant species peaked in the altitudinal band between 1,200 and 1,300 m and the maximum richness peak was higher than those of total and common species (Fig. 3c). The patterns of rarefied species richness were similar to the observed richness patterns for all three plant groups. Overall, species richness for all plant groups showed a distinctly hump-shaped pattern in relation to altitude, even though the absolute altitudes of the peaks differed somewhat among the plant groups.
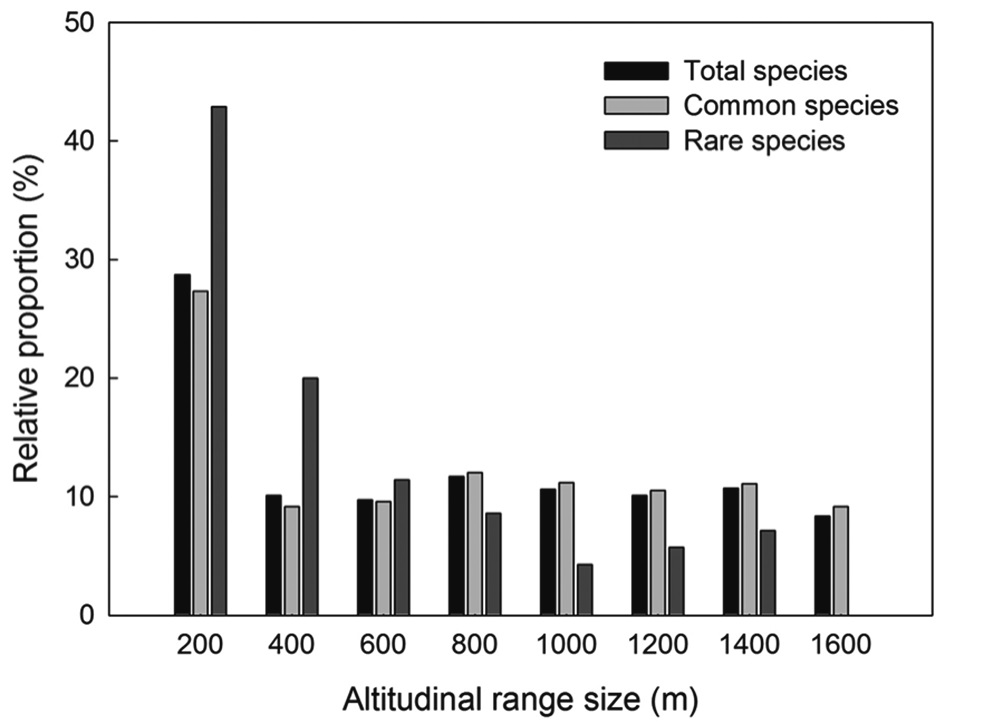
Most plant species in the Baekdudaegan showed very narrow altitudinal ranges (Fig. 4). The altitudinal range was ≤200 m for 29% of total plant species, 27% of common plant species, and 43% of rare plant species. No species was present in every altitudinal band. The relative proportion of rare species declined more rapidly than for total and common species with increasing range size (i.e., the altitudinal range of total and common species tended to be greater than that of rare species).
>
Determinants of altitudinal richness patterns
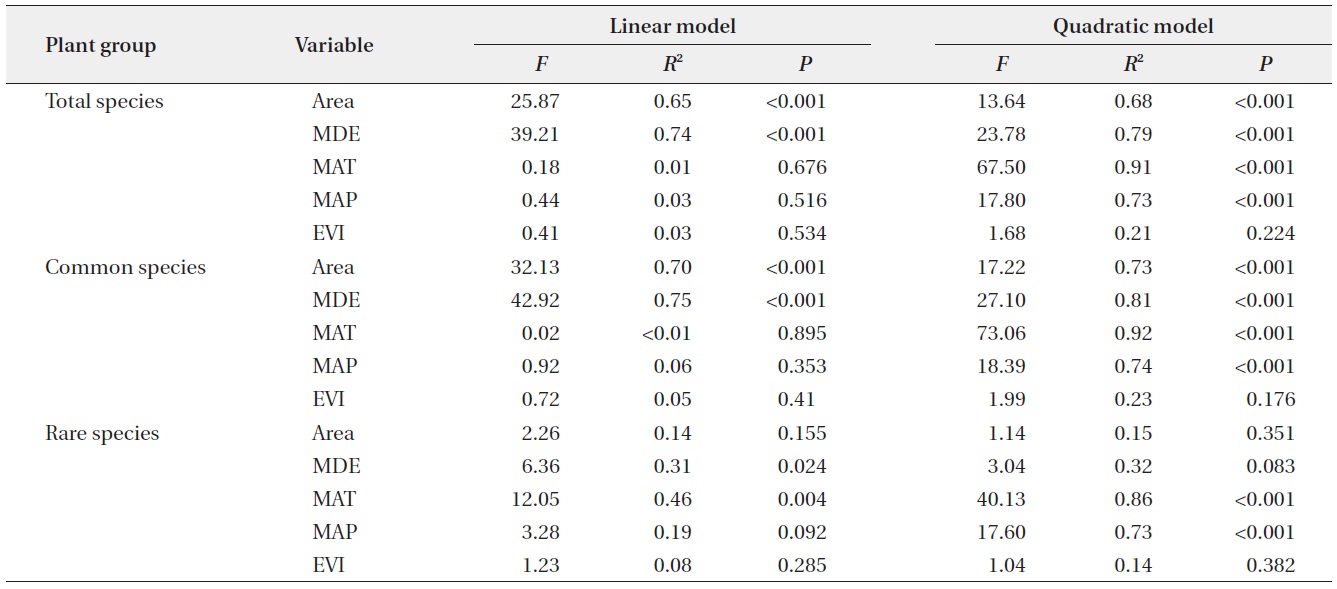
Simple linear regressions showed that total species richness and common species richness were strongly correlated with area and the MDE, whereas rare species richness was correlated with the MDE and MAT (linear model in Table 2). The results for quadratic models differed
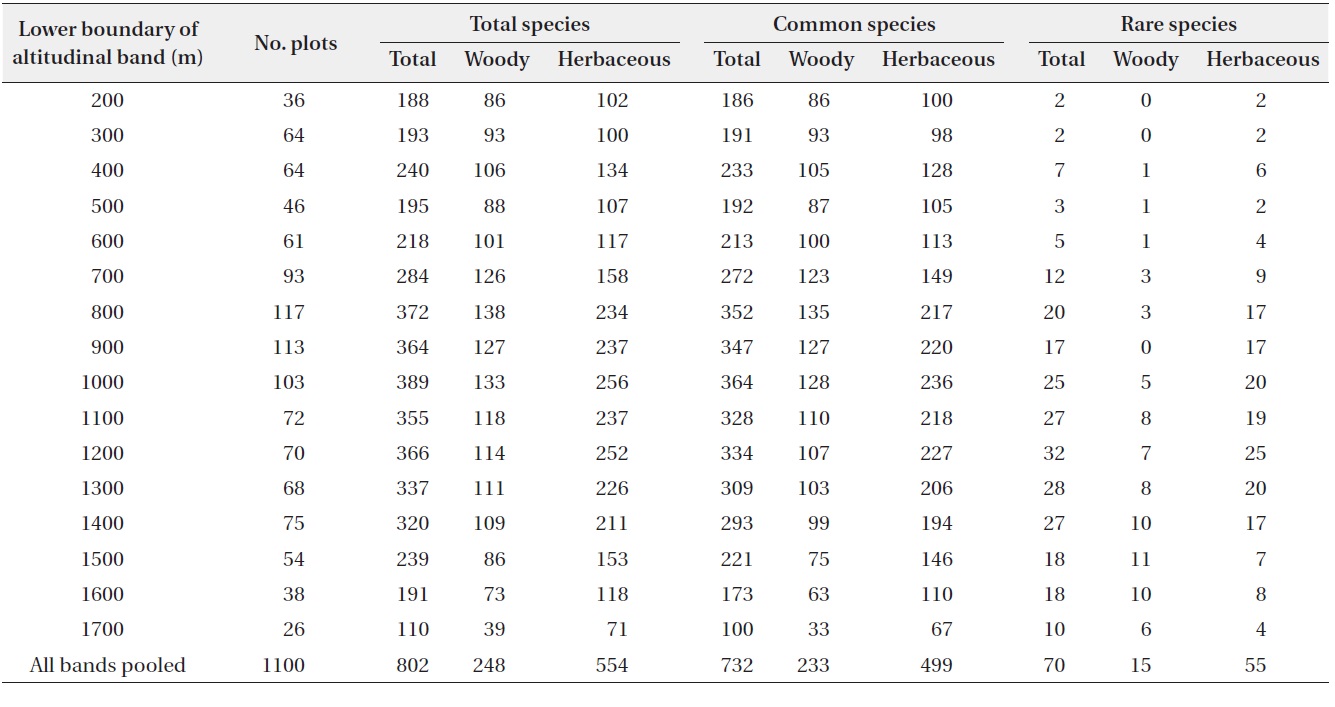
Observed richness among total, common and rare plant species for different altitudinal bands along the ridge of the Baekdudaegan Mountains, South Korea
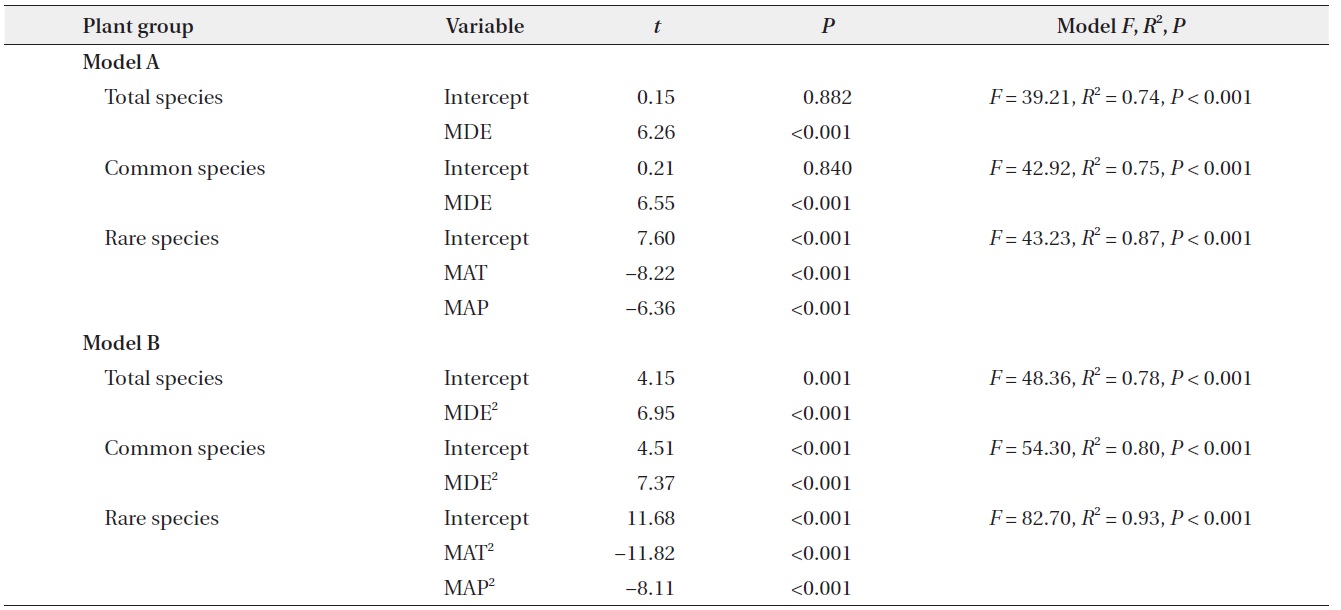
somewhat from those for simple linear models (quadratic model in Table 2) in that climatic variables were also significant predictors for species richness of total and common plants. Considering the multiple regression models, the results for models that included all linear and quadratic terms were similar to those that included only the linear terms (Table 3). The forward stepwise multiple regression models showed that the MDE was the most important predictor of total and common species richness, whereas climatic variables such as MAT and MAP were the most powerful predictors of rare species richness.

Simple linear and quadratic models for explanatory variables and species richness along the ridge of the Baekdudaegan Mountains, South Korea

Forward stepwise multiple regression models for explanatory variables, including all linear and quadratic terms and diversity indices, along the ridge of the Baekdudaegan Mountains, South Korea
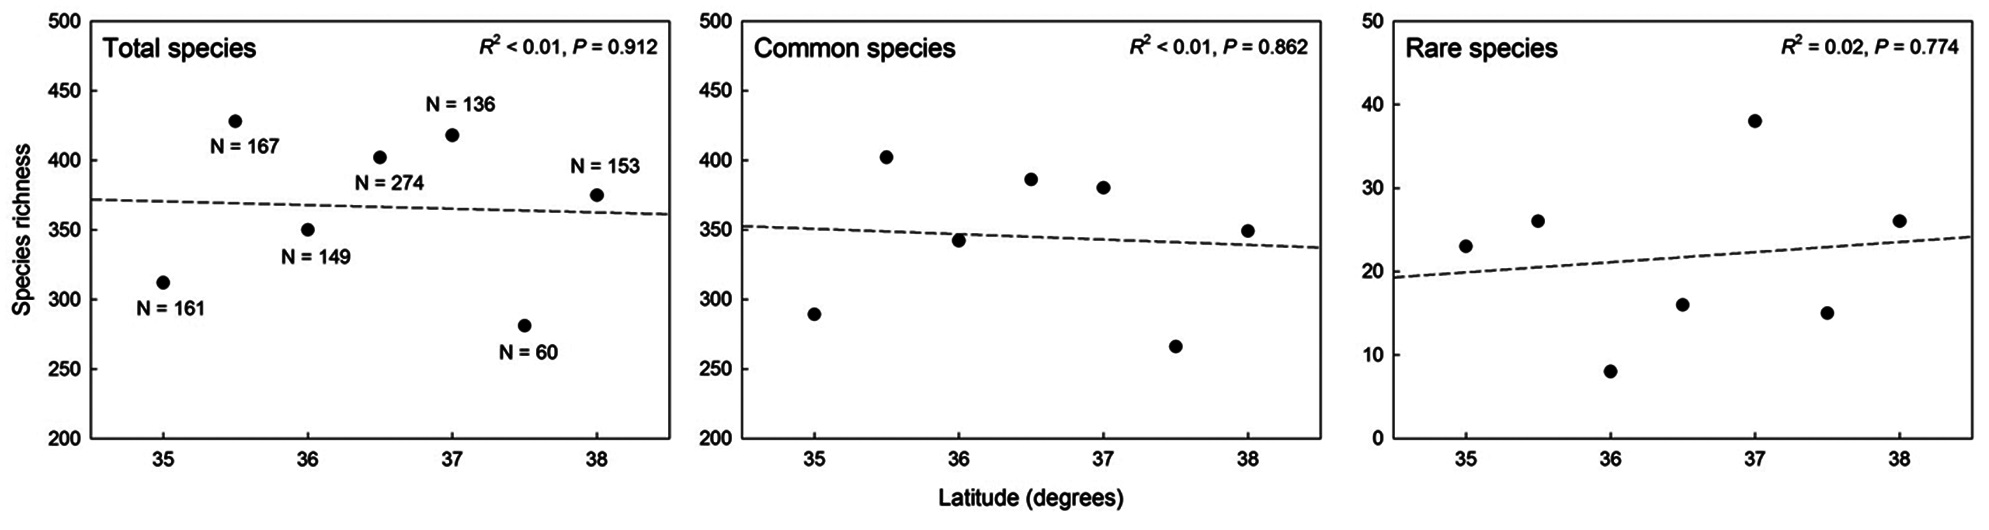
A simple linear regression showed no significant correlation between species richness and latitude for all plant groups (Fig. 5). These analyses do not support the presence of latitudinal effects on plant species richness patterns along the ridge of the Baekdudaegan.
In this study, we examined plant species richness patterns in relation to an altitudinal gradient and explored the underlying causal mechanisms of those patterns using primary data at a regional scale from the ridge of the Baekdudaegan, South Korea. Previous studies that demonstrate the existence of a relationship between altitude and species richness can be classified as representing either local or regional datasets (Romdal and Grytnes 2007). Many previous studies aimed to explain mechanisms at broad regional scales, such as countrywide or continental scales (Jetz and Rahbek 2002, Grau et al. 2007, McCain 2009, Alexander et al. 2011), using secondary distribution data derived from the literature. Studies focused at regional scales cover large areas and large fractions of the total biota as they combine data from numerous sources (Karger et al. 2011). In general, regional-scale studies, including the present study, presume that when examined at broad scales, mountain massifs are bounded with respect to macroecological processes. Therefore, such large-scale studies focus on altitudinal effects and consider that latitudinal effects on species diversity are either insignificant or extremely small (Marini et al. 2011). Indeed, in the current study, plant species richness did not show a significant relationship with latitude for any of the plant groups. This result supports the assumption that latitude is not a significant determinant of plant species richness patterns, at least on the basis of data from the Baekdudaegan ridge. Moreover, most previous analyses of the relationship between species richness and latitude used data from wide latitudinal bands (>10°) and at continental or hemispheric scales (Stevens 1989, Buckley et al. 2003, Cruz et al. 2005).
The cause of altitudinal richness patterns is a controversial topic in ecology and biogeography (Wang et al. 2007). Rahbek (2005) identified three main patterns of altitudinal species richness: (1) a monotonic decline with increasing altitude, (2) a plateau at low altitudes, and (3) a ‘hump-shaped’ distribution with peak richness at intermediate altitudes. The present study showed that species richness in all plant groups peaked at intermediate altitudes along the Baekdudaegan ridge, even though the absolute altitudes of the richness peaks differed somewhat among the three plant groups. At the most general level, the present results contribute to the growing body of evidence that, in mountainous regions, hump-shaped distributions of plant species richness predominate.
Altitudinal richness patterns are considered to reflect an optimal combination of space-related variables, such as area and the MDE (Wang et al. 2007), climatic variables including temperature and precipitation (Bhattarai and Vetaas 2003, Kluge et al. 2006), and productivity (Chalcraft et al. 2004). On the ridge of the Baekdudaegan, we observed that space-related variables (area and the MDE) strongly influence altitudinal patterns of total and common plant species richness as determined by simple linear models, and that climatic variables (MAT and MAP) also contribute significantly to the altitudinal patterns as determined by quadratic models. However, MDE and MAT were significant predictors of rare species richness pattern in simple linear models and only climatic variables contributed significantly to the altitudinal pattern of rare plant species in quadratic models. These results for the linear models were similar to those obtained with multiple regression models. In multiple regression models, the MDE was selected as the most powerful determinant of richness patterns in total and common plant species, whereas climatic variables were selected as the most powerful determinants of rare plant species richness pattern. The relative influence of each of these determinants on species richness may vary among regions and taxa. Below, we discuss how area, the MDE, climatic variables, and productivity may contribute to altitudinal patterns of plant species richness along the ridge of the Baekdudaegan.
The important influence of the MDE on species richness patterns along altitudinal gradients is well documented (Liew et al. 2010, Acharya et al. 2011, Lee et al. 2012). The MDE is a stochastic abiotic hypothesis that is based on the premise that spatial distributions of species richness are constrained by the shapes of geographical domains and by species range sizes. Under these conditions, the random replacement of species ranges within a bounded domain results in overlapping species ranges, with a greater number of overlapping ranges towards the center of the domain than at the margins; thus, higher species richness occurs in the central region of geographical domains than at the periphery (Colwell and Lees 2000). However, we also observed a deviation of diversity distributions from the MDE null hypothesis for all plant groups. Recent work in the eastern Himalayas indicates that tree species richness patterns strongly deviate from those predicted by the MDE null model (Acharya et al. 2011), as do species richness patterns for other plant groups (Kluge et al. 2006, Ah-Peng et al. 2012). The deviations may be caused by the presence of relatively large numbers of species with narrow altitudinal ranges (i.e., those present in only one or two bands); as in the present study, Ah-Peng et al. (2012) recorded a relatively large number of species with a small altitudinal range, which comprised species present in only one or two altitudinal bands. Therefore, we suggest that narrowly distributed species are likely to result in large deviations from the MDE null model for all plant groups. The degree of deviation from the MDE null model may also explain the influence of factors such as ecology, history, and evolution on observed distribution patterns (Acharya et al. 2011).
Area is also an important predictor of total and common plant species richness in both simple linear and quadratic regression models; however, area is a weak predictor of richness patterns in multiple regression models in which the MDE is one of the variables. This result may reflect the strong correlation between the MDE and area (
The present regression analyses indicated that the climatic variables were the most powerful predictors for rare plant species. In general, rare species characteristically have a narrow geographical range and highly restricted habitat preferences compared with common species (Bevill and Louda 1999). Moreover, most rare species on the Baekdudaegan ridge are distributed at higher altitudes than common species (Cho et al. 2004). Indeed, climatic variables are indicated to be more important than space-related variables for range-restricted species such as rare species, whereas space-related variables are more important than climatic variables for wide-ranging species such as common species (Jetz and Rahbek 2002, Brehm et al. 2007, Lee et al. 2013). Although we excluded climatic variables from the simple linear and multiple regression models for total and common plant species richness, climatic variables still might play an important role as determinants of richness patterns for such plant species. Parabolic patterns of species richness in relation to climatic variables are best described using a quadratic function. If climatic variables contribute to observed patterns of total and common plant species richness, optimal ranges of temperature and precipitation are likely to occur at intermediate altitudes, and favorable climatic conditions at intermediate altitudes may lead to higher total and common plant species richness in these areas. Intermediate altitudes may provide optimal combinations of temperature and moisture levels for plant growth, and consequently higher resource availability to support the coexistence of a greater number of species (Kluge et al. 2006).
Remote sensing-based vegetation indices used as surrogates of primary productivity provide evidence for significant productivity?richness relationships, both linear and unimodal, which indicates that productivity estimates can be used to evaluate plant species richness patterns (Rowe 2009), albeit at different spatial scales depending on the taxonomic group under study (Hurlbert and Haskell 2003). However, we found little evidence that productivity (as measured by EVI) influences species richness patterns along the altitudinal gradient on the Baekdudaegan ridge. This finding indicates that the relationship between productivity and plant richness may be more complex than previously thought. Furthermore, poor support in the present study for a productivity?richness relationship questions the energy?diversity hypothesis for vascular plants, at least along the altitudinal gradient on the ridge of the Baekdudaegan. Energy input is indicated to be a strong predictor of richness only in far northern portions of the globe, and precipitation or the interaction between energy input and moisture shapes large-scale worldwide biodiversity patterns (Hawkins et al. 2003). However, the results presented here provide weak support for the productivity?diversity hypothesis and suggest that the relationship between productivity and richness at smaller spatial scales (e.g., that of a mountain range) may be incongruent with that found at larger spatial scales. Furthermore, Adler et al. (2011) intensively reviewed relationships between productivity and species diversity in mountainous areas across the globe and observed that a non-significant relationship is predominant between the two variables.
Although the absolute altitudes of the richness peaks vary among total, common and rare plant species, species richness patterns on the Baekdudaegan ridge show ‘hump-shaped’ patterns for each plant group. Regression analyses show that the MDE and climatic variables are the best predictors of altitudinal patterns of plant species richness on the Baekdudaegan ridge. The MDE is the most important explanatory variable for total and common species richness, whereas climatic variables are significant predictors for rare species richness. Our results are consistent with many previous studies, which indicate that the MDE is more important for wide-ranging species such as common species, whereas climatic variables are better predictors for range-restricted species such as rare species. Latitudinal effects are not supported as a determinant of species richness in the present study. Even though the MDE and climatic variables are the primary predictors in the best simple and multiple regression models, discrimination among these variables may not be possible by simple comparisons of regression coefficients because the MDE and climatic variables are strongly correlated with plant species richness. Altitudinal species richness patterns can be influenced by a number of climatic, spatial, and historical variables (Rahbek 2005, Acharya et al. 2011, Lee et al. 2013). In the present study, we examined the relationships between major explanatory variables and altitudinal patterns of plant species richness. However, we did not consider evolutionary or historical variables in our analysis. Further study into the influence of evolutionary history, including historical contingencies and niche conservatism, with spatial, climatic, and energy-related variables may provide insights into the factors that determine the altitudinal distribution of plant communities at macroecological scales.