Small reservoirs are important for use as agricultural water supplies, flood control and power generation in many areas throughout the east-Asia monsoon region. These reservoirs provide opportunities for comparative studies of patterns and processes in small lake ecosystems in a variety of climatic and landscape settings. Perhaps the most distinctive characteristic in the typical seasonal pattern in lakes and reservoirs in Korea is the input of large amounts of allochthonous nutrients and organic matter during the summer monsoon (Lee et al. 2013). In Korea, monsoon rainfall can occur from July to September, with the other seasons generally being much drier. During intense monsoon rain events, the nutrient and organic matter inputs to reservoirs from watersheds increases dramatically with increases in stream discharge. The input of large amounts of allochthonous nutrients and organic matter can greatly impact the biology and chemistry of reservoirs, even for a substantial period following the summer monsoon (here referred to as postmonsoon) (Kim et al. 2000, Li et al. 2008, Lee et al. 2013). The elevated inputs of nutrients and organic matter often results in post-monsoon cyanobacteria blooms (especially
In general, phytoplankton is a preferred food source for zooplankton, but zooplankton may not be able to directly use only phytoplankton as a food source because some cyanobacteria are inedible and the elevated POM concentration likely results from the increase in input of terrestrial organic matter during the monsoon season (Lee et al. 2013, De Kluijver et al. 2012). Some cyanobacteria can be unsuitable as a food source for herbivorous zooplankton and inhibit not only feeding ability but also zooplankton growth (Chen et al. 2005).
Seasonal changes in the zooplankton community in some temperate lakes are associated with increases in
The zooplankton community regulates energy flow from producers to upper trophic levels in lake ecosystems (Jeppesen et al. 2003, Hessen 2008, Santana et al. 2009). Analysis of zooplankton stable isotope composition can be useful because zooplankton have short turnover times and respond rapidly to environmental changes (Browne 1981, Schindler et al. 1997).
Using carbon stable isotopes to follow the flow of carbon in food webs has two advantages over other methods. First, the ratio of 13C and 12C in a consumer’s tissue reflects relatively long-term diet because stable isotopes effectively integrate the consumer’s feeding history. Second, consumer tissue stable isotope composition reflect only materials actually assimilated and incorporated into tissue, as opposed to the total material ingested, as long as the gut contents are removed before analysis.
In this study, we compared zooplankton and POM δ13C values with DOC concentration in five reservoirs which are impacted by the elevated loads of nutrients and organic matter received during the summer monsoon season in Korea. In reservoirs with large inputs of nutrients and organic matter during summer monsoon storms, zooplankton δ13C values are likely most closely controlled by selective zooplankton grazing in the post-monsoon season (Kankaala et al. 2010, De Kluijver et al. 2012). The reservoirs selected for this study commonly experience cyanobacteria blooms following the monsoon season (post-monsoon). The objective of this study was to investigate the differences in zooplankton δ13C and POM δ13C values and the relationship between zooplankton δ13C values and DOC concentration among five reservoirs with different proportions of agricultural land use in their watersheds.
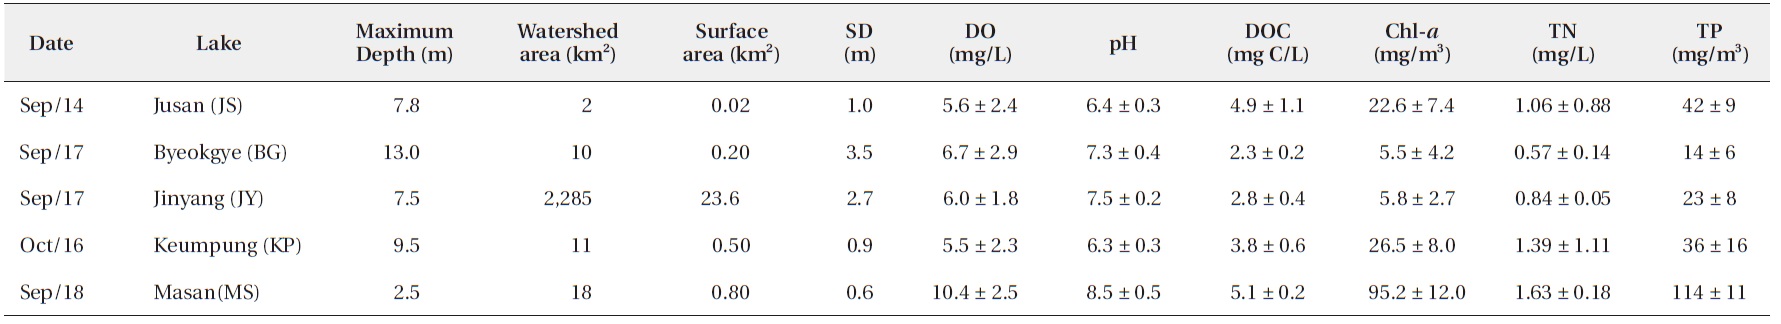
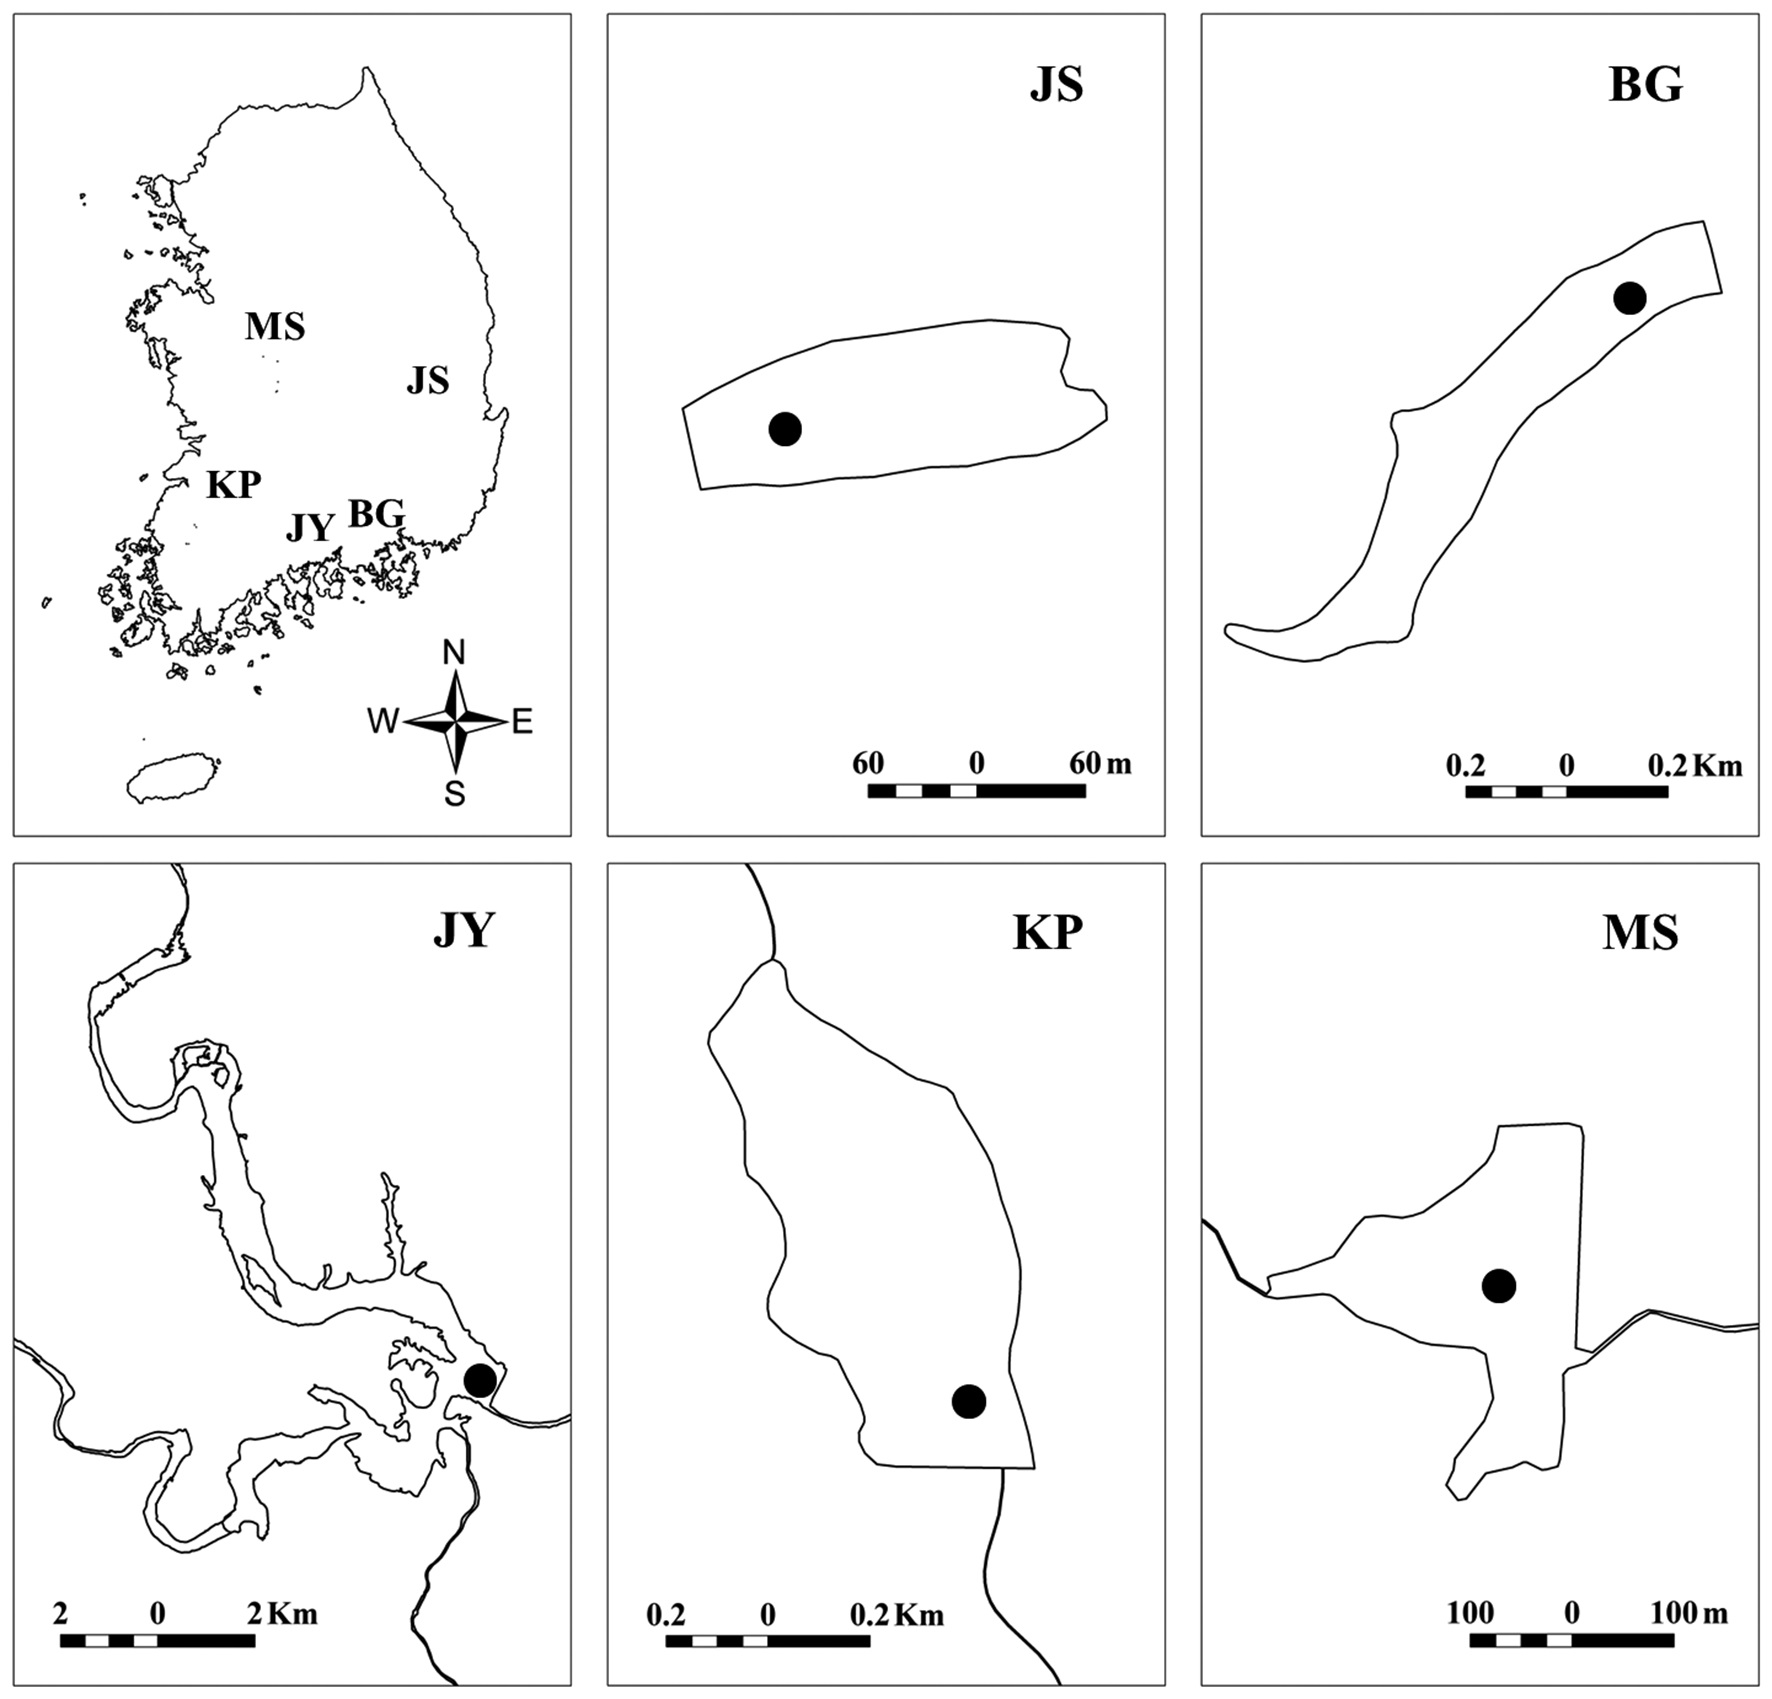
We surveyed five reservoirs, including oligo-mesotrophic (BG, Byeokgye; JY, Jinyang; KP, Keumpung) and eutrophic reservoirs (JS, Jusan; MS, Masan) (Fig. 1). The reservoirs are largely (greater than 70%) surrounded by hardwood forest except for MS (Table 1). MS is located in an agricultural area. The watershed of JS is mostly forested, without major anthropogenic activity. MS has about 42% of the total watershed as forest land, compared with the other watersheds having <20% of their watershed area used for agriculture (Table 1).
Water samples for nutrient analysis were collected at the surface (0.1 m depth) during the post-monsoon season (September through October 2009). At each site, the following water quality parameters were measured in situ: pH meter (Denver Instrument Company, Arvada, CO, USA), YSI 55 dissolved oxygen meter (YSI Inc., Yellow Springs, OH, USA), and 2100P turbidimeter (Hach Co., Ames, IA, USA). Dissolved organic carbon (DOC), total
phosphorus (TP) and total nitrogen (TN) concentrations were measured in the laboratory on unfiltered samples. Samples for determination of TP and TN concentrations were acidified with 18N H2SO4 and refrigerated until analysis. TP concentration was measured using the ascorbic acid method according to APHA (1998). TN concentration was measured by cadmium reduction after digestion with persulfate (APHA, 1998). DOC concentrations were measured using a TOC-5000A analyzer (Shimadzu, Kyoto, Japan). Chlorophyll-
[Table 1.] Location and land use in the watersheds of study reservoirs

Location and land use in the watersheds of study reservoirs
after extraction with 90% acetone on GF/F filters (Whatman, Kent, UK).
Samples for zooplankton analysis were collected near the center of each reservoir using a net for a Schindler- Patalas trap with a 63μm Nitex mesh (Wildco, Yulee, FL, USA) for zooplankton. A separate sample was collected for phytoplankton analysis using a Van Dorn sampler (Wildco) at the surface (0.1 m). To separate zooplankton from suspended particulate matter, samples were kept refrigerated and separated by gravity in a 3 L cylinder for 12 hours and filtered using a 200 μm mesh sieve and a distilled water rinse.
POM samples were collected using a Van Dorn sampler at discrete depths. Samples were pre-filtered through a 45 μm mesh net to remove zooplankton and then filtered using pre-combusted (450℃) GF/F filters. Phytoplankton samples were concentrated in the field using the plankton net with a 63 μm mesh (Wildco). The bulk phytoplankton which settled to the bottom of a cylinder was separated from suspended particulate organic matter and zooplankton with 200 μm and 45 μm mesh nets. Samples for stable isotope analysis were freeze dried and pulverized with a mill. Sediment samples were fumigated in desiccator (1 N HCl) for 4 hours and dried at 45 ℃ to remove inorganic carbon.
Carbon stable isotope composition was analyzed using an Isoprime (GV Instruments) Isotope Ratio Mass Spectrometer (IRMS) coupled with an Elementar Vario EL Cube Elemental Analyzer (EA) (Isoprime Ltd., Cheadle, UK). The stable isotope results are presented as the difference between the sample and an international standard (VPDB, Vienna Pee Dee Belemnite): X (‰) = [Rsample/Rstandard - 1] × 103, where X is the parts per thousand (‰) difference from a standard. R is the ratio of heavy (13C) to light isotope (12C). The precision for repeated sample measurement was better than ±0.3‰.
SigmaPlot ver. 11.0 (Systat Software Inc., San Jose, CA, USA) was used for statistical analyses. Regression analysis was used to test the relationships between DOC and isotopic composition of POM and zooplankton.
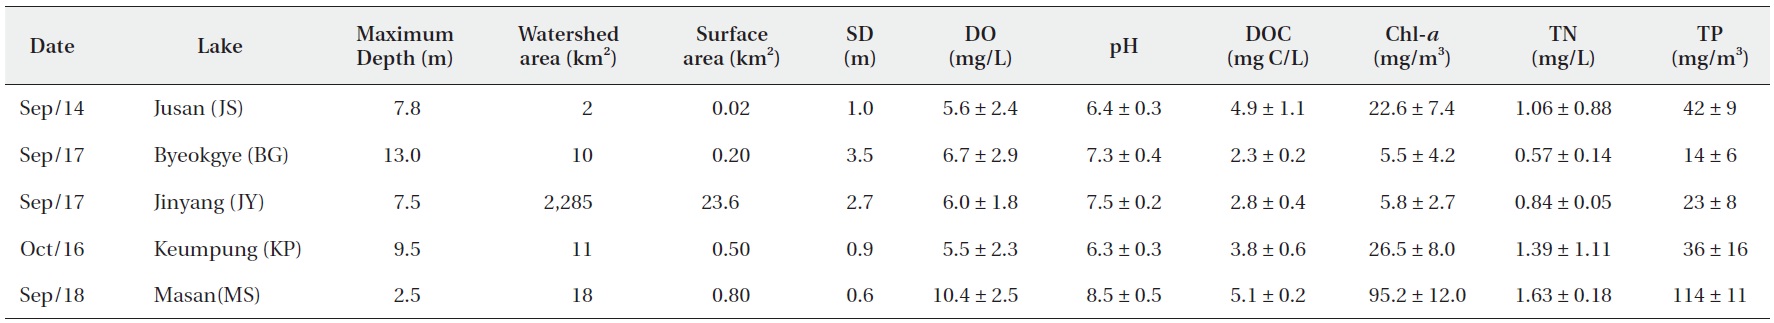
The surface water pH of the study reservoirs ranged from 6.0 to 9.1 and DO concentrations ranged from 2.2 mg/L to 14.3 mg/L (Table 2). The range of surface water pH in KP and JS (pH 6.0-6.7) was slightly lower than in the other reservoirs (pH 6.8-9.1). These two reservoirs also had the low DO concentrations (2.2-8.5 mg/L). DOC concentrations varied from 2.2 mg C/L to 5.2 mg C/L, with JS and MS having the high DOC concentrations (Table 2).
The Chl-
>
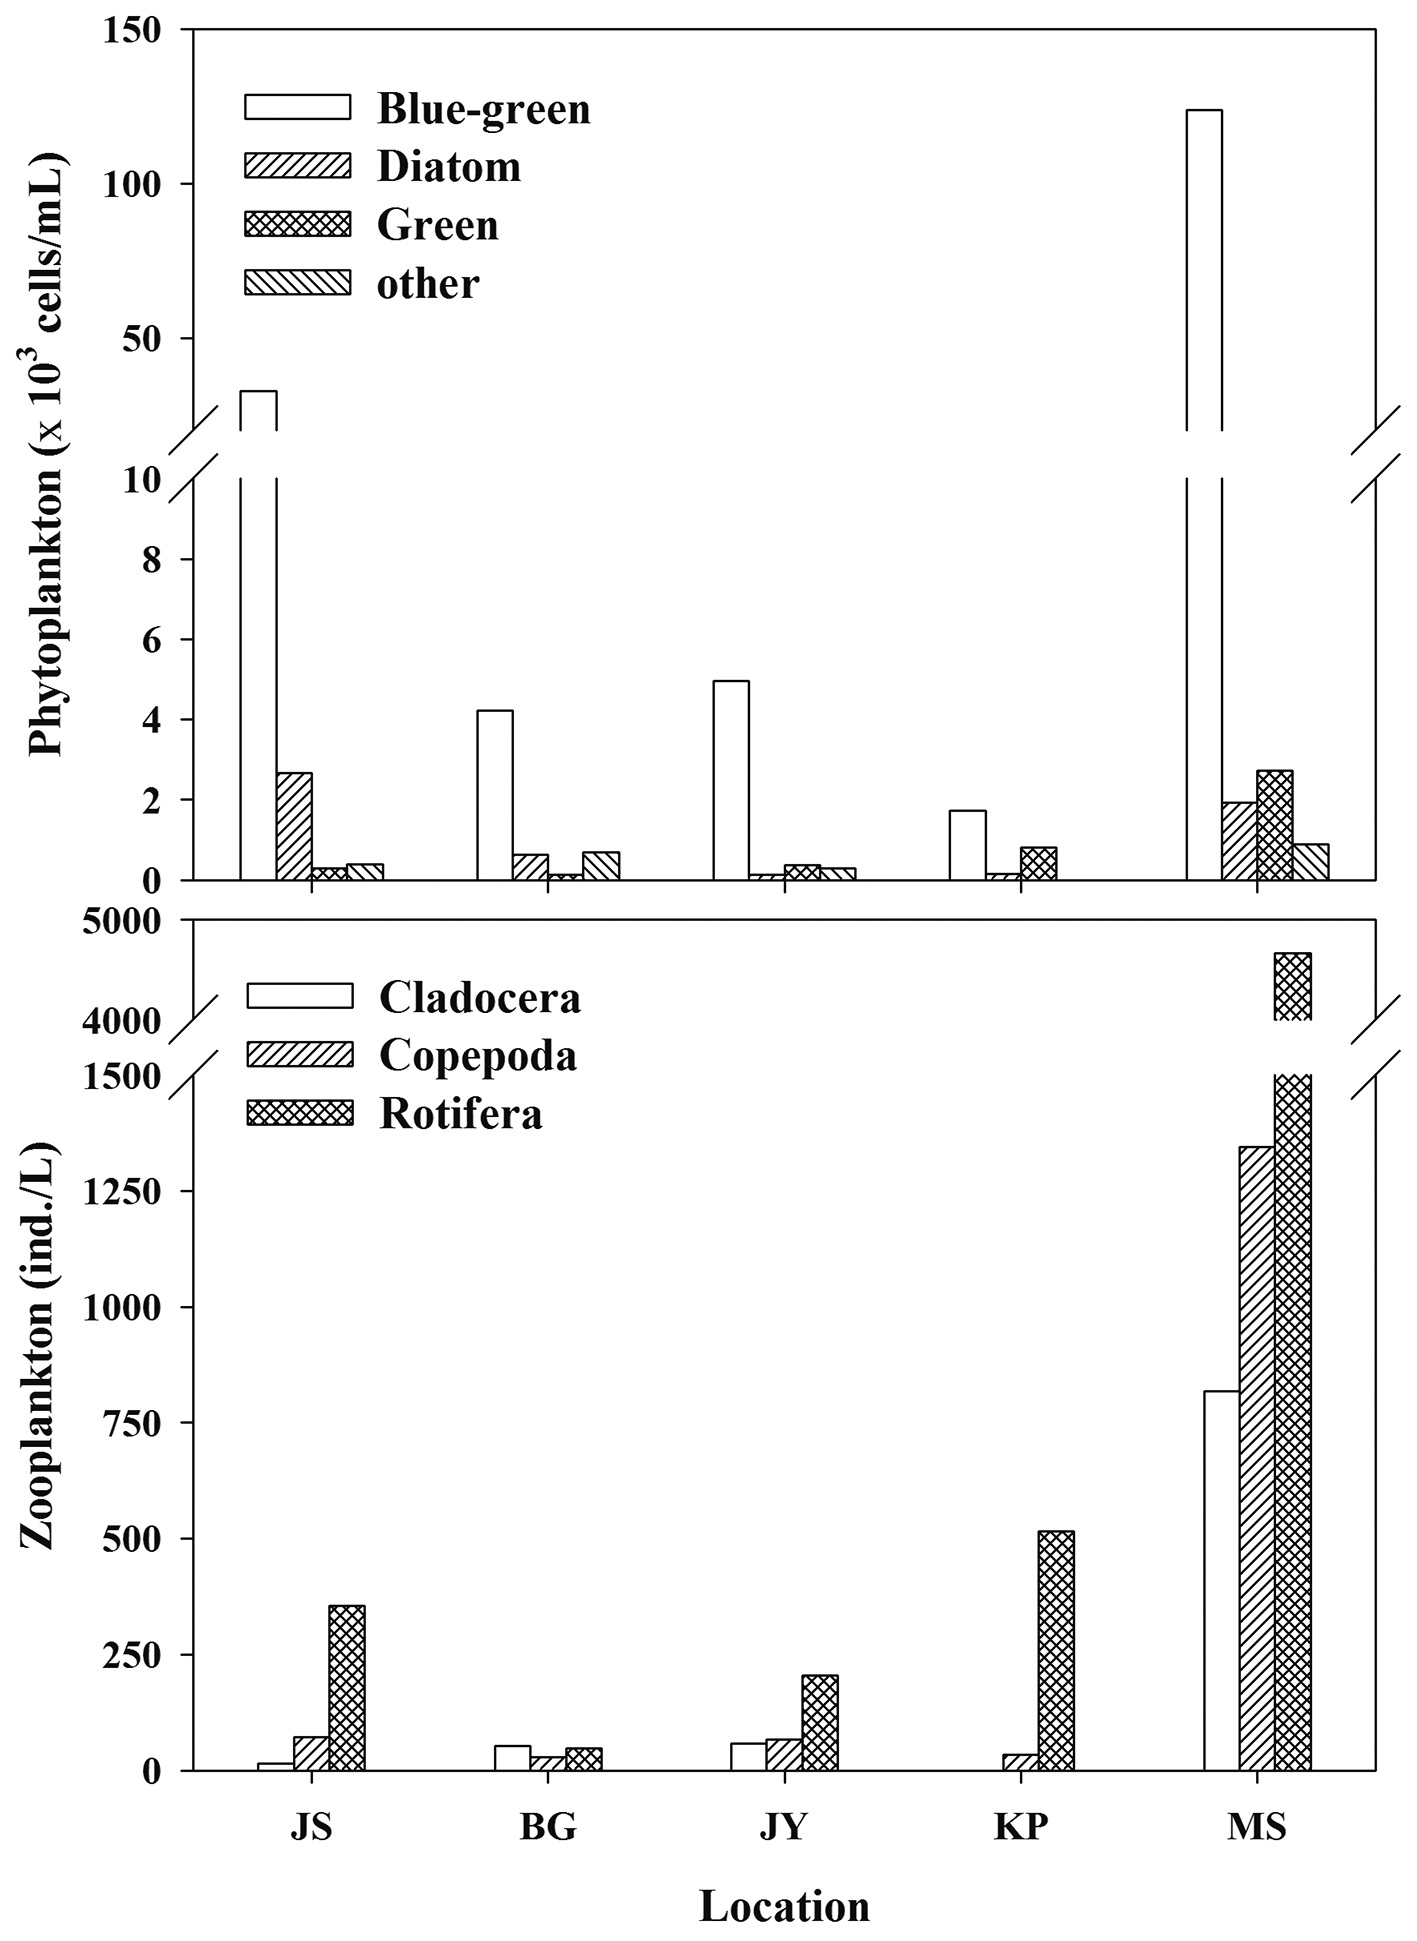
Zooplankton and phytoplankton communities
Zooplankton and phytoplankton density was mainly composed of rotifera and blue-green algae (cyanobacteria), respectively (Fig. 2) in all reservoirs. The dominant zooplankton species in JS, BG, and KP were the copepods (

Water chemistry of the study reservoirs (SD, Secchi disc transparency; DO, dissolved oxygen; DOC, dissolved organic carbon; Chl-a, chlorophyll a; TN, total nitrogen; TP, total phosphorus concentration)
>
Relationship of zooplankton δ13C and POM δ13C among reservoirs
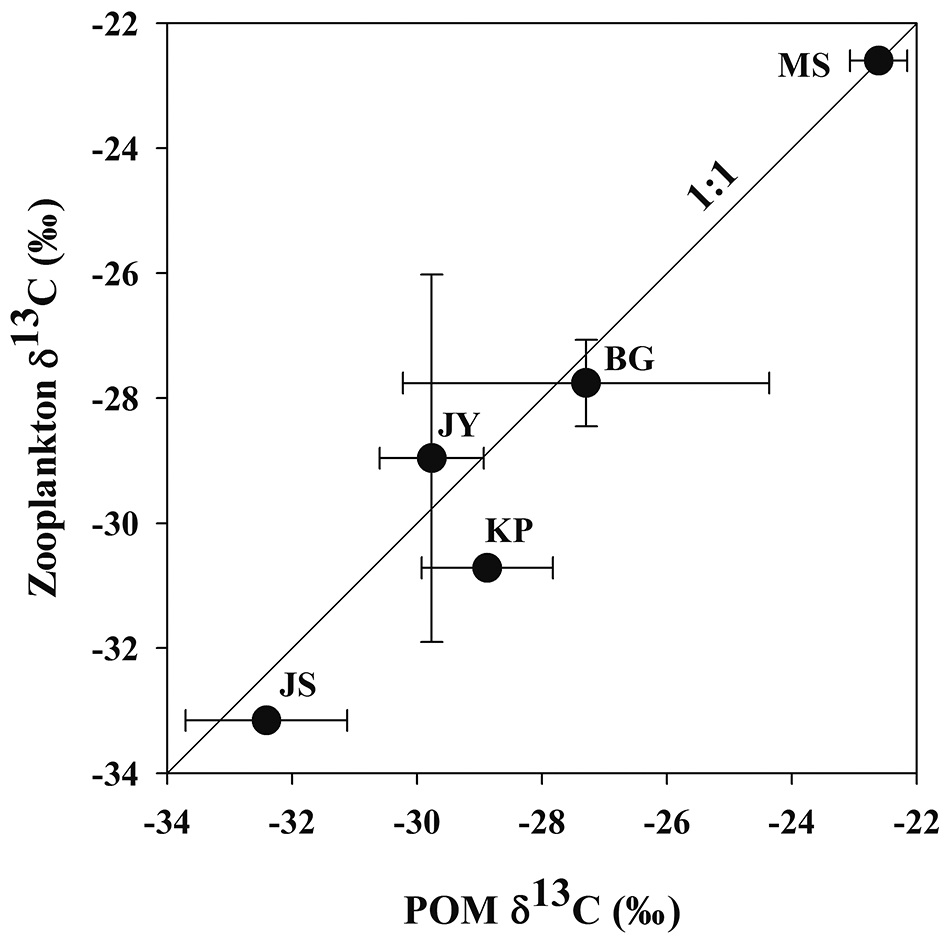
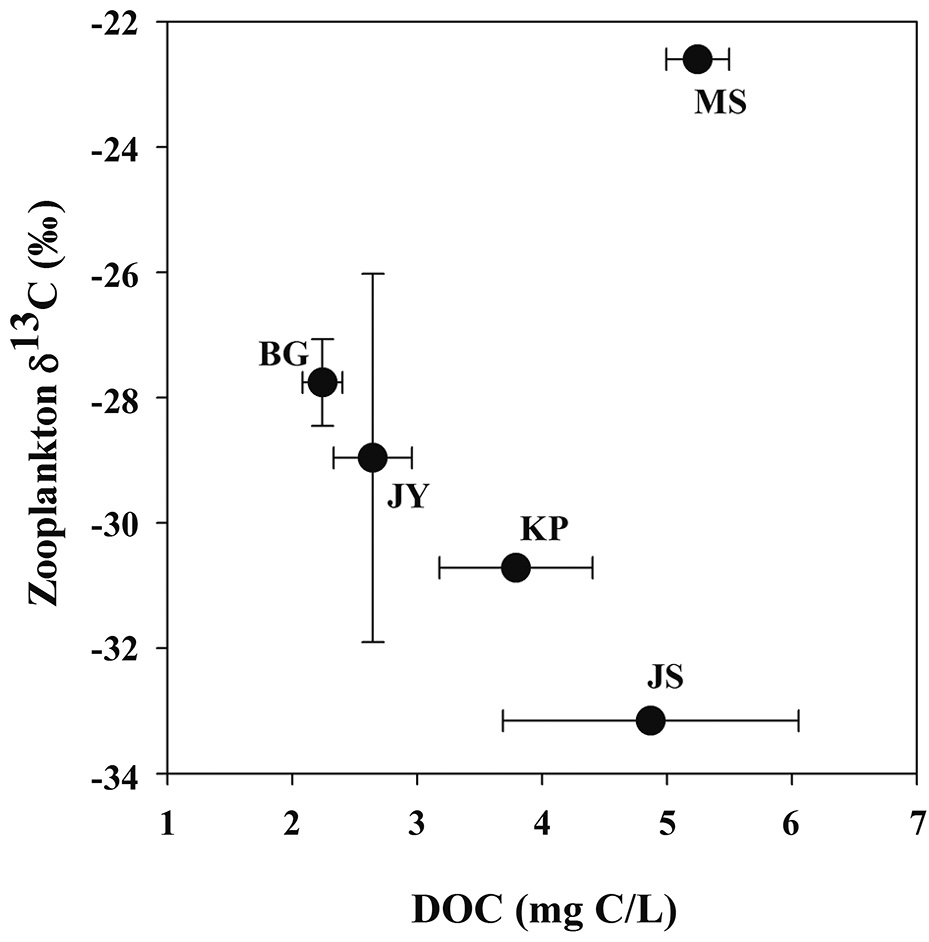
Zooplankton δ13C values and POM δ13C values ranged from -33.2‰ to -22.6‰, from -32.4‰ to -22.6‰, respectively (Fig. 3). There was a positive relationship between zooplankton δ13C values and POM δ13C values (Fig. 3). For the four reservoirs with relatively higher proportion of forested land use (BG, JY, JS and KP), zooplankton δ13C values were negatively related to DOC concentration. Zooplankton δ13C values differed between MS and JS despite having similar DOC concentrations (Fig. 4).
>
Relationship between zooplankton δ13C and POM δ13C
This general difference we found in zooplankton δ13C values is similar to the results of previous studies showing higher zooplankton δ13C values in reservoirs affected by agricultural inputs than in reservoirs surrounded by forested land (Gu et al. 1994, Yoshioka et al. 1994). Zooplankton δ13C values were significantly higher in MS with the major land use as agricultural land than in the other reservoirs with mostly forested land use (Figs. 2 and 3). Bacterial utilization of allochthonous organic matter derived from the watershed introduces a carbon source for zooplankton production, which may replace carbon sources such as phytoplankton production as a carbon source for zooplankton in reservoirs with forested land use (Salonen and Hammar 1986). Jones et al. (1999) reported that zooplankton δ13C showed a significant trend towards greater 13C enrichment with increasing Chl-
Our findings support the idea that zooplankton δ13C values are useful indicators of food source and watershed land use (Del Giorgio and France 1996, Jones et al. 1999). Studies from other regions provide examples of the relationship between the stable isotopic composition of lake and reservoir biota and trophic conditions. For example, in several subarctic lakes, zooplankton δ13C values were lower than in urban eutrophic lakes (Rautio and Vincent 2007).
In our study, zooplankton δ13C values and POM δ13C values were positively correlated (Fig. 3). The difference between zooplankton δ13C values and POM δ13C values in the five reservoirs was small, indicating that zooplanktons directly utilize POM as a food source. Hou et al. (2013) investigated the relationship between zooplankton δ13C values and POM δ13C values in eighteen lakes in China and found a positive correlation, also indicating the dependence of zooplankton on POM in their diet.
The phytoplankton community in our study reservoirs is dominated by blue-green algae (cyanobacteria) (Fig. 2). If inedible cyanobacteria are dominant in the phytoplankton community, then zooplankton need to selectively graze for other edible food sources. During cyanobacteria blooms, POM δ13C values may be higher than other phytoplankton δ13C values (Vuorio et al. 2006). Lee et al. (2010) showed that after an increase in
The lower zooplankton δ13C values compared to food sources such as bulk POM in these reservoirs is similar to the pattern found for lakes worldwide and reflects the importance of allochthonous inputs (Del Giorgio and France 1996, Grey et al. 2000). Some studies have indicated that the relative depletion in 13C of pelagic consumers compared to their POM as food source in lake ecosystems reflects the food selectivity of zooplankton for phytoplankton rather than the bulk POM, which has higher δ13C values due to the presence of terrestrial detritus (Del Girogio and France 1996, France et al. 1997). Most allochthonous organic matter is more refractory compared to autochthonously produced POM (Tranvik 1989).
In our study, the values of zooplankton δ13C and POM δ13C values between two reservoirs, MS and JS clearly showed different patterns (Fig. 3). This pattern is similar to the results from Jones et al. (1999) showing that zooplankton δ13C values differed with the trophic conditions of the lakes they studied.
In reservoir JS, we found that zooplankton δ13C values and POM δ13C values were low even though Chl-
In general, a high rate of CO2 uptake by primary producers will result in an increase in pH and a switch in inorganic C speciation from aqueous carbon dioxide, as a dissolved gas (CO2(aq)) to HCO3- (Gu et al. 2006). Uptake of respired CO2(aq) will cause phytoplankton δ13C values to become isotopically depleted in 13C (lower phytoplankton δ13C values) compared to it of phytoplankton using inorganic carbon which has not been previously assimilated (Keough et al. 1996, Lee et al. 2011). Rautio and Vincent (2007) showed that regional differences in POM δ13C values could be also explained by pH, with primary producer δ13C values showing higher values in lakes with high alkalinity and pH than in others. This mechanism could provide a clue for the low zooplankton δ13C values in reservoir JS in our study.
Our finding that zooplankton δ13C values are negatively related to DOC concentration agrees with results of other studies in humic lakes. Zooplankton δ13C values decrease with increasing DOC concentration and increase with increasing productivity and phytoplankton biomass (France et al. 1997, Lennon et al. 2006). Li (2007) also showed that zooplankton δ13C values decreased with increasing DOC concentration. This is explained by zooplankton utilization of 13C-depleted food sources such as methanotrophic bacteria, and therefore, less consumption of phytoplankton and/or POM with higher δ13C values. Methanotrophic bacteria can be an important carbon source for filter feeders feeding zooplankton in agricultural reservoirs (Cry 1998). However, in our study, copepods dominated in four agricultural reservoirs, though not in Lake Masan (MS), and utilized preferable particulate organic matter (e.g., phytoplankton).
Some of the methane is oxidized to CO2 at the metalimnetic oxic-anoxic interface and is partly incorporated into microbial biomass. Phytoplankton can utilize inorganic carbon derived from methanotrophic bacteria, with lower δ13C values (as mentioned above). Allochthonous inputs of POM and DOC to reservoirs can be mineralized and affect zooplankton δ13C values through the food web. In our study reservoirs, MS, unlike the other reservoirs, is most likely to have a high proportion of DOC derived from autochthonous sources (phytoplankton production).
In our study of five agricultural reservoirs (JS, BG, JY, KP and MS), zooplankton δ13C showed large variation from -33‰ to -22‰. One eutrophic reservoir, Lake Masan, had a pattern different from the other reservoirs, showing that zooplankton δ13C decreased with increasing DOC concentration. With this exception, the results of this study are consistent with results of other studies showing an inverse relationship between zooplankton δ13C values and DOC concentrations (France et al. 1997, Jones et al. 1999, Lennon et al. 2006, Persaud et al. 2009). In this study, the difference in zooplankton δ13C values between Lake Jusan and Lake Masan is most likely caused by differences in sources of organic matter related to the difference in the land use in the watershed (Jones et al. 1999). Future studies on reservoirs in Korea should further investigate carbon sources and elemental stoichiometry together with stable isotope techniques to understand the relationships between watershed characteristics and trophic conditions.