Traditionally, graphite has been the base material for a lot of crucible work, and metallic nuclear fuels, such as the U-Zr/U-TRU-Zr alloy system used in, or proposed, for sodium cooled fast reactors (SFR), have been melted and cast in graphite crucibles. However, owing to the high chemical reactivity of uranium, a slurry-coated graphite crucible or slurry-coated quartz mold has been used to prevent contact with the uranium [1]. The application of these coating methods in a hot cell environment is laborintensive as well as operator dependent, and can introduce additional waste streams. Also, melt/coating interactions and porous coatings can be a source of melt contamination and fuel losses, respectively. Furthermore, slurry-applied coatings must be recoated after every batch.
For this research, ceramic materials formed using a thermal praying method were selected as protective coatings, which do not react with the dissolving uranium. Plasmasprayed coating is consolidated through the process of the bonding and densification of materials by applying heat from plasma [2], producing a denser, harder coating. Therefore, it makes the penetration of metallic fuel melt through the coating layer more difficult than in a porous coating, and provides a protective coating that can withstand multiple process cycles. The atomic or electronic structure of the metal is an important factor that affects the reactivity of the liquid metal in contact with the ceramic material. In this research, TaC, TiC, ZrC, ZrO2, and Y2O3 were selected through a literature search as promising candidate coating materials to prevent chemical reactions and the formation of reaction phases [3-4]. These materials have been used as coatings in thermal barrier, high-reflectivity, and electronic device applications [5-9]. Nb was selected as a substrate because of its refractory nature since the coefficient of thermal expansion (CTE) is similar to that of many of the candidate materials.
In this study, the coating microstructure of plasmasprayed materials was characterized and thermal cycling tests were performed to investigate the effect of repeated heating and cooling [10-11] on the contact state of the interface between the coating layer and niobium substrate. Interaction studies were also carried out at an elevated temperature in a U-Zr fuel melt to investigate the refractory of the coating materials.
The material used for the coating substrate was 99.8% pure niobium. The candidate coating materials, TaC, TiC, ZrC, ZrO2, and Y2O3 in powder form, ranging from 10 μm to 50 μm in size, were plasma-sprayed onto the niobium substrate. Table 1 and Table 2 show the plasma-spraying parameters and powder properties. Before the coating process, Al2O3 powder with a #60 mesh size was blasted onto the Nb substrate to increase the adhesiveness of the plasma-sprayed coating materials [12]. The thickness of the coatings on the substrate was controlled by the number of coating layers to the substrate, with a torch input power of about 15kW, and a plasma gas of argon and helium. The higher melting point materials, TaC, TiC and ZrC, required a higher helium input as opposed to Y2O3 and ZrO2.
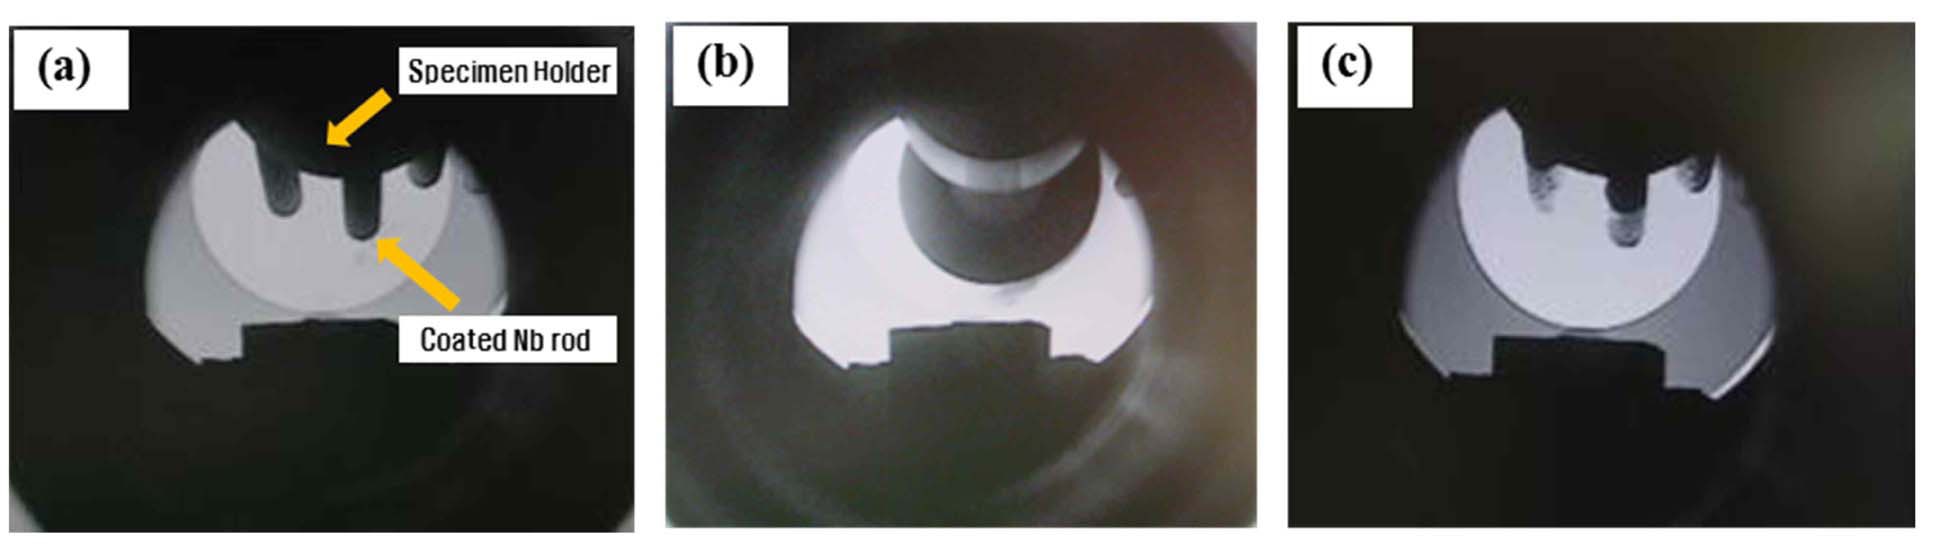
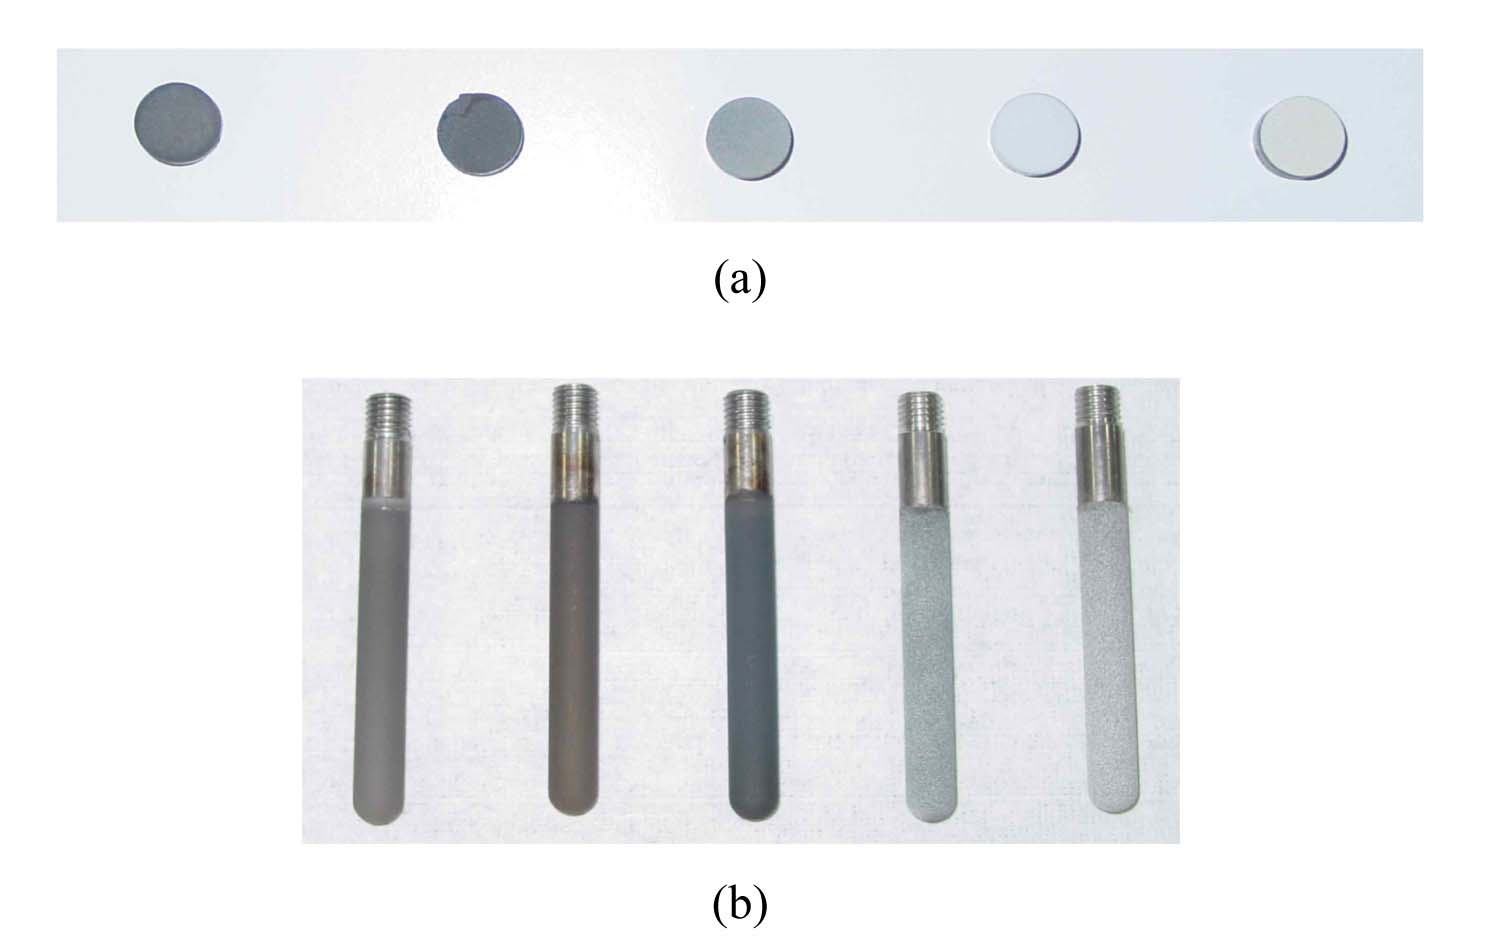
Fig. 1 shows plasma-coated niobium discs for the thermal cycling test, and rods for the fuel melt dipping test, sprayed with TaC, TiC, ZrC, ZrO2, and Y2O3. The disc samples were fixed to a graphite plate using a Y2O3 slurry coating and thermal cycling test consisting of heating of the specimens to 1450℃ at a rate of 20℃/min and holding at a temperature for 30 min, followed by furnace cooling to near-room temperature. Coating/melt interaction studies were performed by immersing the coated rods into a U-10wt.%Zr alloy melt. Fig. 2 shows the dipping test of ceramic-coated rods in U-Zr melt in an induction-melting
[Table 1.] Plasma Spray Coating Parameters and Powder Properties
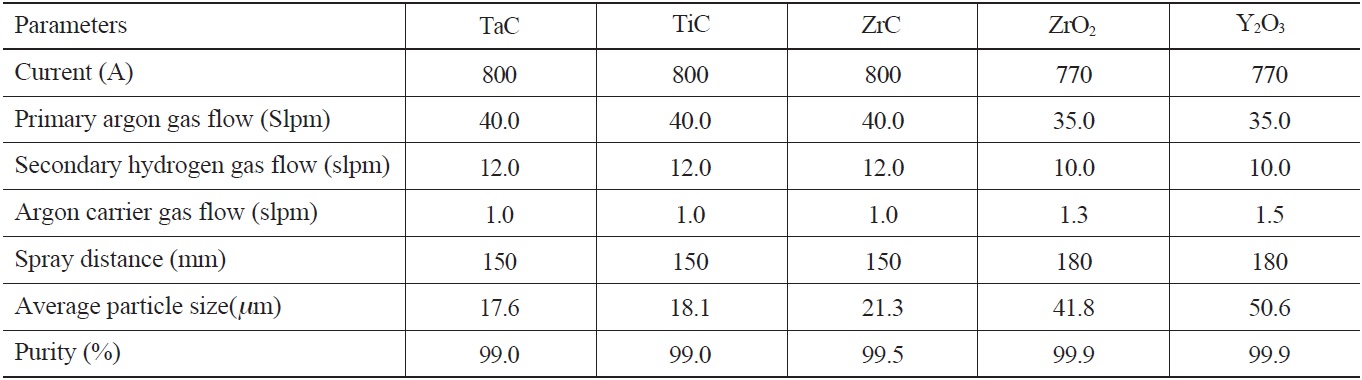
Plasma Spray Coating Parameters and Powder Properties
[Table 2.] Particle Size Distribution (%)
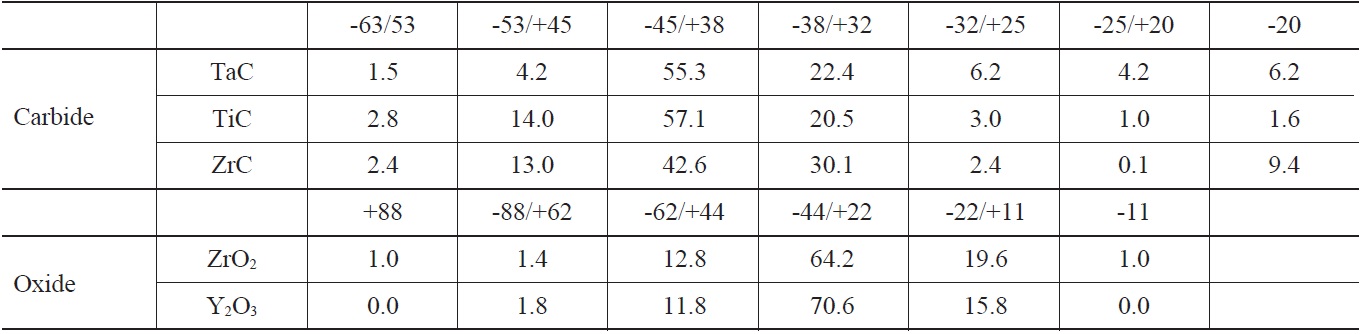
Particle Size Distribution (%)
furnace. Uranium alloy was melted by induction heating at a frequency of 3kHz and a maximum power of 30kW in a Y2O3-slurry coated graphite crucible under a vacuum. To ensure the homogeneity of the melt alloy, the melt was stirred electromagnetically by applying induction heating power cycle from 0% to 100% [13,14-15]. The samples were lowered into the fuel melt at 1600℃ for 5 and 15 min., and withdrawn and cooled outside the crucible in the vacuum atmosphere of the induction furnace. To provide
comparable results, TiC, ZrC, ZrO2, and Y2O3 coated rods were performed together in the same sample holder. After the dipping test, the Nb rods were cut into slices of suitable thickness using a slow-speed SiC abrasive cut-off wheel for the metallographic analyses. The cross-sectional morphology and reaction layer of the degraded coatings were observed using a scanning electron microscope (SEM) with energy dispersive X-ray spectroscopy (EDS).
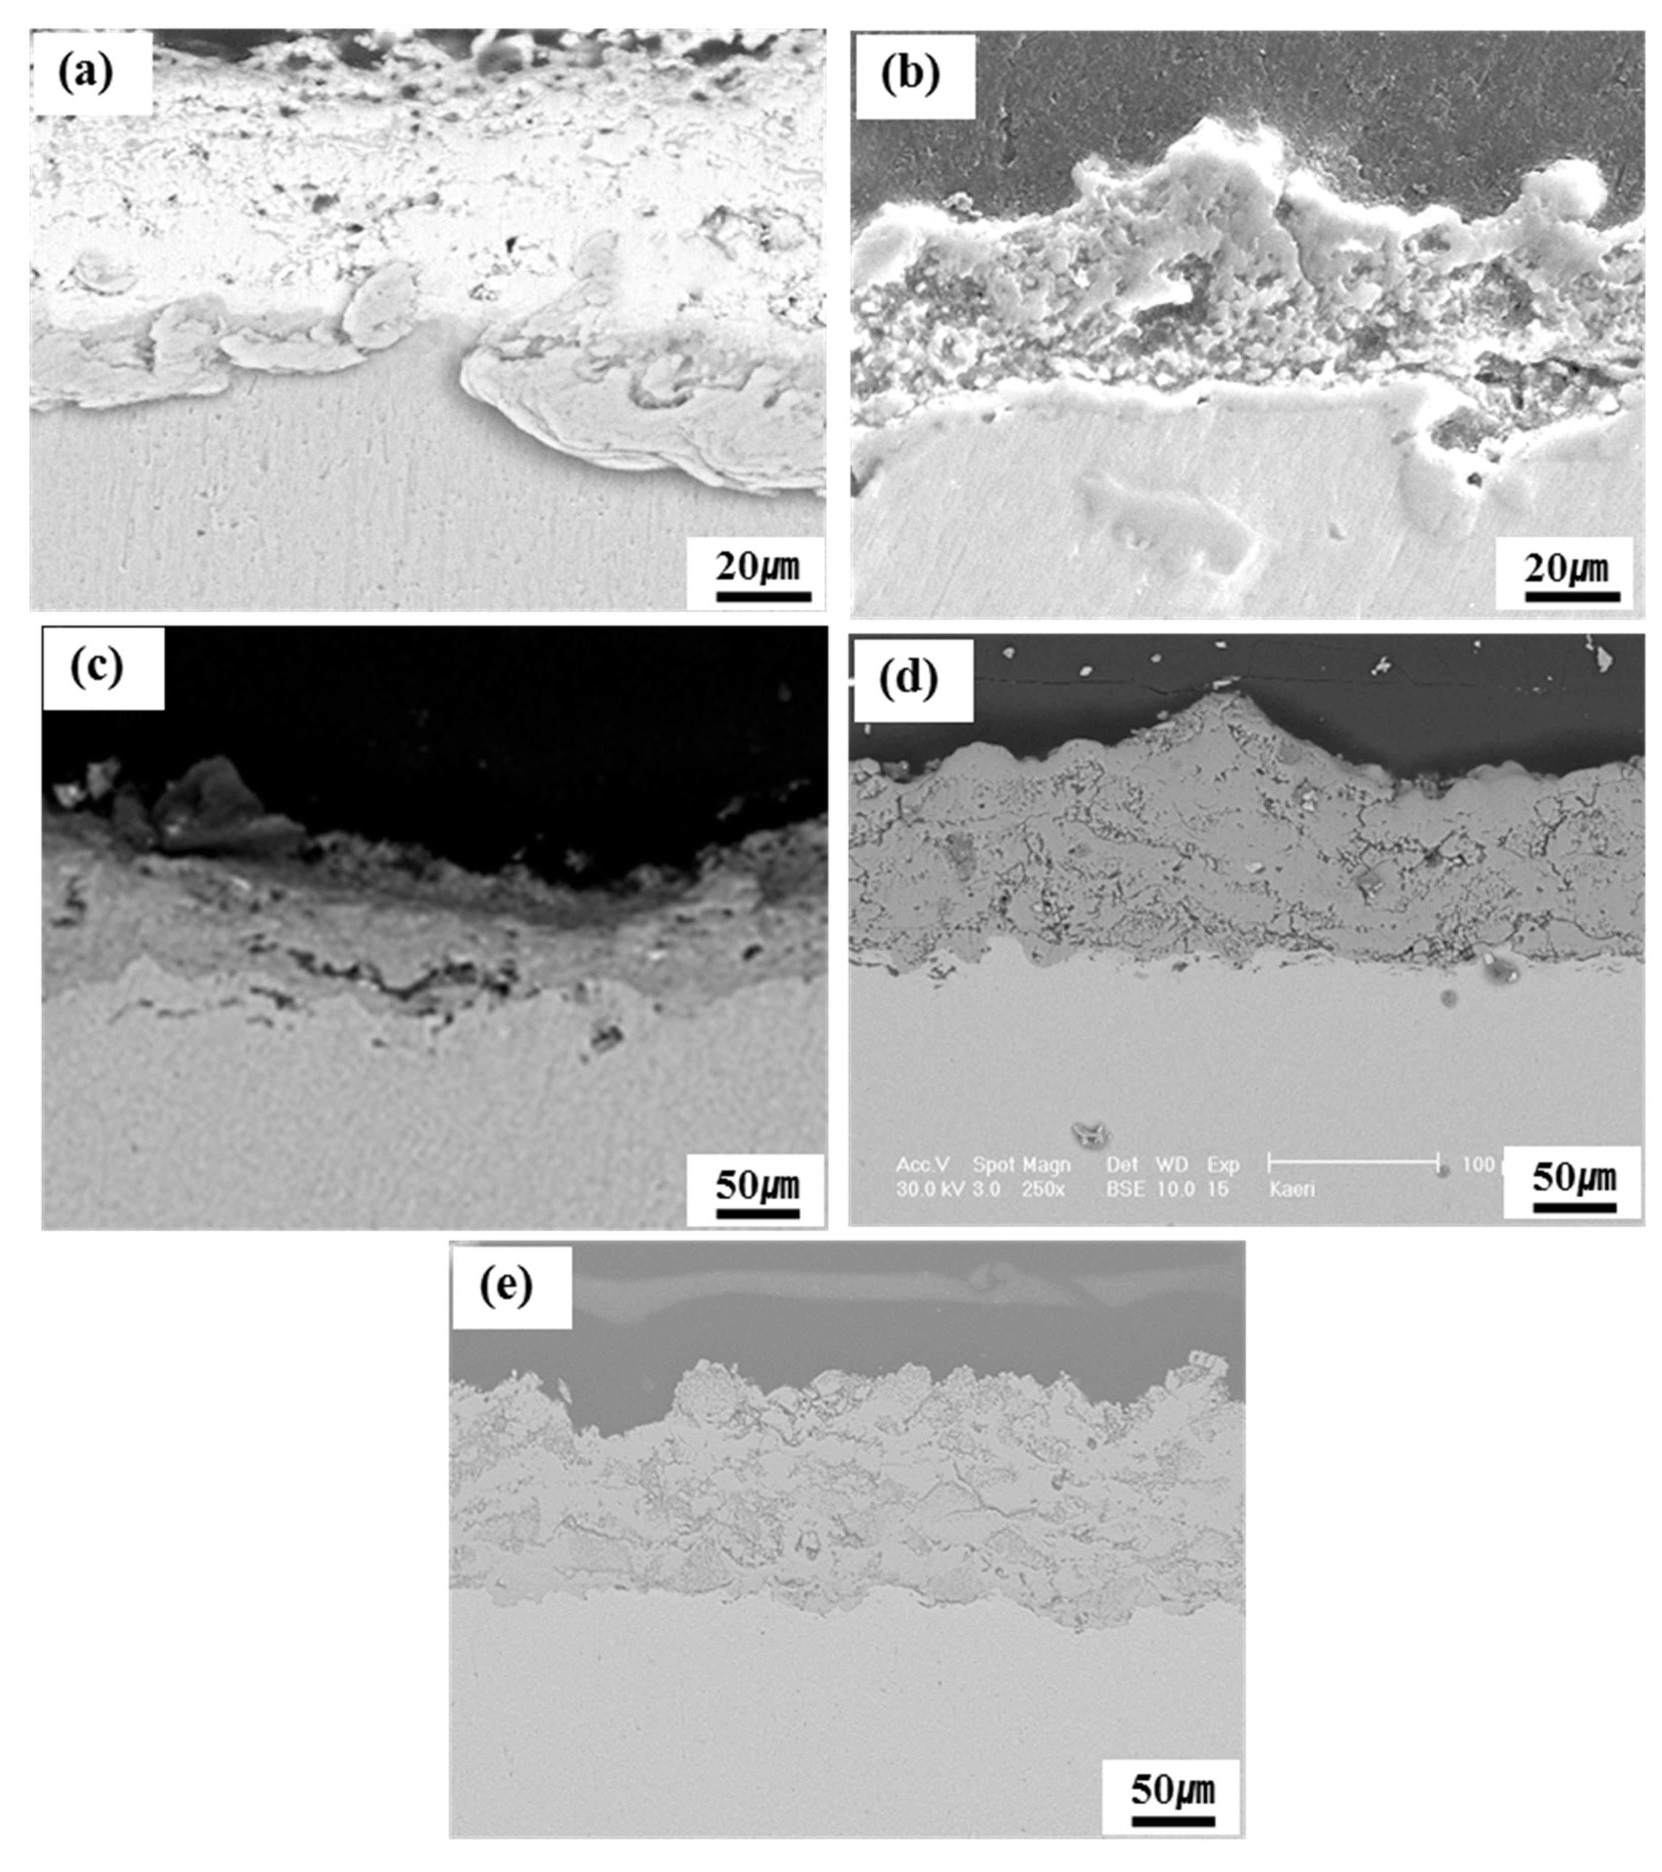
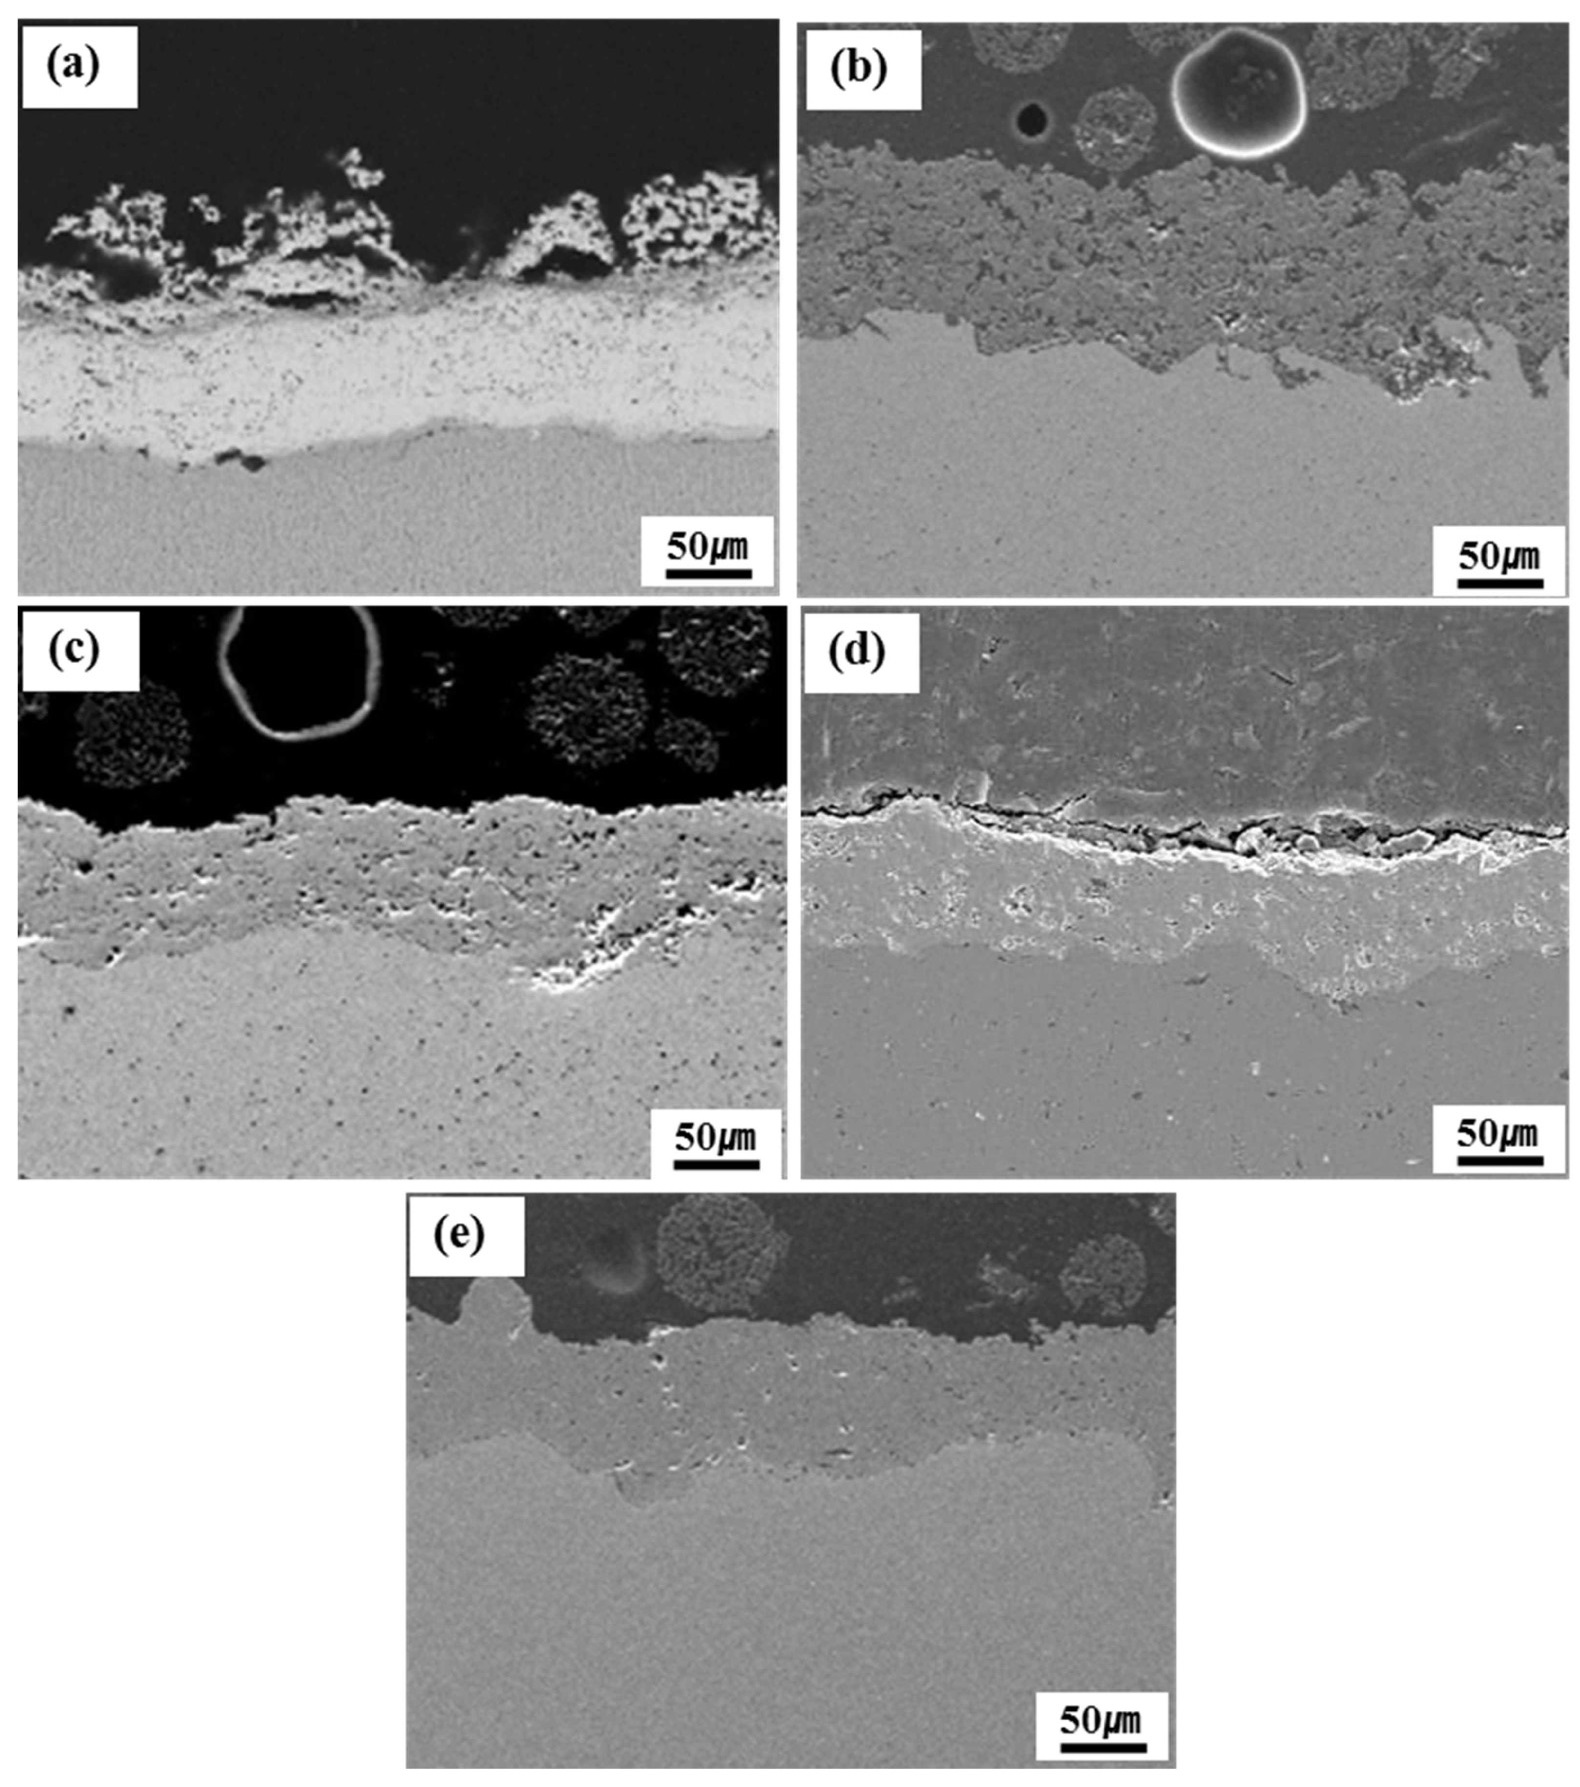
Fig. 3 shows cross-sectional SEM micrographs of the samples after the plasma spray coatings. The interface between the coating layer and niobium substrate showed a good contact state, and there were no large horizontal or vertical cracks in the coatings. The TiC and ZrC coating layers had a fairly uniform thickness but poor consolidation with a considerable amount of porosity in the form of small closed pores (Fig. 3(b) and (c)). The ZrO2 coating layer also had a fairly uniform thickness with poor consolidation characterized by large closed pores (Fig. 3(d)). The TaC and the Y2O3 coating layers had a uniform thickness, were well consolidated with only a few small closed pores, and exhibited good interface contact between the coating layers and Nb substrate (Fig. 3(a) and (e)). It is known that the smooth interface contact diminishes the probability of imperfect growth and the magnitude of the tensile stress, and improves the adhesion mechanism of the chemical bonding. The porosity of the coatings was studied using SEM, and Table 3 shows the estimated porosity based on an image analysis. ZrC, TiC, and ZrO2 coatings showed higher porosity compared to TaC and Y2O3 coatings. However, the interconnected pores, which will have a direct effect on the extent of penetration of uranium through the pores, were not observed.
Cross-sectional SEM micrographs of the plasmasprayed disc after 5 thermal cycles at 1450℃ are shown in Fig. 4. The coated discs were examined for signs of coating deterioration. The ZrC coated discs showed some cracking after 5 cycles, likely due to the difference of thermal expansion with the niobium substrate; however, the cracks were not interconnected (Fig. 4(c)). Similarly,
[Table 3.] The Porosity of the Plasma-sprayed Coatings
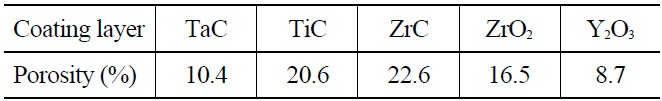
The Porosity of the Plasma-sprayed Coatings
some parallel cracking could be observed in the ZrO2 coating layer, with a small number of cracks becoming interconnected (Fig. 4(d)). The morphology of the cracks in the upper part of the coating layer appeared relatively small in size compared to the lower part. This indicates that the coating samples fail along the interface between the coating layer and substrate, rather than the coating layer or substrate itself. The TiC coating layer formed several large vertical cracks propagating through the pores, but an obvious separation along the interface between the coating layer and substrate was not observed (Fig. 4(b)). These cracks seemed to originate from the pores on the surface of the boundary. The TaC and Y2O3 coating layers were relatively free of interconnected pores and interconnected cracks were not observed (Fig. 4(a) and (e)). Hence, thermal cycling tests of the ceramic plasma-sprayed coatings showed that TaC and Y2O3 had good thermal cycling characteristics.
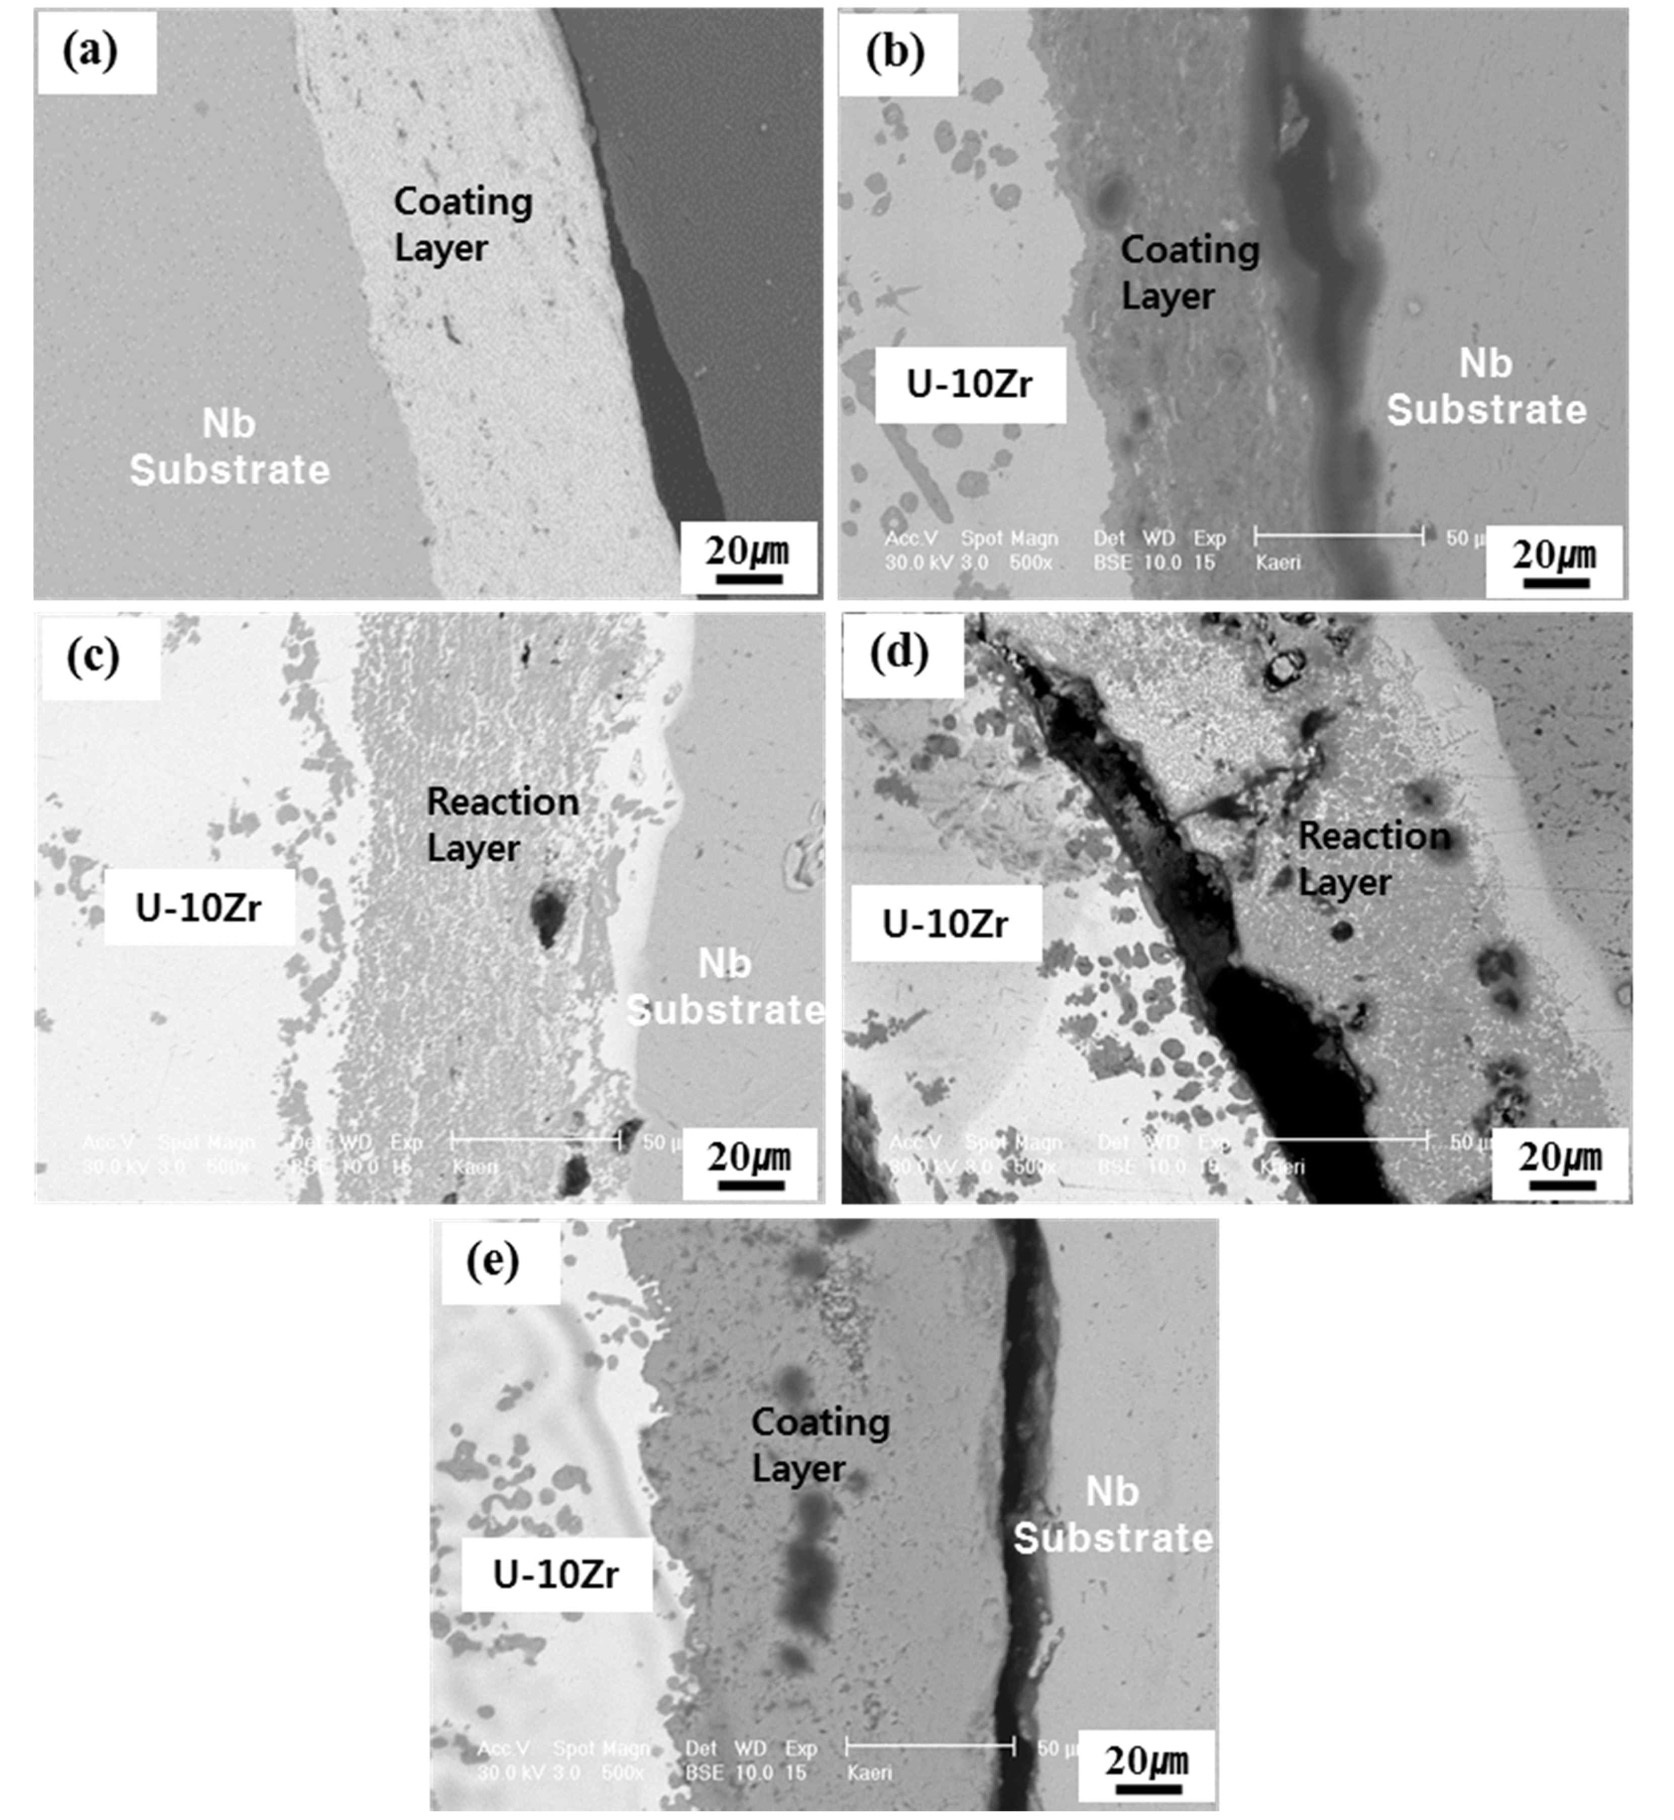
After exposure to the U-10 wt.% Zr melt of the coated Nb rods at 1600℃ for 5 min. and cooling in a separated state from the melt, an extensive interaction layer of about 50μm formed by the penetration of U-Zr melt into the ZrC and ZrO2 coating layers, as shown in Fig. 5(c), and 5(d). The dark gray layer between the coating layers of ZrC and ZrO2 and U-Zr melt was rich in Zr, which was similar to the round particles within the U-Zr melt. This means the penetration of Zr was blocked by the coating layers, and diffused through the coating layer, finally forming a reaction layer. Accordingly, ZrC and ZrO2 coatings were thought to be unavailable as coating materials for reusable crucible melting of the U-Zr fuel alloy. It is known that transition metals such as Hf and Zr elements, have reactivity with uranium, and show eutectic or eutectoid reaction with uranium even at low temperatures [16]. Thus, though the zirconia/hafnium-based materials are useful for many high temperature applications, their use in the nuclear industry is limited. The TaC and TiC coated rods showed a little
penetration of U and Zr elements into the surface of the coating layers from the EDX analysis; however, the morphology of the coating layers still appeared sound (Fig. 5(a) and (b)). It can be seen that the layer of U-Zr melt over TaC coating layer disappeared in Fig. 5(a). This is thought the thin layer of U-Zr melt separated from the coating layer during the sample preparation, i.e., cutting or polishing. Finally, the Y2O3 coating layer, as shown in Fig. 5(e), was free from dissolution, and no reaction layer formation or penetration of U-Zr melt into the coating layer was observed after exposure to the melt for 5 min. From the standpoint of thermodynamics [16], it is known that Y2O3 is the most stable compound among TaC, TiC, ZrC, and Y2O3 coatings. A Gibbs energy minimization study of the Y2O3-U system also indicates that yttrium oxide is chemically stable up to 3000 K [17-18]. Thus, the reduction of Y2O3 by uranium metal is not feasible, as the Gibbs free energy of formation of Y2O3 is lower in comparison with UO2. In addition, yttrium does not have any eutectic or eutectoid reaction with uranium in the phase diagram [4,19] and the binary phase diagram of uranium and yttrium metal indicates a very low mutual solubility. In view of these natures of Y2O3, it is supposed that the Y2O3 coating layer shows a good thermal compatibility with U-Zr melt.
The results were similar for longer exposure times. After 15 minutes of exposure in the U-10 wt.% Zr melt at
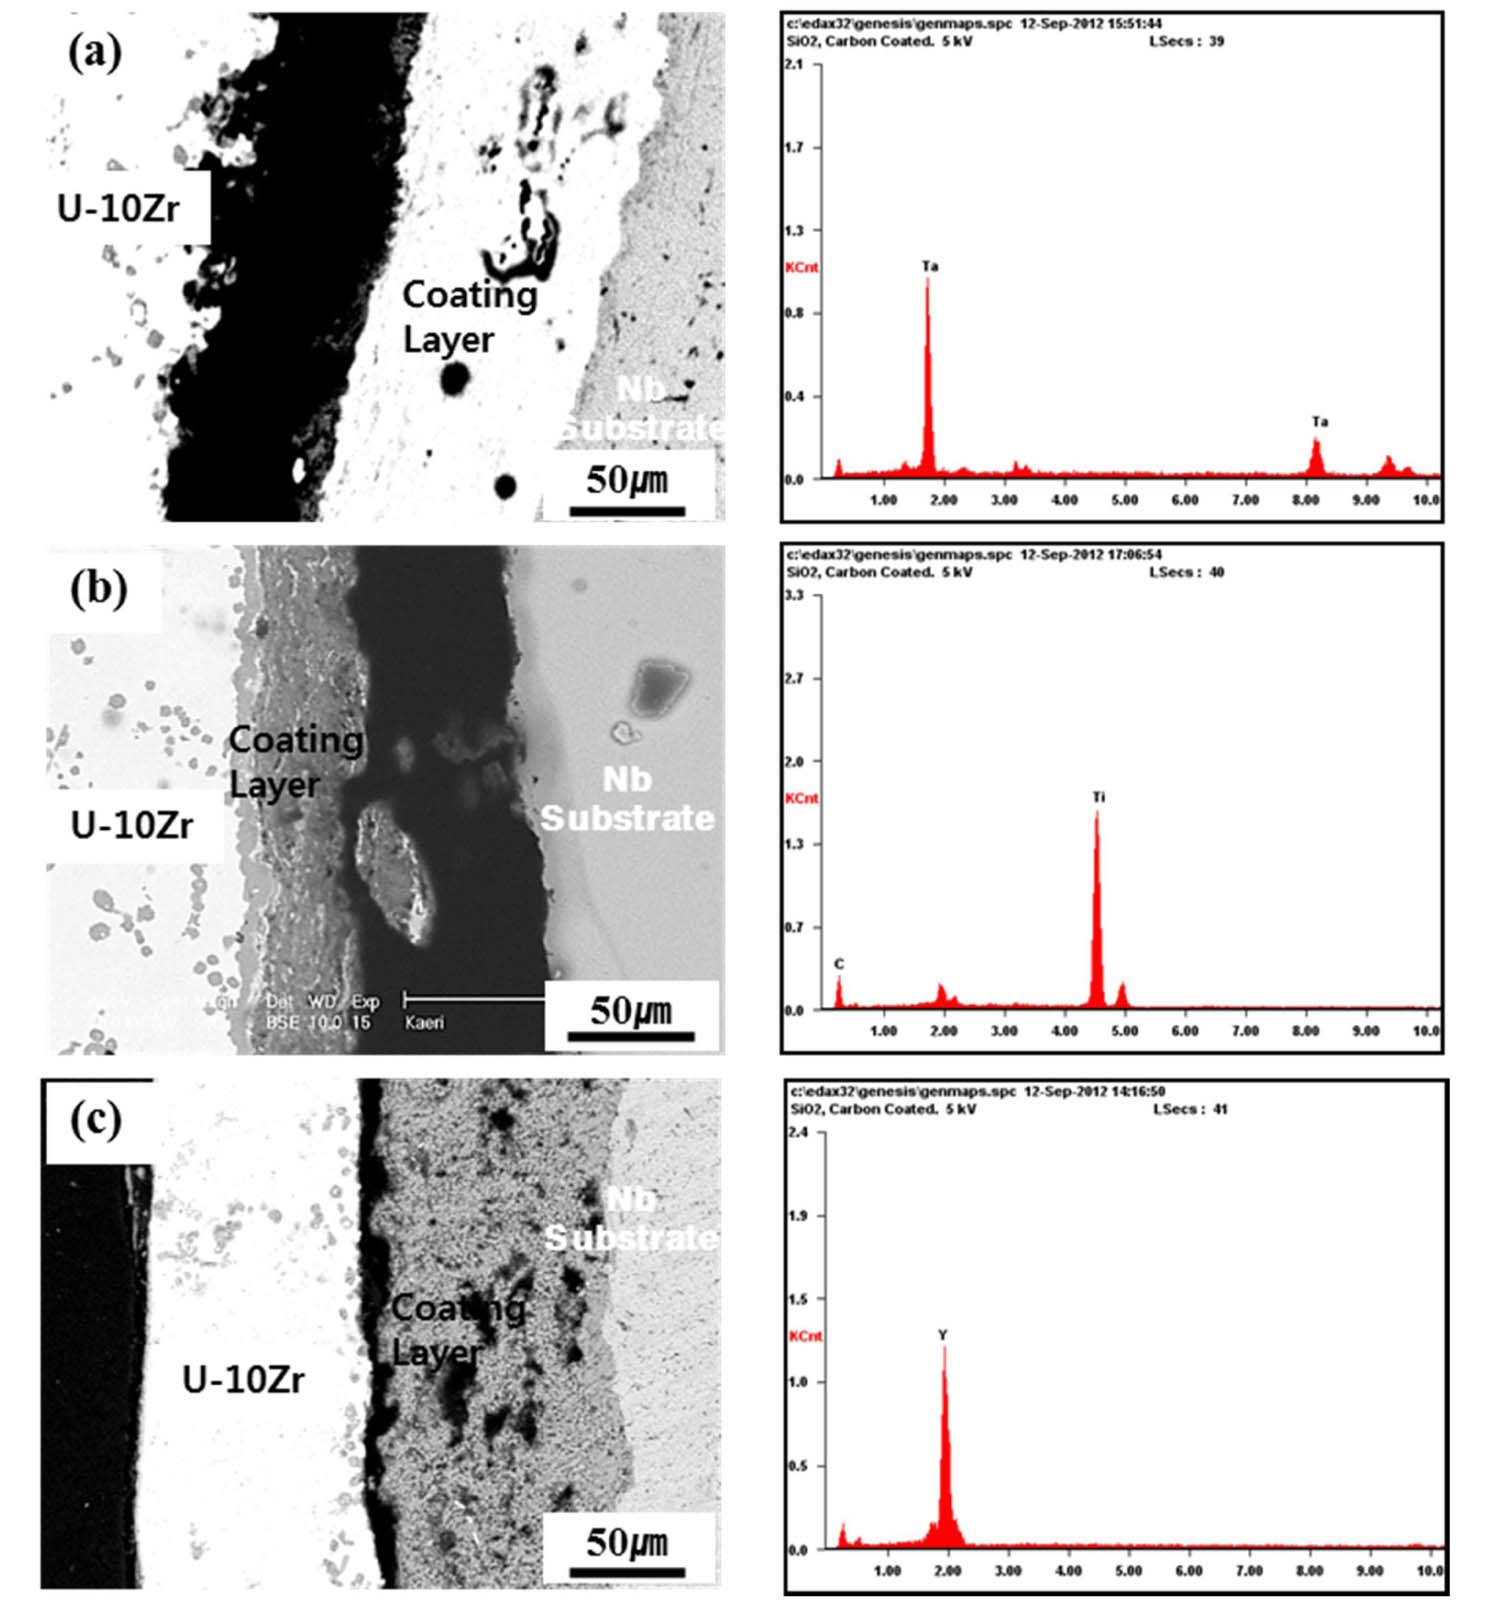
1600℃, significant degradations occurred on the ZrC, and ZrO2 coated rods. The ZrC and ZrO2 coatings disappeared due to the eutectic reaction of U-Zr alloy with the ZrC and ZrO2 coating layers. A smooth and round interface boundary developed as the coated rod reacted with the melt. Fig. 6 shows a cross-sectional micrograph after exposure to the U-Zr melt for 15 min. and the corresponding EDX spectra of the TaC, TiC, and Y2O3 coatings, respectively. EDX results revealed that there were no reactions of UZr melt with these coating layers. The TaC coating layer
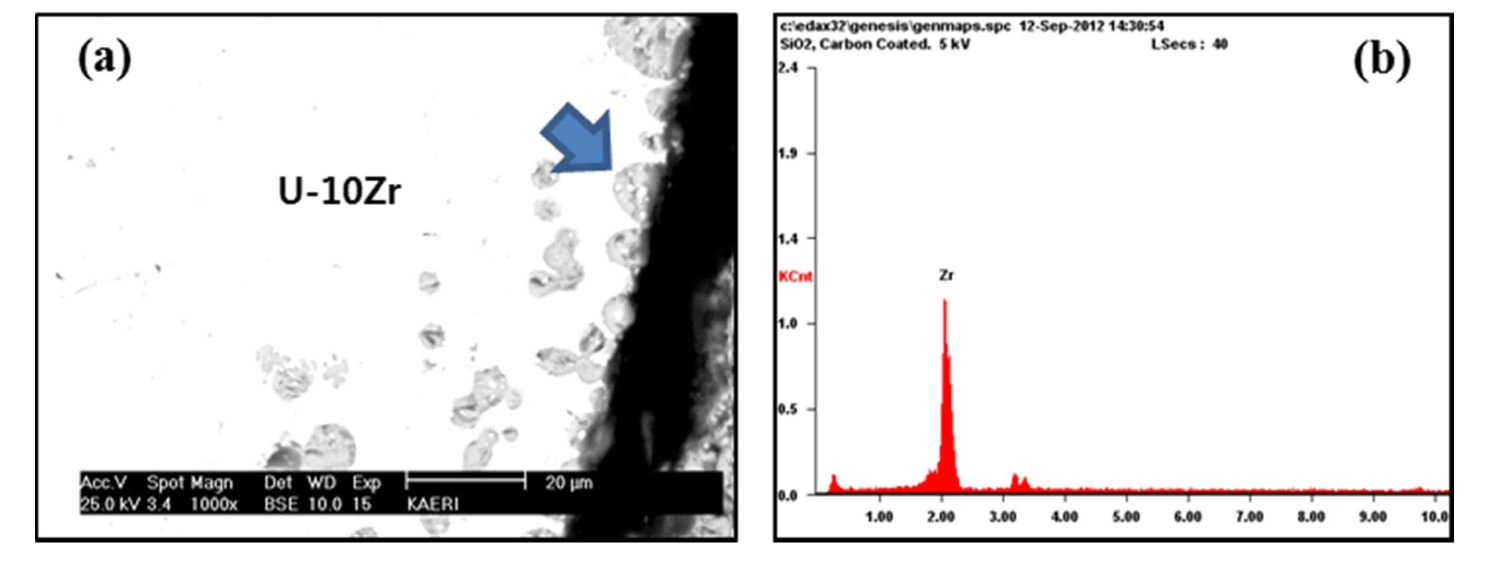
adhered well to the Nb substrate and discontinuities or cracks were not observed at the interface (Fig. 6(a)). In Fig. 6(b), the dark colored region between TiC coating and Nb substrate corresponds to a coating detachment. From the knowledge combined with the EDX analysis showing no penetration of U-Zr melt into the Nb substrate, and SEM micrograph showing no reaction layer formation, this discontinuity was estimated to occur due to stresses developed during the sample preparation, i.e., cutting or polishing. Fig. 7(a) shows a magnified micrograph of the interface between the U-Zr melt and Y2O3 coating layer shown in Fig. 6(c). The EDX result shows that gray particles gathering over the Y2O3 coating layer are Zr rich phases (Fig. 7(b)). These particles were blocked by the Y2O3 coating layer and form another thin layer. In the Zr/Y2O3 system, the likely chemical reaction is
Y2O3 + 3Zr→3Zr(O) + 2Y[Zr(O)]
However, according to the thermodynamic equilibrium, ZrO2 is unlikely to form in this reaction since Y2O3 is more stable. This means Y2O3 coating has a good thermal compatibility with U-Zr melt
Plasma-sprayed coatings for reusable crucible melting uranium fuel, TaC, TiC, ZrC, ZrO2, and Y2O3 were applied and characterized. Thermal shock resistance and interaction studies between U-Zr and the coating layers were also carried out. TiC, ZrC, and ZrO2 coatings had fairly uniform thickness and low density with a high number of large closed pores, showing poor consolidation. The TaC and Y2O3 coating layers had uniform thickness, and high density with only a few small closed pores showing good consolidation. Thermal cycling tests showed that the adhesion of the TiC, ZrC, and ZrO2 coating layers with niobium was weak compared to the TaC and Y2O3 coatings. The TaC and Y2O3 coating layers were relatively free of interconnected pores and interconnected cracks were not observed, showing a good thermal shock resistance. Melt dipping tests of the plasma-sprayed coatings indicated that TaC, TiC, and Y2O3 did not form reaction layers between U-20wt.%Zr melt and the coating layer, but significant degradations occurred on the ZrC and ZrO2 coated rods. Further work is in progress to optimize coating process and evaluate the compatibility with various metallic fuel melts.