The local K-index, which represents a geomagnetic condition corresponding observation area, is an essential factor for understanding the variation of the space environment together with the Kp-index which represents the disturbance of global geomagnetic field. To calculate the local K-index, the Solar and Space Weather Research Group of the Korea Astronomy and Space Science Institute installed three kinds of magnetometers (fluxgate, proton, and MI sensor) at Bohyunsan Observatory from 2007 to 2009 (Hwang et al. 2011). The fluxgate magnetometer at Bohyunsan has been used to investigate the diurnal and seasonal variations of mid-latitude geomagnetic field around the Korean Peninsula and for calculating local BOH K-index (Hwang et al. 2012). The BOH K-index is calculated total 8 times per day with an interval of 3 hours. The Korea Astronomy and Space Science Institute is monitoring the geomagnetic environment around the Korean Peninsula by calculating the BOH K-index in real-time using the H component values measured from the Bohyunsan fluxgate magnetometer (RFP-523C). The wellknown FMI method is used for the BOH K-index calculation (Pirjola et al. 1990, Sucksdorff et al. 1991, Menvielle et al. 1995, Stankov et al. 2010). In general, the FMI method uses continuous 3days’ data (the day in which the K-index is to be calculated and the days before and after the day) to determine the Quiet Day Curve (QDC), which is a baseline for the K-index calculation. On the other hand, the BOH K-index is differentiated from the general technique as it determines the QDC using the one preceding month’s average (Choi et al. 2005). Other geomagnetic stations in South Korea also use the FMI method to calculate their own local K-indices, and the Kp-index provided from the NOAA determines the QDC using the median value for preceding 10 days (Takahashi et al. 2001). In this paper, the BOH K-index calculated from the Bohyunsan Geomagnetic Observatory during 2011~2012 was compared with the K-indices calculated at the Gangneung and Jeju Geomagnetic Observatories in South Korea and Kakioka Geomagnetic Observatory in Japan, by classifying data into the International Quiet Days (IQDs) and the
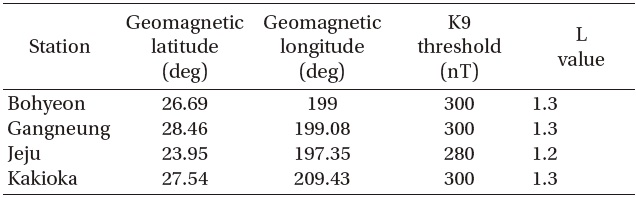
[Table 1.] Geomagnetic locations and K9 thresholds of stations.

Geomagnetic locations and K9 thresholds of stations.
International Disturbed Days (IDDs), and we also analyzed the correlations between local K-indices and the global Kpindex.
2. CALCULATION OF THE BOH K-INDEX
Various methods are used for calculating the local K-index in many geomagnetic stations over the world, and the biggest difference between those lies in how to determine the QDC. The QDC represents the average diurnal variation of the geomagnetic field, and the K-index exactly changes depending on the QDC. Therefore, the determination of the QDC is a key factor for the K-index calculation. The Bohyunsan station determine the QDC using the average value for a month preceding the day in which the K-index is to be calculated.
If once the QDC is determined, a curve is acquired using
the difference between the QDC and the geomagnetic data of the day in which the K-index is required. From the acquired curve, the K-index is calculated by applying the difference between the maximum and minimum values to the K9 threshold depending on each station’s geomagnetic locations with the interval of 3 hours. As the several geomagnetic stations in South Korea and Kakioka station in Japan have similar geomagnetic latitude and longitude, there is no big difference in the K9 threshold except for Jeju station. Table 1 shows the geomagnetic locations and K9 thresholds of the geomagnetic stations used in this paper.
To investigate the correlation between the local K-indices of each station depending on geomagnetic condition, the correlation coefficients were calculated by classifying analysis periods into (1) the whole days without considering special events, (2) during IQDs, and (3) during IDDs.
3.1 Correlation coefficients for the whole days of 2011~2012
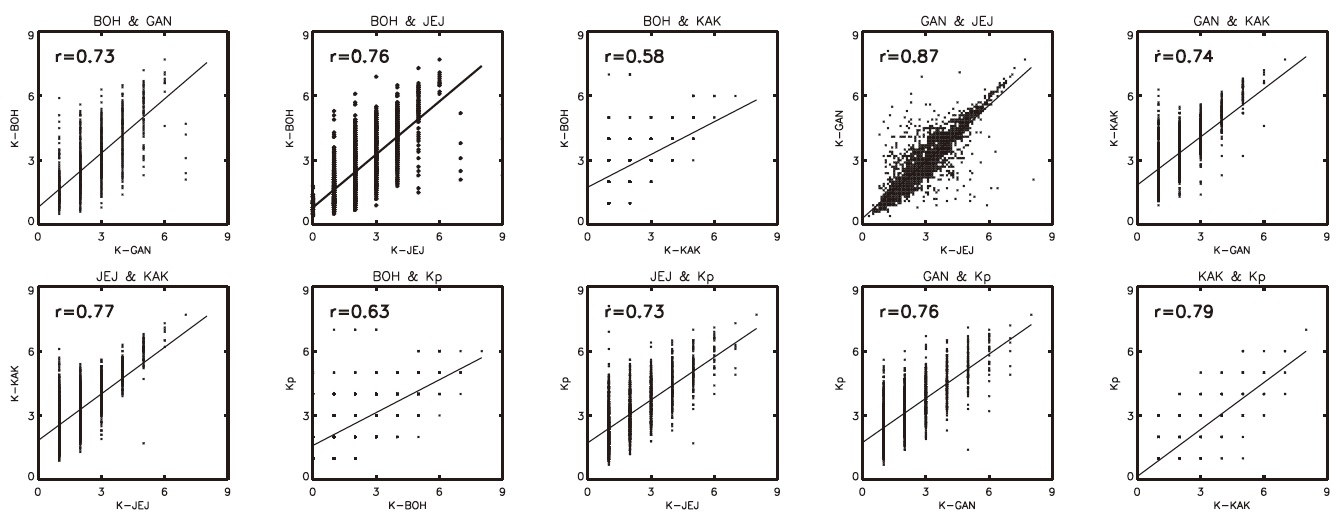
Fig. 1 shows the correlations between the K-K and KKp calculated from each stations for the whole days from 2011 to 2012. In this figure, BOH denotes Bohyunsan, GAN denotes Gangneung, JEJ denotes Jeju, and KAK denotes Kakioka station. In Fig. 1, the fourth figure on the upper side has countless dots because the Gangneung and Jeju stations calculate the K-indices down to decimal places, which results in the large number of dots. For the other stations,
[Table 2.] Correlation coefficients of K-K indices between stations depending on local time.
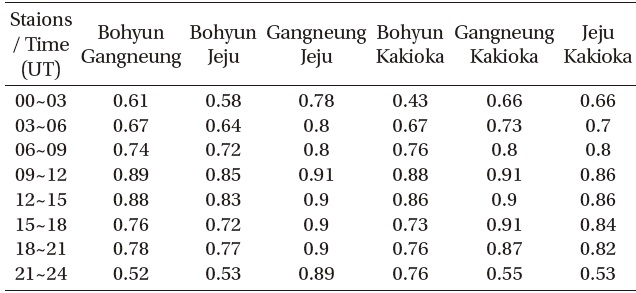
Correlation coefficients of K-K indices between stations depending on local time.
the K-indices are integer values, from 0 to 9.
For the correlation coefficients between the K-K, the JEJ and GAN showed the highest value (0.87), and the BOH and KAK showed the lowest value (0.58). For the correlation coefficient between K-Kp, the KAK showed the highest value (0.79), and the BOH showed the lowest value (0.63). Both K-K and K-Kp correlations of the Bohyunsan station showed relatively lower correlation coefficient than those of other stations, and this might be originated from the QDC differences. As explained earlier, the BOH station determines the QDC using the average value for a month proceeding the day in which the K-index is to be calculated. If an event such as geomagnetic storm occurs during this average period, the averaged value for the month would also increase, and the QDC of BOH might significantly become different from the QDC of GAN and JEJ stations, which determine the QDC using just 3-day data (the day in which the K-index is to be calculated and the days before and after the day). The similar interpretation can also be applied to the Kp-index, which determines the QDC using the median
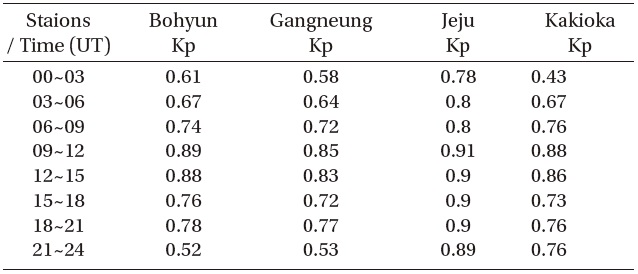
[Table 3.] Correlation coefficients of K-Kp indices depending on local time.

Correlation coefficients of K-Kp indices depending on local time.
value for 10 days preceding the day in which the Kp-index is to be calculated.
Additionally to investigate whether the difference in K-index changes depending on local time, all the correlation coefficients were analyzed at 3-hour intervals. Table 2 shows the K-K correlation coefficients, and Table 3 shows the K-Kp correlation coefficients. Both K-K correlation coefficients and K-Kp correlation coefficients showed the highest value during 09~21 UT (18-06 KST), which is from sunset to sunrise in Korea Standard Time (KST).
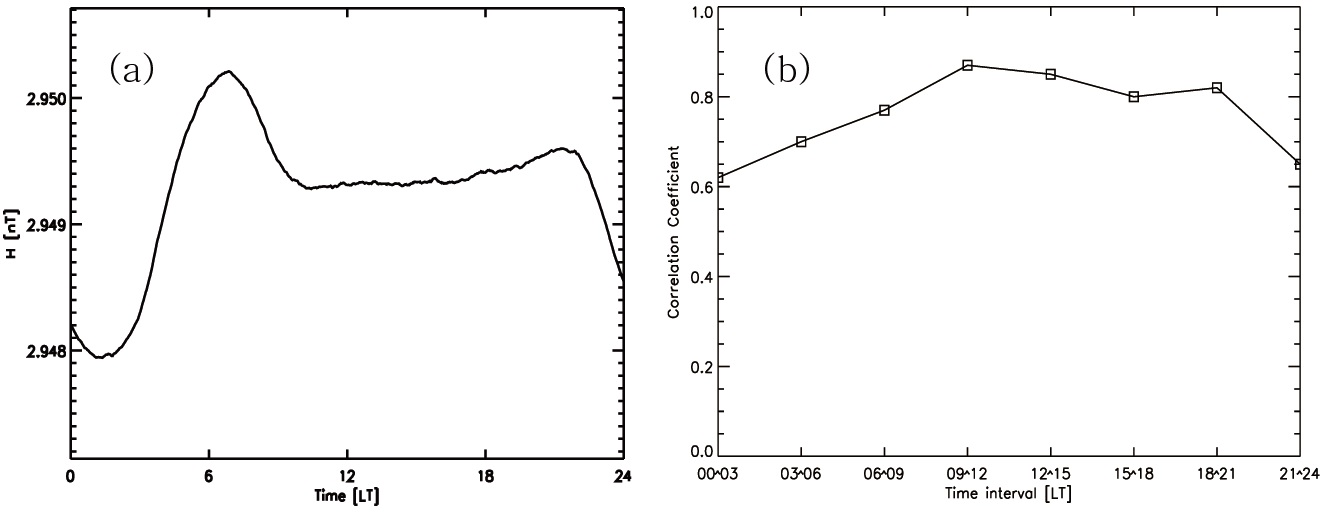
Generally the correlation coefficients show relatively high values during the nighttime because the geomagnetic field variation is affected by the Sun. The time when the geomagnetic field value shows the maximum and minimum values during the daytime is between 2~3 hours before and after the culmination of the sun, and the quiet interval when the geomagnetic field keeps nearly quiet without significant changes is from sunset to sunrise (i.e., nighttime) (Hwang et al. 2012). During this quiet interval, the variation of the geomagnetic field is insignificant, and the K-index, which is calculated from the difference between the maximum and minimum values at 3-hour intervals, also has a nearly constant value. Therefore, the calculated K-indices have similar values among several stations during the nighttime as every location corresponding to the quiet interval when the variation of the geomagnetic field is insignificant. Fig. 2a shows the average diurnal variation curve for the horizontal component (H) of the geomagnetic field observed at the Bohyunsan station, and Fig. 2b shows the graph for the average of all the K-K correlation coefficients calculated between stations. It is interesting that during the quiet interval between 09:42 and 21:18 (UT) shown in Fig. 2a, the averaged correlation coefficient in Fig. 2b also records the highest value.
3.2 Correlation coefficients during IQDs and IDDs
To compare the several local K-indices from several stations depending on geomagnetically different conditions, events are classified into IQDs and IDDs. First, to examine the difference in the geomagnetic condition between the IQD and IDD, the days which correspond to the IQD and IDD were arbitrarily selected and analyzed during 2011-2012.
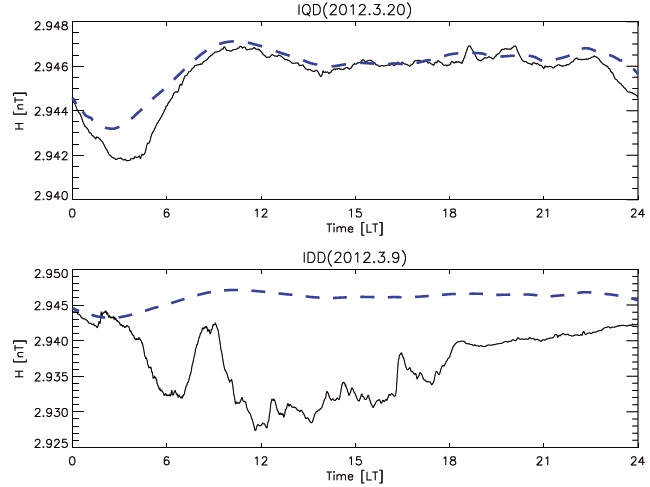
In Fig. 3, the black solid lines represent the average diurnal variations of each geomagnetic field component on March 20 when the geomagnetic activity was the quietest during March 2012, and on March 9 when the geomagnetic activity was the most disturbed during March 2012. The blue solid line represents the QDC used for the calculation of the K-indices, and it is the monthly average value of the H component during February.
On March 20 when the geomagnetic activity was the quietest during that month, the daytime minimum geomagnetic field value was 29,417 nT, and the maximum value was 29,469 nT. On March 9 when the geomagnetic activity was the most disturbed during that month, the minimum and maximum values were 29,273 nT and 29,441 nT, respectively. The gap between the maximum and
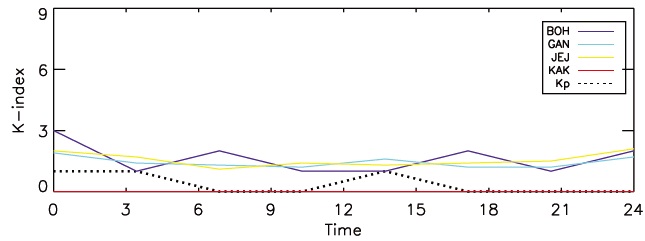
minimum values was 51 nT on March 20 and 167 nT on March 9. This indicates that the gap between the maximum and minimum values for the IDD was more than 3 times larger than that for the IQD. Fig. 4 shows the K-index and Kp-index for several stations used in this paper on May 20, 2011 which corresponds to one of the IQDs. The indices were not completely consistent with one another, but most of the values were kept approximately below 3.
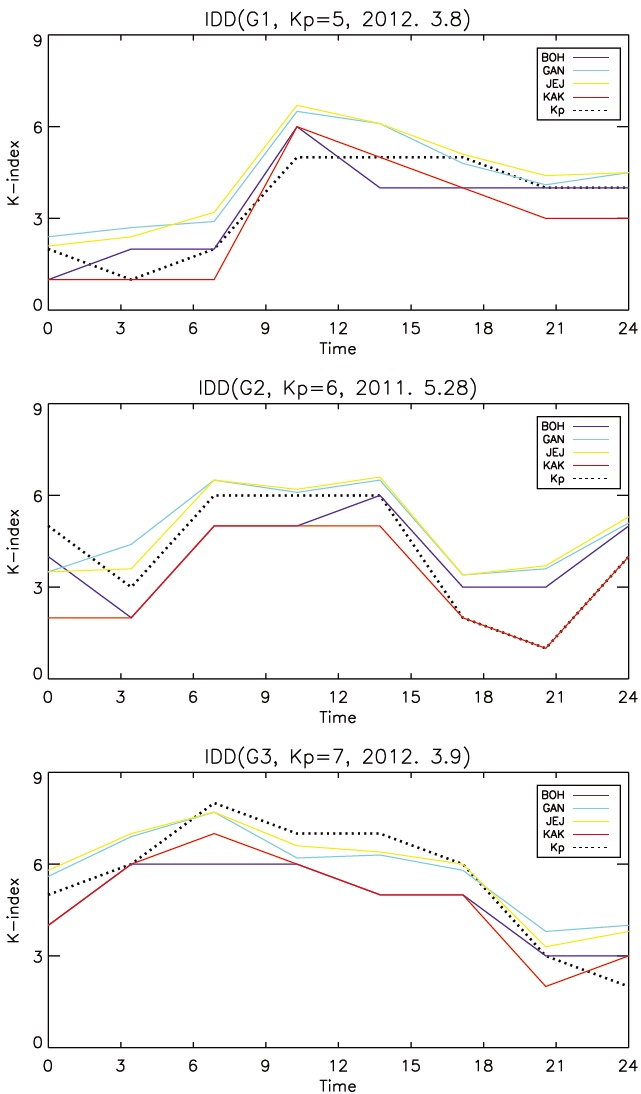
The variations of the K-index were also analyzed during the IDD. In the case of the IDD, the events are more detailed classified into G levels which correspond to NOAA geomagnetic disturbance steps. Fig. 5 shows the K- and Kp-index calculated at each station on March 8, 2012 corresponding to G1, May 28, 2011 corresponding to G2, and March 9, 2012 corresponding to G3. In this paper, when dividing the disturbance levels into G1~G3, it was considered G1 if a K-index value of 4 is observed just once a day. Similarly, it was considered G2 if a K-index value of 5 is observed just once a day, and it was considered G3 if a K-index value of 6 is observed just once a day. For the IDD, unlike the IQD, the K-indices at each station were almost consistent with one another. Especially, GAN and JEJ showed nearly identical values.
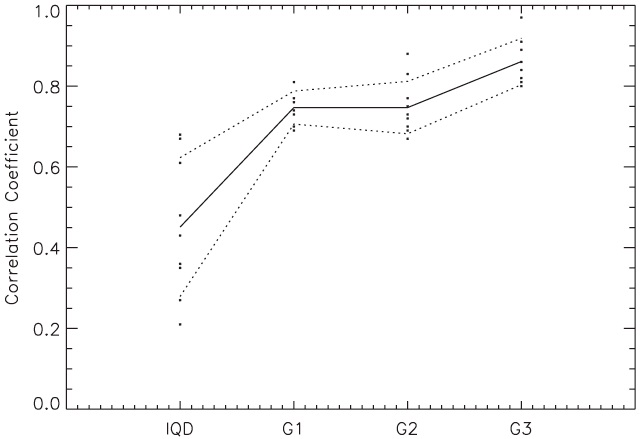
Fig. 6 shows the average values for the K-K correlation coefficients and K-Kp correlation coefficients depending on G levels. Interestingly, the correlation coefficients become higher as the geomagnetic disturbance level increases. This is related with the range of the geomagnetic variation corresponding to each level. In other words, it is because the range of the K9 threshold for each level becomes wider as the K-index increases. If the K-index is 4 or less, the K9 threshold is 0~12 nT, and the K-index has various values from 1 to 4 within 12 nT gap. However, if the K-index is more than 5, a 12 nT gap is corresponding just in a single class when the K-index is 5. If the K-index is 6, a single K-index value is obtained up to a 20 nT range. In other words, when the geomagnetic activity is quiet, the correlation coefficient becomes low since various K values can be obtained although there is only a slight difference between the geomagnetic field values for each station. On the other hand, when the geomagnetic activity is disturbed, the correlation coefficient becomes high since similar K values are obtained in a wider range gap.
Another interesting founding is that in the case of IDDs, the K-K correlation coefficient was generally higher than the K-Kp correlation coefficient. This might be caused by the difference in the geomagnetic locations of each station. In other words, when an event occurs, the local K-indices of geomagnetic stations in South Korea located at similar latitude and longitude might have quite different values from the Kp-index corresponding to the average of the K-indices obtained from a number of stations in North America. This indicates that the local K-index, which represents the local geomagnetic environment around the Korean Peninsula, takes an essential role for understanding the space environment in addition to the Kp-index which represents the global geomagnetic condition.
In this paper, the correlations between the K-index (i.e., local geomagnetic disturbance index) and the Kp-index (i.e., global geomagnetic disturbance index) were analyzed using the data obtained from 4 geomagnetic observatories in the Korean Peninsula and Japan (Gangneung, Jeju, Bohyunsan, and Kakioka). The most important factor for the K-index calculation is the determination of the QDC. When the K-indices calculated at each station were compared, the K-indices of Gangneung and Jeju, which determine the QDC in the same method, showed the highest correlation coefficient, and the K-index of Bohyunsan, which determines the QDC in a differentiated method using the average value for a month preceding the day in which the K-index is to be calculated, showed a relatively low correlation coefficient. The K-indices showed the highest correlation coefficient during 12~21 UT, which corresponds to the geomagnetic quiet interval. This is because the geomagnetic variation is affected by the Sun through the Sq current’s variations. Also, it was found that the K-K correlation coefficient and K-Kp correlation coefficient become higher as the geomagnetic activity level increases, due to the difference in the K9 threshold’s range gap in each K level. The K-K correlation coefficient between the geomagnetic stations in South Korea was higher than the K-Kp correlation coefficient, due to the differences in the geomagnetic locations; latitude and longitude of the stations. To improve the algorithm for calculating the BOH K-index, future research will be conducted using the Kalman filter method that has recently been reported (Martini et al. 2011).