The sunspot numbers form the longest directly observed index of solar activity allowing us to study its variations. The observed sunspot numbers depict well-known the 11-year cycle, namely the Schwabe cycle (Cho & Chang 2011, Kim & Chang 2011, Oh & Chang 2012, Chang & Oh 2012). It is evident that the sunspot cycle is rather irregular (for a comprehensive discussion, see Petrovay 2010). The mean length of a cycle (defined as lasting from minimum to minimum) is 11.02 years (median 10.7 years), with a standard deviation of 1.2 years. The mean amplitude is 113 (median 115), with a standard deviation of 40. It should also be noted that there is an extended interval of atypically strong activity, the so-called "Modern Maximum", covered by solar cycles 17 - 23. Excluding these cycles from the averaging, the mean, and median values of the cycle amplitude are very close to 100, with a standard deviation of 35. On the contrary, solar cycles 5, 6, and 7 are unusually weak, forming the so-called "Dalton Minimum". The long series of moderately weak cycles 12 - 16 can be seen too and occasionally referred to as the "Gleissberg Minimum". In addition, the 11-year solar cycle has an asymmetric shape with a shorter ascending (? 4-year on an average) and a longer (? 7-year) descending phase. The asymmetry is typically larger for shorter cycles. It is these variations, scientifically speaking, that make the prediction of the solar cycle such a challenging and intriguing issue. Furthermore, solar activity prediction has acquired in recent decades a more prominent status, mostly as a consequence of the potentially large impact of solar activity in human technological activity.
Precursor forecasts remain the most common of predictions (Kane 2007). Many precursor methods of predicting solar activity have made use of the sunspot number. In the most general sense, precursor methods rely on the value of some measure of solar activity at a given time to predict the activity of the following solar cycle. Specifically, correlations between some parameters relating to solar minima and sunspot numbers at solar maxima have been looked for. For instance, the relationships between the solar cycle amplitude and solar cycle length are well known (Solanki et al. 2002, Du 2006, Vaquero & Trigo 2008, Tlatov 2009). There is indeed a marginal correlation, but the correlation coefficient is insufficiently significant (
In this present paper, the relationship between the sunspot numbers at solar maxima and the characteristics of the monthly number of active days (ADs) is studied. AD has been taken as a reliable indicator of solar activity, especially during periods of minimum activity (Harvey & White 1999, Usoskin, Mursula & Kovaltsov 2000, 2001, 2004, Vaquero, Trigo & Gallego 2012). Active days are basically days with sunspots reported on the solar disk. The monthly number of active days in percentage (%) is calculated by taking a ratio of the number of active days to that of observing days in a month. In general, it can be inferred that for years with a low AD value (i.e., AD < 50%) we ought to expect a very low number of sunspot groups observable on the solar disk. Thus, around the solar maxima the monthly number of active days is always 100%, while during the solar minima it is zero or very low (i.e., AD < 50%). There is practically a linear relationship between sunspot numbers and AD when AD < 30% (e.g., Hoyt & Schatten 1998). As stronger cycles are characterized by a steeper rise phase, due to a combination of the overlap of solar cycles with the Waldmeier effect, one may expect an anti-correlation between the level of activity in the following solar maximum and the slope of the linear relationship between sunspot numbers and AD. Simple line of reasoning is as follows. According to the observed Waldmeier relation, there is a strong negative correlation between the duration of the ascending phase of a cycle and its amplitude. What it means is that the sunspot appears somehow abruptly after a long period of the quiet sun, when a strong cycle is to be followed. On the contrary, when a relatively 'active' solar minimum period appears the slope of the active phase becomes less steep. Therefore, active days with weak solar activity consequently result in the first case we discussed. Here, we have attempted to examine whether this expectation is statistically valid.
This paper is organized as follows. We begin with brief descriptions of data and how the active days are defined in Section2. We present and discuss results based on the correlation between the maximum monthly solar sunspot number and the slope of the linear relationship between sunspot numbers and active days in Section 3. Finally, we summarize and conclude in Section 4.
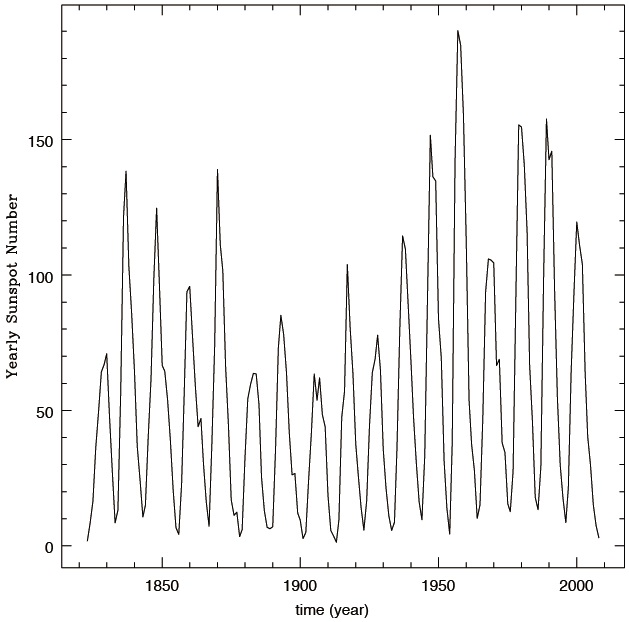
The analysed data are the daily sunspot number obtained from the Solar Influences Data Analysis Center (SIDC)1, which is the solar physics research department of the Royal Observatory of Belgium. The SIDC collects monthly observations from various stations worldwide in order to calculate the International Relative Sunspot Number (Berghmans et al. 2005, Vaquero 2007). The SIDC includes the World Data Center for the sunspot index and the International Space Environment Service Regional Warning Center Brussels for space weather forecasting. The entire sunspot dataset since 1818 is available as ASCII text files. Each file consists of records with information on individual sunspots for each day that sunspots were observed. Text files containing both monthly and yearly averages of the daily sunspot numbers are also available. In Fig. 1, we show yearly sunspot numbers from 1823 to 2008, which correspond to the beginning of solar cycle 7 and to the end
of solar cycle 23, as a function of time. It should be noted that, besides the 11 year solar cycle a secular and long term variation is apparent.
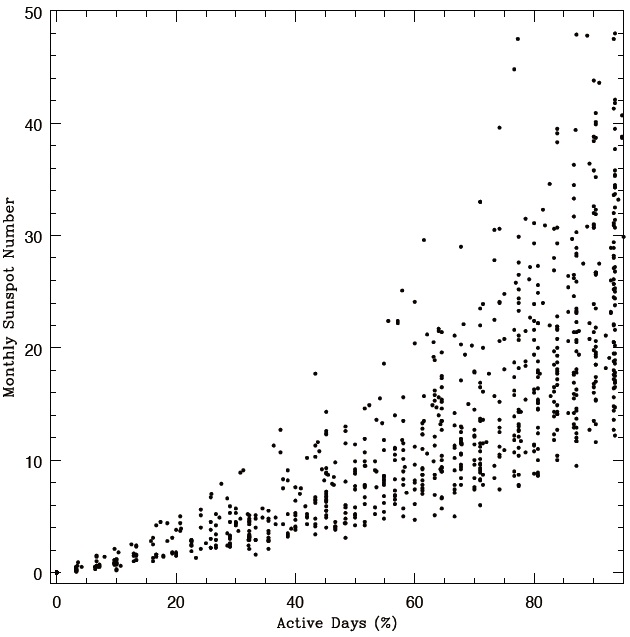
In Fig. 2, we show monthly sunspot numbers as a function of the monthly number of active days (%), both of which are computed with daily sunspot numbers recorded from
1818 to 2008. Active days are defined as days with sunspots reported on the solar disk, as mentioned above. We calculated the monthly number of active days (%) by taking a ratio of the number of active days to that of observing days of that particular month. It is seen that there is practically a linear relationship between sunspot numbers and AD (%) when AD (%) is low, ≤ 30.
1 http://sidc.oma.be/sunspot-data/
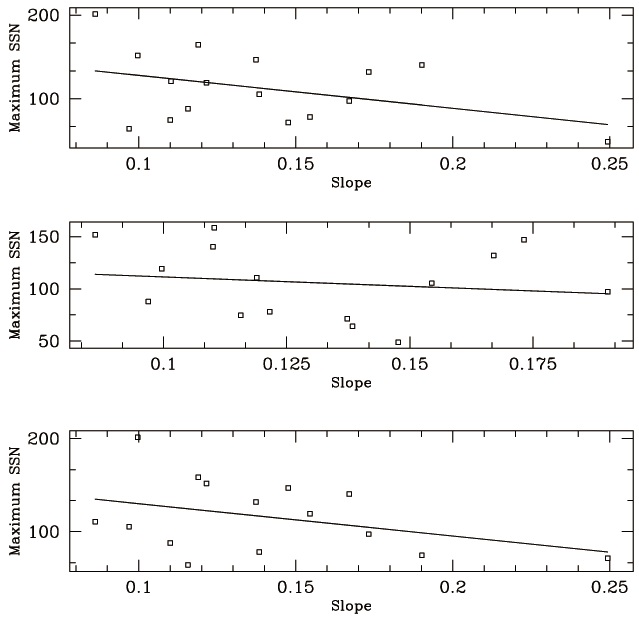
In Fig. 3, we show the maximum monthly sunspot number of a given solar cycle as a function of the slope of the linear relationship between monthly sunspot numbers and the monthly number of active days for the corresponding solar cycle. Using the method of linear least squares we obtain for the part of AD < 30%, from similar plots as Fig. 1 for each solar cycle, the slope of the linear relationship between monthly sunspot numbers and the monthly number of active days. When we calculate the slope of AD, we check the standard deviation. We note the standard deviation of different solar cycles is somewhat

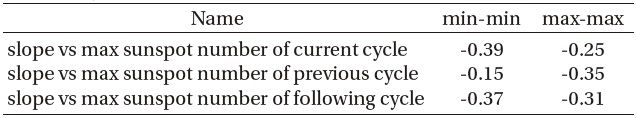
Pearson correlation coefficient for AD < 30%. The second and third columns represent the linear correlation coefficients resulting from solar cycles defined by minimum to minimum and by maximum to maximum, respectively. See the text for the detailed discussion.
similar, ~ a couple of parts of hundreds. We would like to note that the solar cycle here is defined by minimum to minimum as commonly defined. For some active cycles, such as 19, the slope cannot be obtained since most of AD is hardly < 30%. In the upper panel, the maximum solar sunspot number (maximum SSN) of
We have calculated a linear correlation coefficient
In Fig. 4, we show similar plots to Fig. 3, which results from the solar cycle defined by maximum to maximum. Even though the conventional idea that a new cycle begins at the solar minimum is widely accepted, such a standard definition may not be the best in this kind of analysis in that low AD parts have contributions from both beginning and end of a given cycle when sunspot numbers are equally small. Therefore, perhaps one would like to ask a question whether the slope of AD in each intra-cycle interval should be looked for or in inter-cycle interval. In other words, while the analysis presented above corresponds to the former one
would like to look at ADs contributed from the end of the previous cycle and from the beginning of the current cycle, whose case corresponds to the latter. To test the idea of the latter, as a pilot test, we define the solar cycle by maximum to maximum and repeat the same analysis (cf. Mursula & Ulich 1998). For instance, the solar cycle 22 is defined to begin in July in 1989 (officially known as the maximum of solar cycle 22) and to end in March in 2000 (officially known as the maximum of solar cycle 23), instead of traditional duration from September in 1986 (officially known as the beginning of solar cycle 22) to May in 1996 (officially known as the end of solar cycle 22). Having defined the solar cycle as such, we obtained statistical parameters as listed in Table 1. Surprisingly, it is very hard to tell that any improvement can be seen. Once again, we also employed the Spearman rank-order correlation test and redo same calculations with data sets of AD < 50 %. General conclusions are same as in minimum to minimum case.
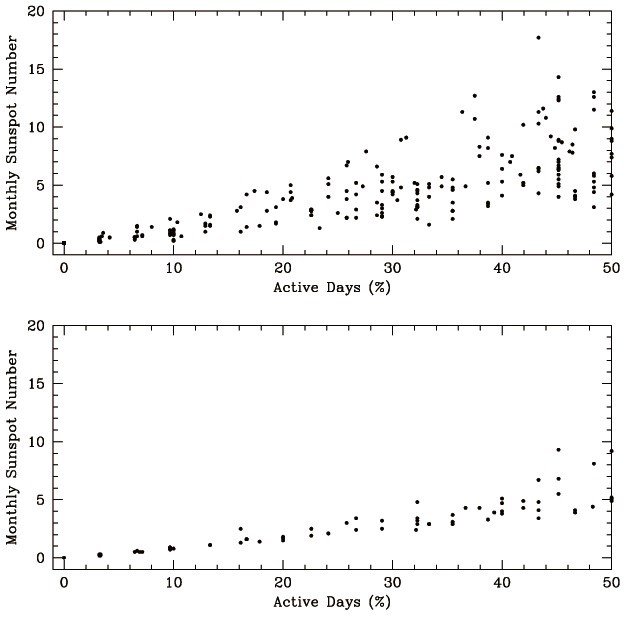
In Fig. 5, we show monthly sunspot numbers as a function of the monthly number of active days (%). In upper and bottom panels result from the observed sunspot numbers during the period from solar cycles 7 to 16 and during solar cycles 17 to 23, which correspond to "Modern Maximum", respectively. We would like to note that solar cycles 17 to 23 are markedly stronger than average and none is weaker than average. The slope of the linear relationship between monthly sunspot numbers and the monthly number of active days are 0.155 ± 0.007 and 0.105 ± 0.006, respectively, when data sets of AD < 30% are analyzed. For AD < 50% the
slope of the linear relationship between monthly sunspot numbers and the monthly number of active days are 0.169 ± 0.007 and 0.124 ± 0.008, respectively. Even though the correlation we have found is insufficiently high, as a result of Fig. 5, we find that the slope is indeed small for the strong period in a long timescale.
Parameters associated with solar minimum have been studied to relate them to solar activity at solar maximum so that one could possibly predict behaviors of an upcoming solar cycle. In this work, we have explored the relationship between the sunspot numbers at solar maximum and the characteristics of the monthly number of active days. Specifically, we have statistically examined how the maximum monthly sunspot number of a given solar cycle is correlated with the slope of the linear relationship between monthly sunspot numbers and the monthly number of active days for the corresponding solar cycle. We have calculated the linear correlation coefficient