Carbon nanotubes (CNT) have attracted much interest owing to their unique physico-chemical and mechanical properties and due to their potential applications such as electron field emitters, biosensors, electrode materials for solar cells, and as components in fuel cells [1,2]. Many synthetic methods, such as arc-discharge, laser ablation, chemical vapor deposition (CVD) and spray pyrolysis are directly or indirectly based on petroleum products as a precursor [3,4]. Considering the environmental effects and declining petroleum product sources, efforts are now directed to switch over to reproducible natural carbon sources such as camphor [5] and turpentine oil [6]. Both have been found to be good carbon sources for the synthesis of CNTs.
Our effort is mainly focused on identifying and using regenerative, environmentally clean and inexpensive natural products as precursors for the synthesis of carbon nanomaterials (CNMs). Non-edible oils derived from plant seeds
To synthesize CNMs, the CVD method was selected. This method has attracted attention due to its simplicity and owing to the possibility of producing CNTs on a commercial scale.
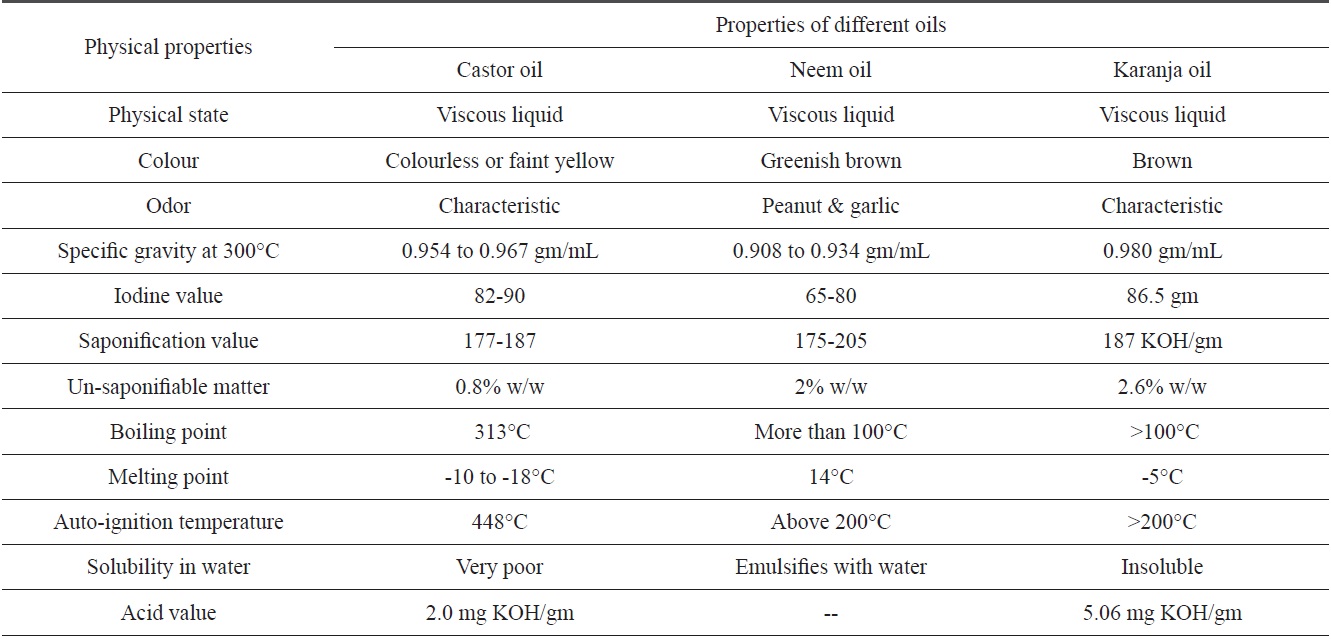
[Table 1.] Physical properties of castor, neem and karanja oils

Physical properties of castor, neem and karanja oils
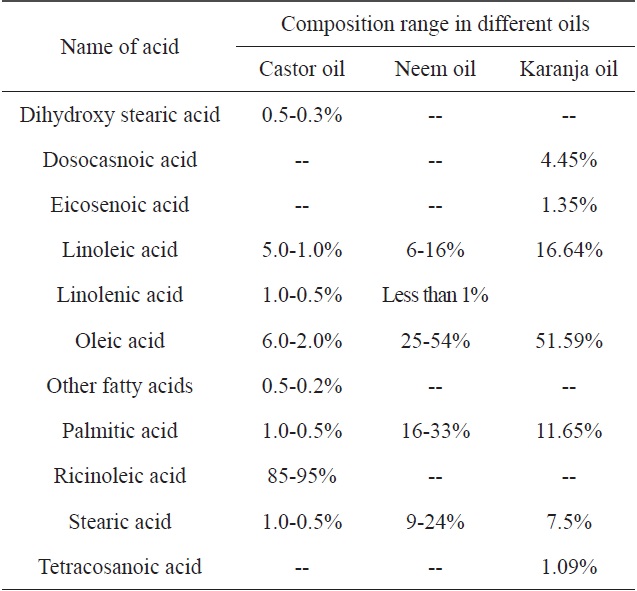
[Table 2.] Fatty acid compositions of castor, neem and karanja oils

Fatty acid compositions of castor, neem and karanja oils
The catalyst is the main parameter for CNT nucleation. Transition metals are generally used as catalysts owing to the catalytic decomposition of the carbon source when using them, their ability to form carbides, and the possibility for carbon to diffuse through and over the metals extremely rapidly [7].
In the present work, we attempted to synthesize CNMs by the catalytic decomposition of the three above-mentioned nonedible oils from plants (an eco-friendly natural carbon precursor) using nickel (Ni), zinc (Zn) and cobalt (Co) as catalysts by the CVD method.
[Table 3.] Elemental compositions of castor, neem and karanja oils
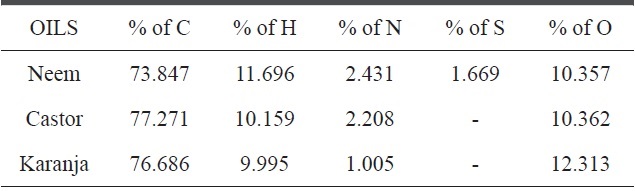
Elemental compositions of castor, neem and karanja oils
2.1. Taguchi method of optimization
The synthesis of nanocarbon by the CVD method requires consideration of parameters such as the temperature, the type of inert gas used during the process, the flow rate of the inert gas, and the catalysts and precursors. The use of at least three variables for each parameter would necessitate a very high number of experiments. To reduce the number of experiments, the Taguchi method of optimization was used
The Taguchi method [8] facilitates a reduction in the variation in a process through a robust design of experiments. The overall objective of the method is to produce a high-quality product at a low cost to the manufacturer. The Taguchi method was developed by Dr. Genichi Taguchi of Japan. The method is based on “orthogonal array (OA)” experiments, which greatly reduce the “variance” in experiments with the “optimum settings” of the control parameters. Thus, the marriage of the design of experiments and the optimization of the control parameters to obtain the best results are achieved when using the Taguchi Method. OAs provide a set of well balanced (minimum) experiments, and Dr. Taguchi's signal-to-noise ratios, which are log functions of the desired output, serve as objective functions for optimization, assisting in the data analysis step
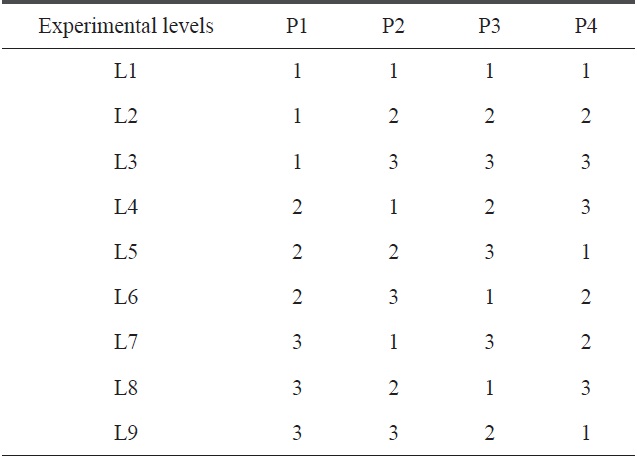
[Table 4.] Standard patterns for the L9 orthogonal array

Standard patterns for the L9 orthogonal array
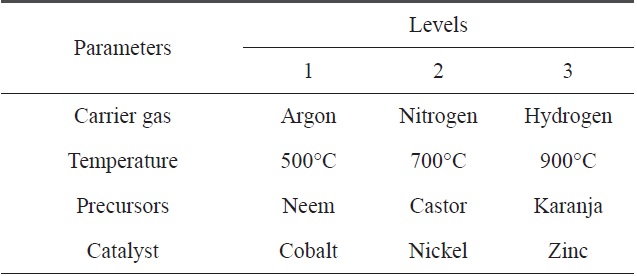
[Table 5.] Parameters selected for the CVD process and their levels

Parameters selected for the CVD process and their levels
and in predictions of the optimum results. This allows for the collection of the necessary data to determine which factors most affect the quality of the product with a minimum amount of experimentation, thus saving time and resources. The Taguchi method is best used when there are intermediate numbers of variables (3 to 50), few interactions between variables, and when only a few variables contribute significantly to the outcome.
Knowing the number of parameters and the number of levels, a proper OA can be selected. These arrays are created using an
algorithm developed by Dr. Taguchi, allowing for each variable and setting to be tested equally.
Here, we have four parameters (precursor, temperature, gas and catalyst) and three levels of each parameter. For such a combination, the appropriate OA is L9. The standard pattern of the L9 OA is presented in Table 4, where the four selected precursors with their levels are represented in tabular form, as shown below in Table 5.
2.2. Preparation of transition metal catalyst
Crystal metal powders of nickel, zinc and cobalt were synthesized by the urea decomposition method, where known amounts of Ni (NO3)2, Zn (NO3)2 or Co (NO3)2 were mixed with urea at a ratio of 1:4 by weight, after which they were ground and then dissolved in distilled water. The solution was then stirred at room temperature for 10-15 min in order to ensure that all of the metal salt particles are completely dissolved. The mixture was then dried and heated in a muffle furnace for about 3 h, followed by calcination in air at 600℃ for 3 h.
The resulting product was pure metal oxide i.e., nickel oxide, zinc oxide or cobalt oxide. The metal oxide was then reduced in an atmosphere of hydrogen gas using a horizontal furnace at 500℃ for 3 h. Following reaction took place during the oxidation and reduction processes:
For nickel Ni (NO3)2 6 H2O + (NH3)2.CO → Ni-Oxide + 4 CO2 + NH3 NiO + H2 → Ni- nano particles + H2O
For zinc Zn (NO3)2 6 H2O + (NH3)2.CO → Zn-Oxide + 4 CO2 + NH3 ZnO + H2 → Zn- nano particles + H2O
For cobalt Co (NO3)2 6 H2O + (NH3)2.CO → Co-Oxide + 4 CO2 + NH3 CoO + H2 → Co- nano particles + H2O
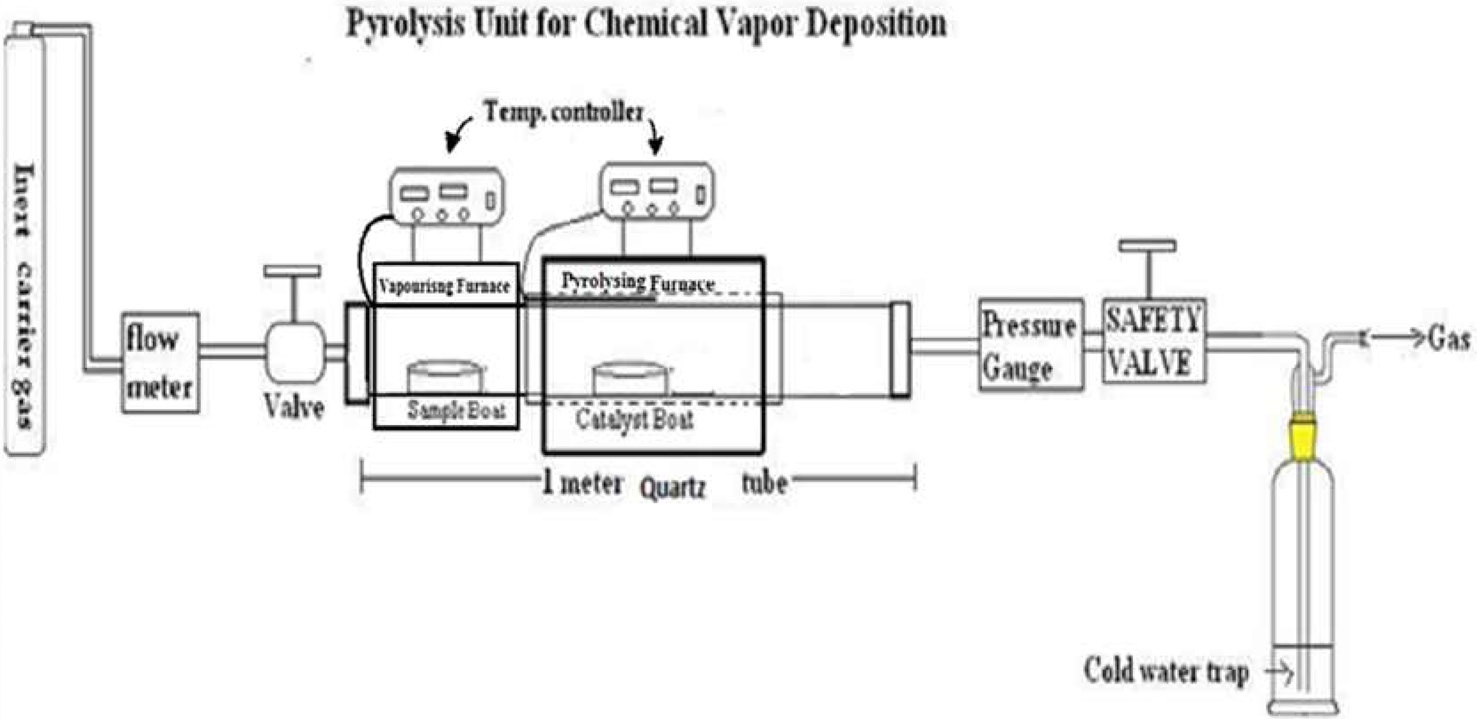
Oils were selected as precursors for the preparation of the CNMs by the CVD method. The details of the CVD
setup are given in Fig. 1. The CVD furnace used is divided into two parts: (a) an oil vaporizing zone and (b) a pyrolyzing zone. A cylindrical quartz tube (c) was inserted through both furnaces (Fig. 1), and both of them were connected to a temperature controller. One end of the quartz tube was connected to a gas cylinder (g) through a flow meter (f), and the other end was connected to a gas bubbler (h) through which excess gas could escape into the atmosphere. The positioning of the precursor-containing boat and the catalyst-containing boat was at the center of the vaporizing furnace and the pyrolyzing furnace respectively, such that a uniform temperature could be obtained. After flushing the quartz tube with a carrier gas, i.e., argon, hydrogen or nitrogen, the temperature of the vaporizing furnace was adjusted according to the boiling point of the oil, whereas the pyrolyzing furnace was heated at different test temperatures (500, 700 and 900℃) for 3 h. After the completion of the process, the CNMs was collected and purified to remove all traces of the catalyst and amorphous carbon by an acid treatment. The CNM yield was recorded prior to as well as after the purification process.
Recovered soot materials contain numerous impurities, such as graphite sheets, amorphous carbon, and metal catalysts. These impurities need to be removed by an acid treatment, which involves an initial exposure of the metal surface to oxidation. The as-synthesized soot materials were first soaked in 100 mL of 10 M HCl in a 250 mL beaker and then heated at 80℃ for 20 min. They were then kept at room temperature for 24 h and filtered. Next, they were dematerialized by washing with distilled water at least five times. Finally, they were rinsed with acetone to remove traces of water and then dried in an oven at 120℃ for 24 h.
2.5. Characterization of carbon and catalysts
Morphological observations of the as-synthesized and purified CNMs as well as the catalysts (Ni, Zn and Co) were carried out using a scanning electronic microscope (SEM). SEM was conducted using a Hitachi (S-4700) SEM by placing the as-prepared samples on conductive carbon tape.
X-ray diffraction (XRD) of the CNMs was performed with a powder X-ray diffractometer with a CuKα source to calculate the crystallographic parameters.
The Raman spectra were measured in a backscattering geometry at room temperature using an Ar ion laser (488 nm).
Because transition elements form carbide when they interact with carbon, the nano size of these catalysts provides a large surface area for reactants to be adsorbed and thus come closer to one another for the reaction to occur readily. Hence, these elements act as a catalyst for the production of CNMs. In the present study, the catalysts used were cobalt, nickel and zinc. It is their size that helps in orchestrating the shape and size of the CNMs. The SEM micrograph of the synthesized nanometals shown in Fig. 2 shows the size and morphology of the synthesized nanometals.
Nickel has a size in the range of 50 to 100 nm with different shapes, i.e., circular and triangular, having various stages of development. They were the smallest of the three synthesized nanometals.
Zinc shows some irregular and some circular bead like structure with the size in the range of 500 to 1000 nm.
Cobalt shows a certain elongated and needle-like structure with a size ranging from 50 to 100 nm in width and 500 to 700 nm in length.
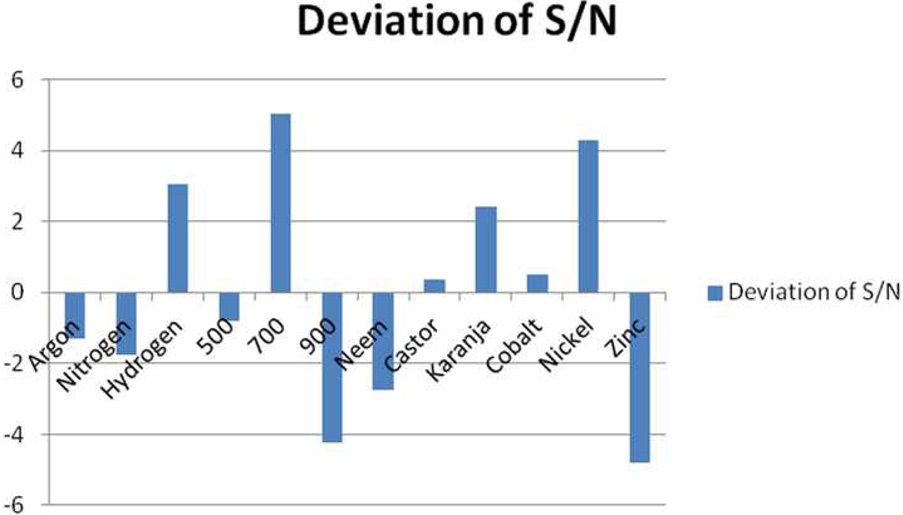
As shown in Table 6, amongst all three nanometal catalysts, nickel in its nano form has the strongest effect on the production of CNMs. The reason behind this could be its high heat of vaporization, poor reducing ability and low heat of hydration due, giving it a weak tendency to react and allowing it to remain therefore unreactive, or noble.
3.2. Taguchi optimization results
Table 6 summarizes the preparation condition and the yield of the product, both in a purified as well as in an impure state of all levels, L1 to L9. By considering the amounts of CNMs in both the impure and pure states, the percentage yield of pure carbon was calculated (Table 6). It was also observed that the impurities were comparatively more numerous due to the formation of ash as well as amorphous carbon, though these elements were removed completely after the purification process.
3.2.1. Carrier gas
To create an inert and reducing atmosphere in the pyrolysis region of the CVD setup, carrier gases are required. In the present study, the carrier gases used were argon, nitrogen and hydrogen. From Table 6, it appears that the impact of the carrier gases
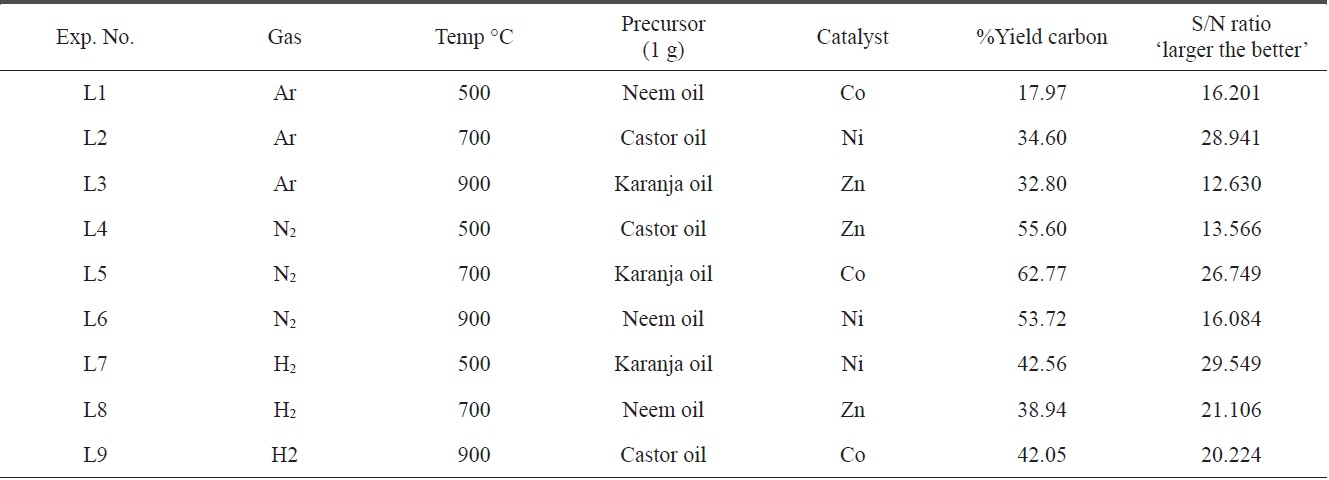
Percent yield of purified carbon from 1 g of different oils by CVD using the Taguchi experimental setup used for synthesis of carbon
varied according to other parameters. Hydrogen gas was more effective in all three tested conditions, possibly because hydrogen acts as both a reducing material while also creating a pyrolysis atmosphere. The second most suitable gas was nitrogen.
3.2.2. Temperature
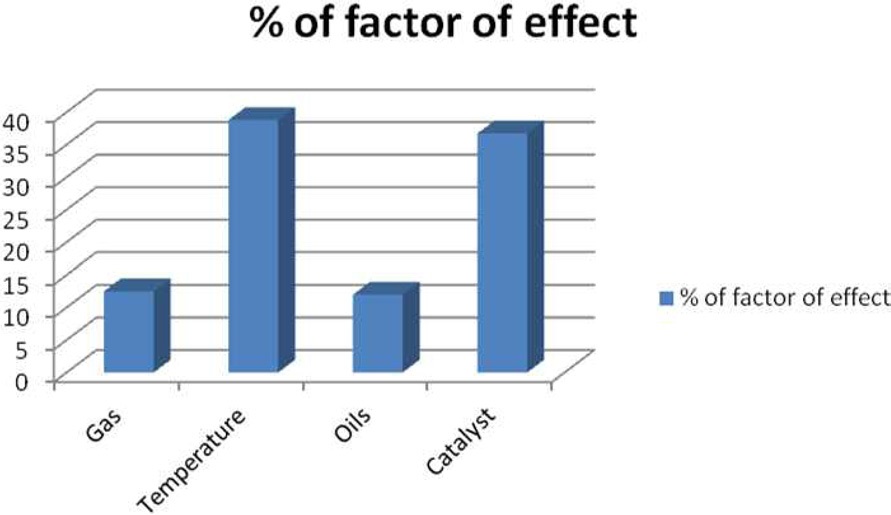
The boiling point of each type of oil was in the range of 100℃ to 300℃ and the catalysts showed high heat of sublimation; i.e., they required a large amount of energy to be converted from a solid to a vapor state. Therefore, at all three tested different temperatures (500, 700 and 900℃) of the furnace for the production of CNMs, the oils must have vaporized. Moreover, the catalyst which would have helped in the nucleation process for CNM formation at that temperature also vaporized. As per the yield obtained using the Taguchi table, it was found that a temperature of 700℃ had the maximum impact on the production of CNMs.
The Taguchi optimization technique was implemented and the ‘larger the better’ concept was calculated using purified CNMs. An OA assessment of various parameters showed that there was a minimal impact of the precursors (Fig. 3). This can be attributed to the presence of carbon and other elements, such as nitrogen, sulphur, and oxygen. An elemental neem oil analysis of all three oils, shown in Table 3, suggests that there is not much variation in the carbon content, as it was in the range of
73% to 77%. This may be a factor. Moreover, the amounts of hydrogen and nitrogen were nearly identical, except in the karanja oil, where these values were approximately half that in the neem and castor oil cases. However, only the neem oil showed the presence of sulphur in it (Fig. 4).
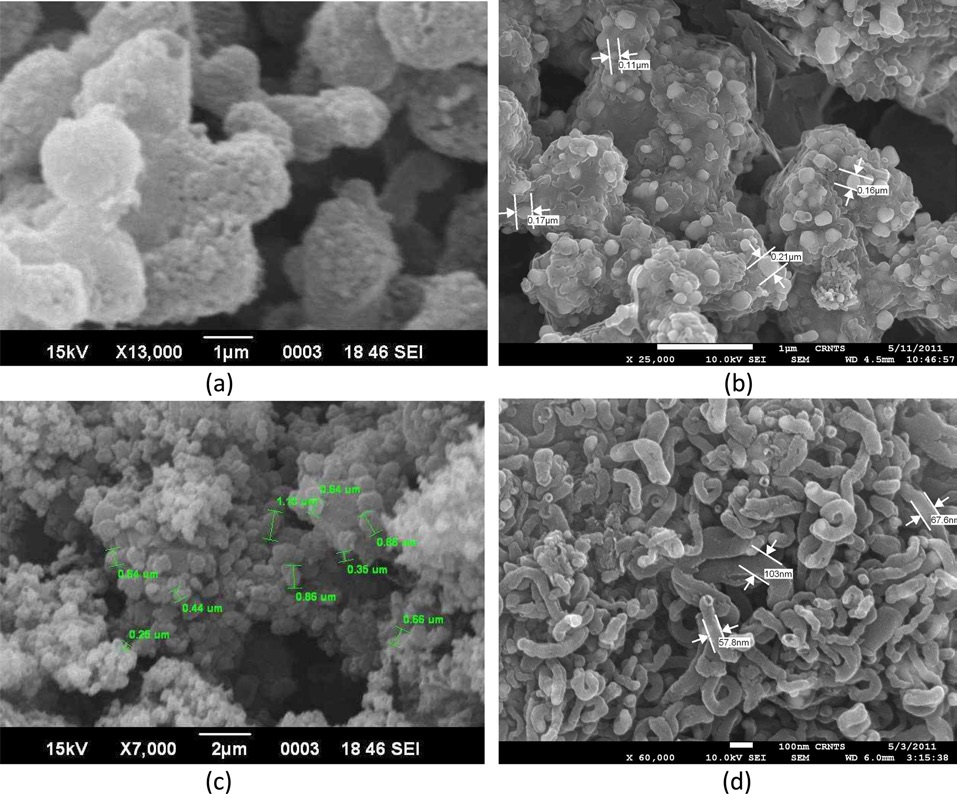
3.2.3. Morphology of carbon obtained
SEM and high resolution-SEM images of purified carbon obtained from neem oil with all the three temperatures showed variation in morphology. At lower temperatures (500℃), there were globular structures with beaded surfaces, but the beads were not separated (Figs. 5a and b), and at a higher temperature
of 700℃, clumps or the aggregation of beads were observed (Fig. 5c). At 1000℃, the beads started to elongate, becoming tube-like with open ends (Fig. 5d). Possibly at a higher pyrolysis temperature, they would yield more elongated CNTs. However, the conversion from beads to tubes is very clear in these figures. All three catalysts had a similar impact on the CNM morphology.
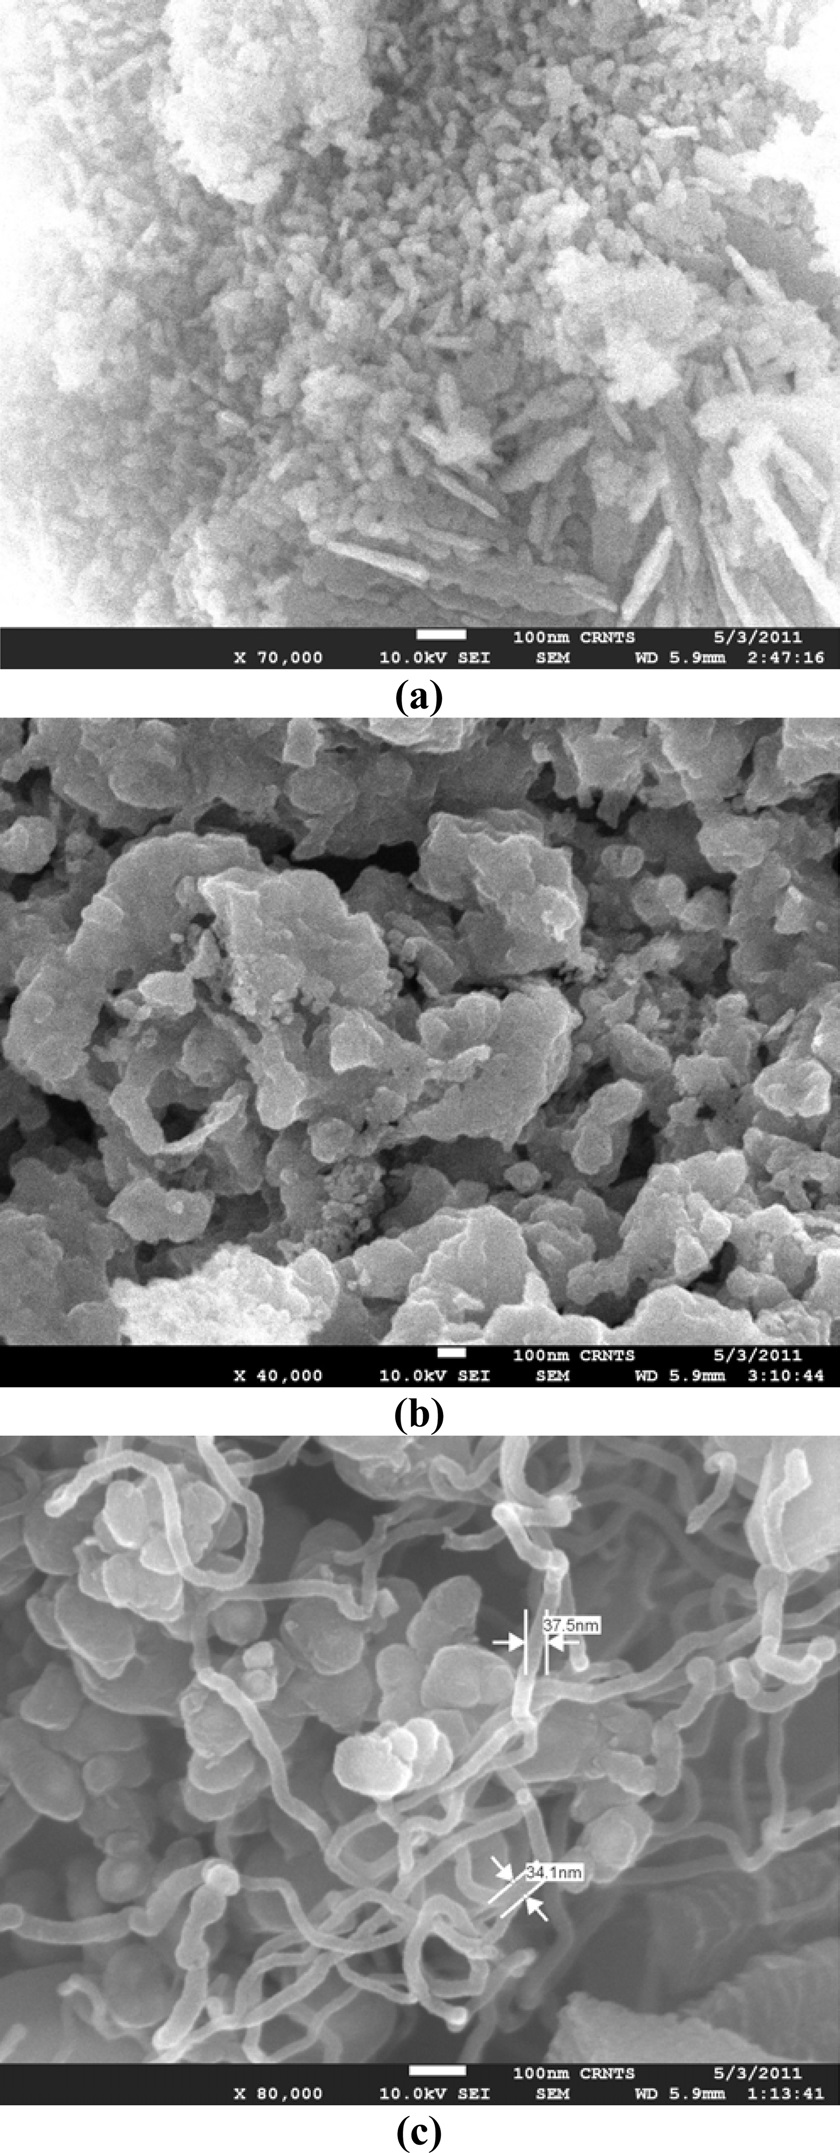
3.2.4. Karanja oil
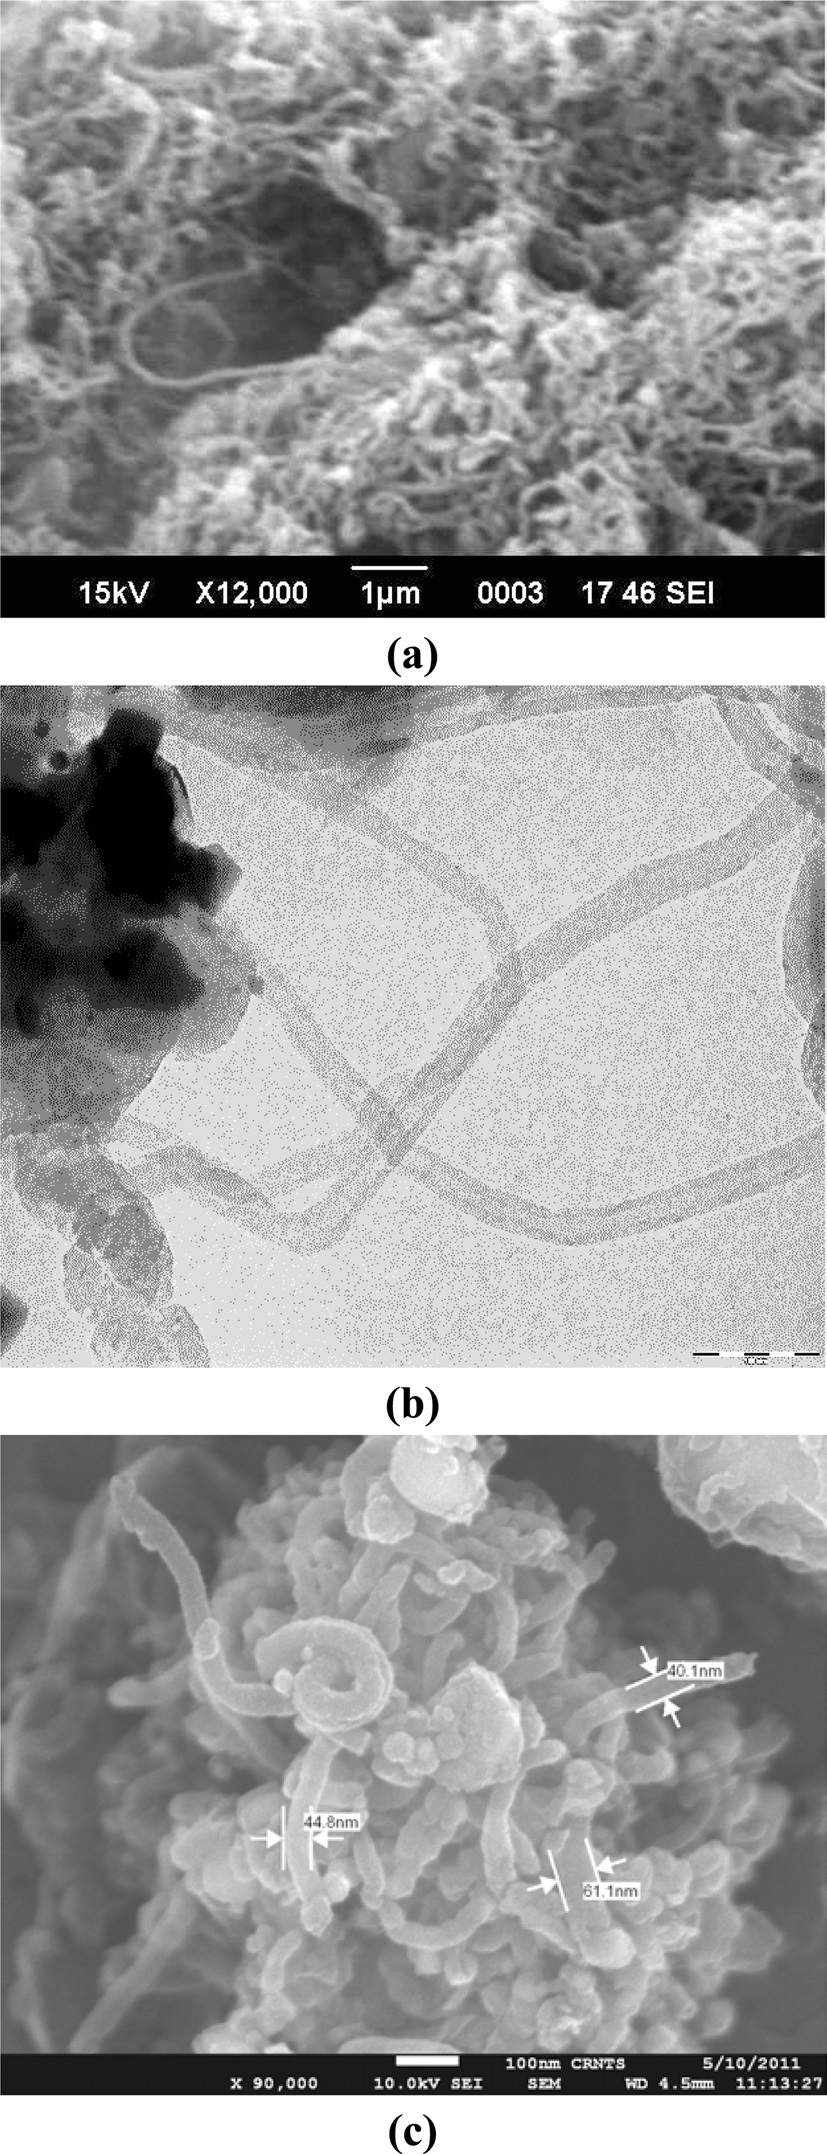
Karanja oil produced coiled tubes at all three temperatures and in the presence of all three catalysts (Fig. 6). A transmission electron microscopy (TEM) micrograph (Fig. 6b) confirmed them to be multi-walled CNTs (MWCNTs) (Fig. 6b).
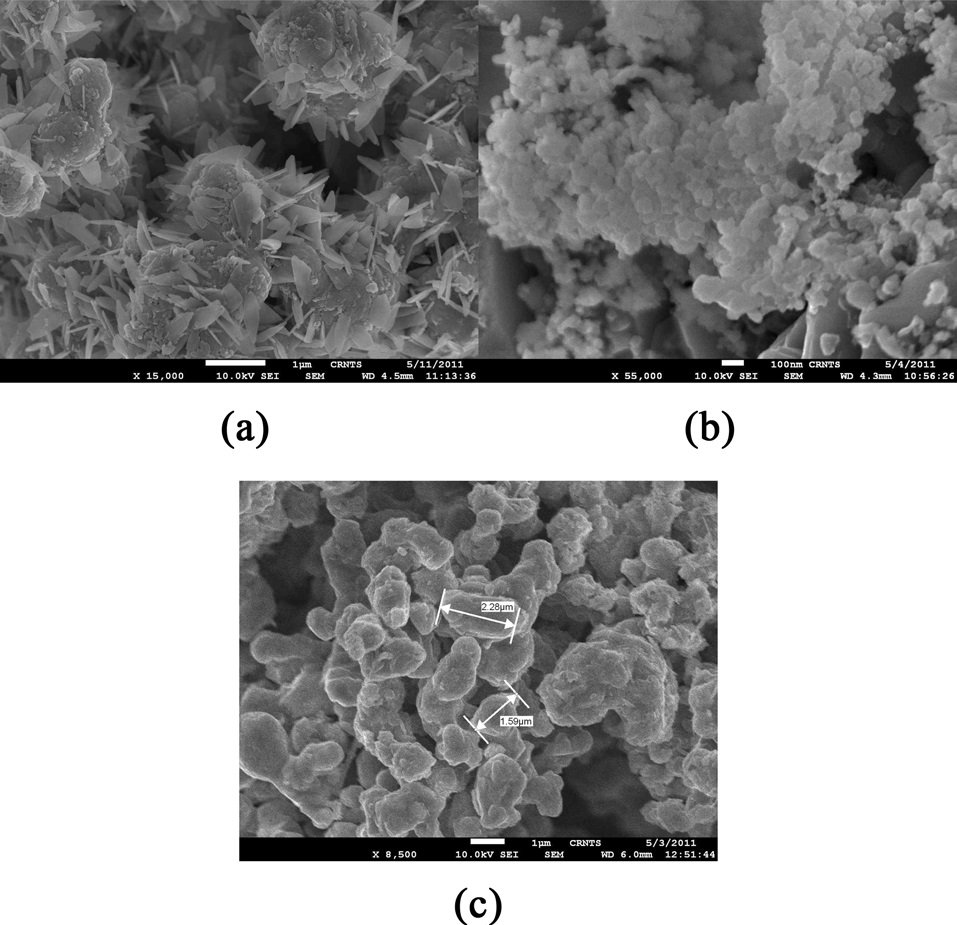
3.2.5. Castor oil
Castor oil at 900℃ produced more than 50% of coiled nanotubes (Fig. 7c) in the presence of Co only, whereas at other the two temperatures and with the other catalysts, it produced a mixture of needles, beads and several undefined shapes (Figs. 7a and b).
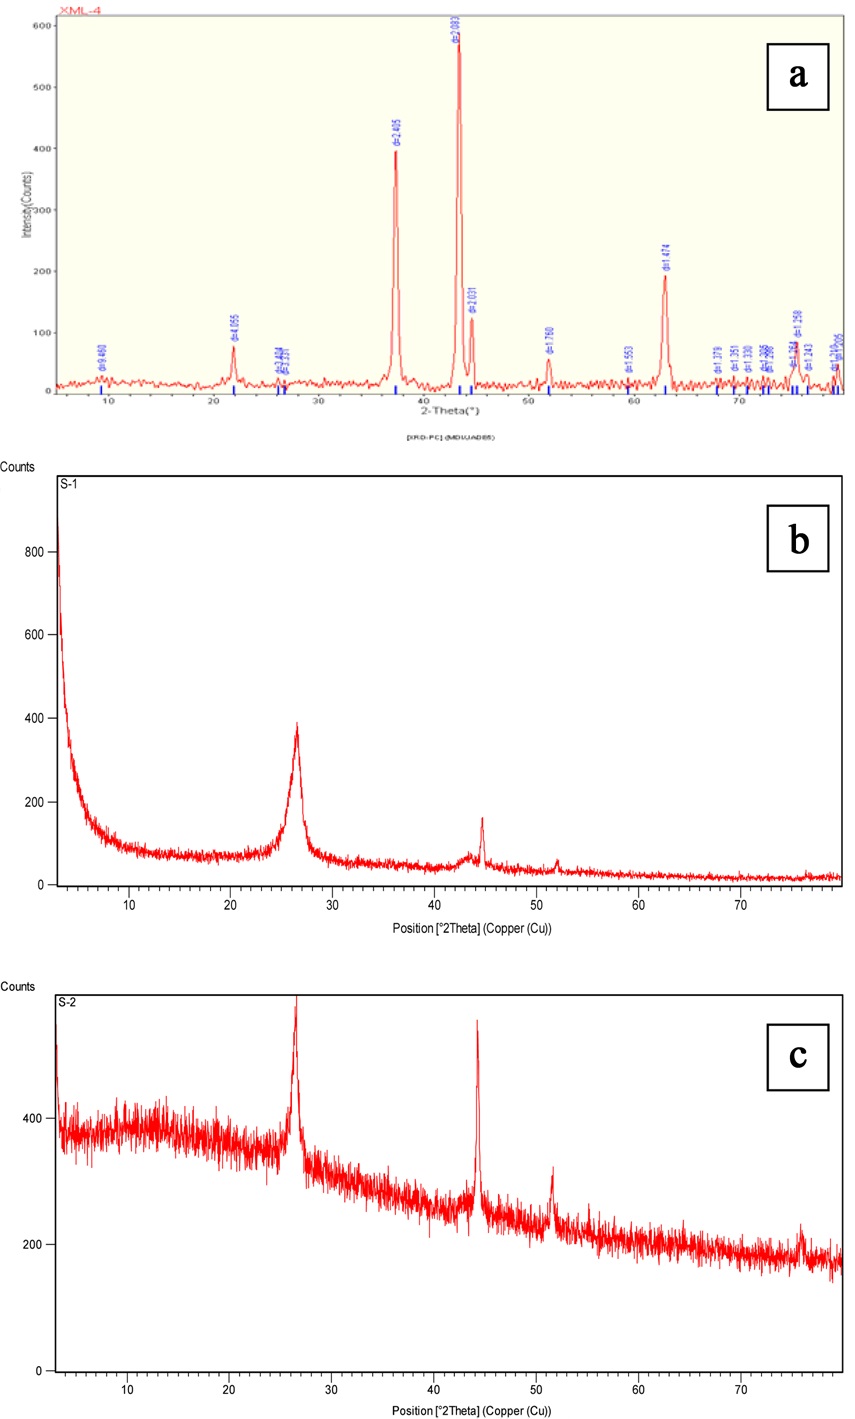
3.2.6. XRD analysis
This done only for those samples which showed CNTs. Typical XRD results of CNTs obtained from all three oils are presented
in Fig. 8. All of them show a diffraction peak at 26° {002}, which according to Garcia-Gutierrez et al. [9] is designated as graphitic carbon. Moreover, a peak at 44° can be observed in all three graphs; this peak is known to be associated with carbon {111}. The small peak present at 78° in the XRD result of castor oil is evidence of the presence of the silica, which may be due to the boat in which the catalyst was placed.
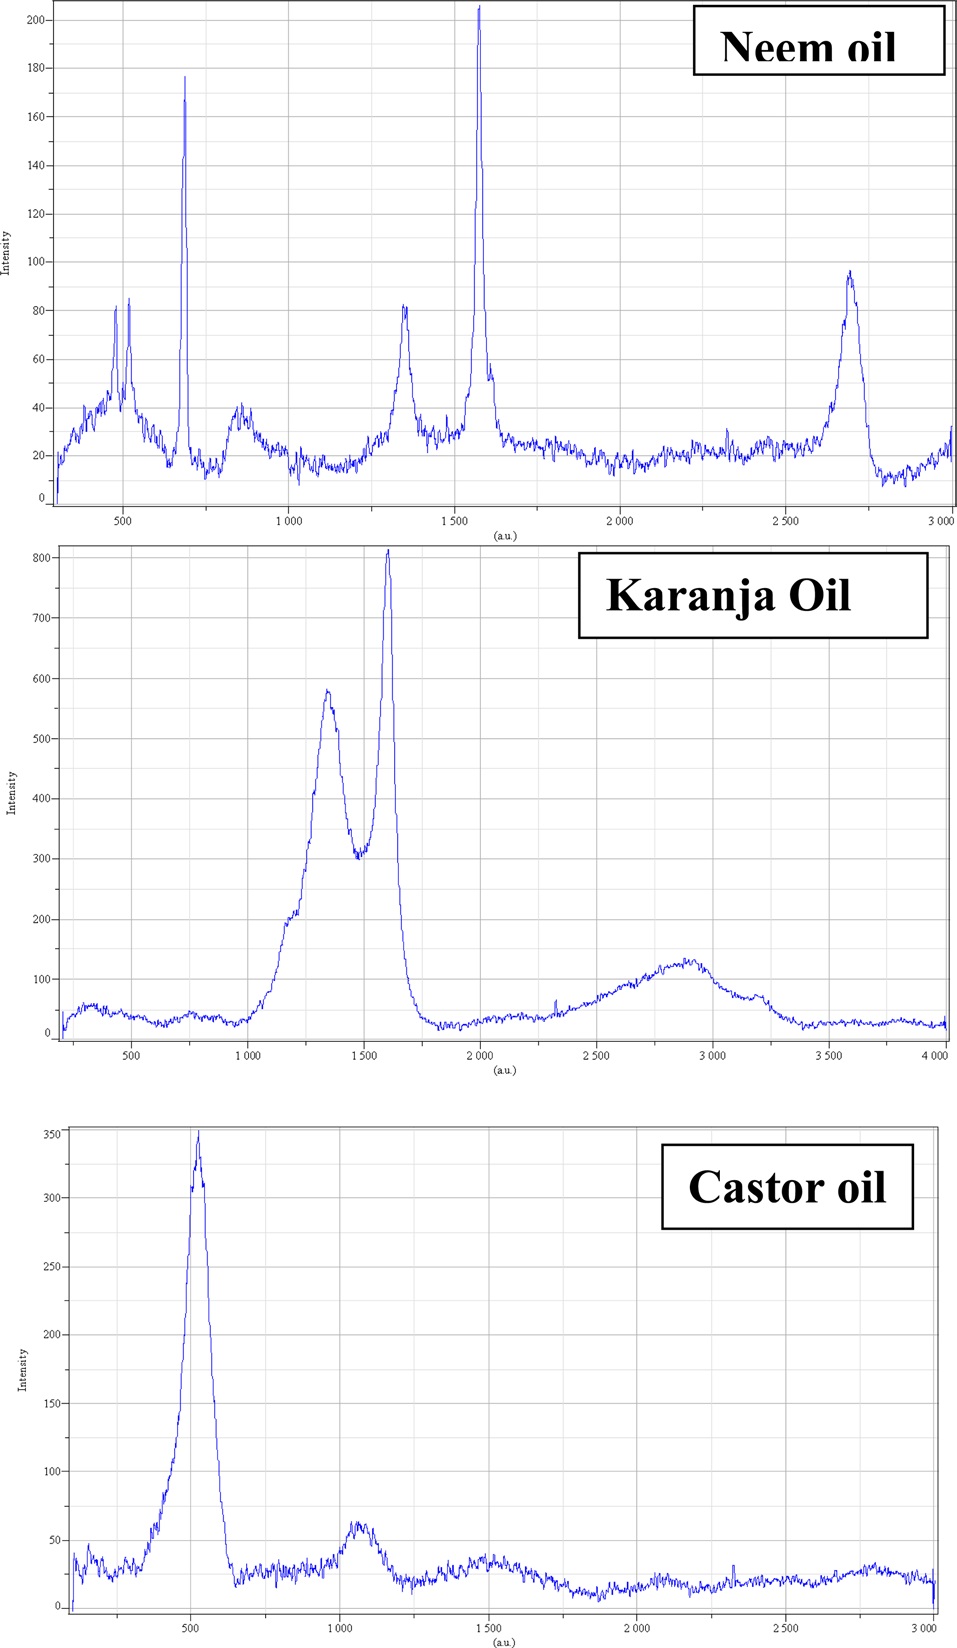
3.2.7. A Raman spectroscopic analysis
A Raman spectroscopic analysis of only the purified CNTs was done. CNTs obtained from all three oils show a D band as well as a G band, thus confirming its graphitic nature (Fig. 9). Raman spectroscopy is used to differentiate between graphite, multi-walled and single-walled CNTs, and layers. The Raman spectrum of each sample shows two typical peaks of MWCNT, one at around 1562 cm?1 and the other around 1318 cm?1, which correspond to the typical Raman peaks of graphitic carbon and defects in the graphitic carbon, respectively. The peak at 1562 cm?1 is attributed to the Raman active E2g in-plane vibrational mode and is related to the vibration of sp2-bonded carbon atoms in a two-dimensional hexagonal lattice. The peak at 1318 cm?1 is associated with the vibration of carbon atoms with dangling bonds in the plane terminations of the disordered graphite. In CNTs obtained from the neem and karanja oil, the intensity of the D-band peak is weaker than that of the G-band peak, which originates from the inplane showing fewer defects, i.e., more graphitic carbon and less disorder of the product, thus preventing the layer from extending [10]. However, the CNT synthesized from castor oil shows a stronger D band and a comparatively very weak G band, showing an intense peak at 500 corresponding to silicon. The XRD pattern of the CNT from castor oil also shows a small peak at 78° and as suggested above, this could be due to the boat in which the catalyst was placed.
All three non-edible oils were found to be good precursors for the synthesis of CNMs. The morphology of the nanocarbon produced was impacted by different parameters. However, both carbon nano beads and CNTs showed a graphitic nature. There is a possibility of standardizing the parameters for producing beads as well as multi-walled carbon nanotubes from these precursors using the CVD method.