Vapor-grown carbon nanofibers (VGCNFs) offer a less expensive alternative to carbon nanotubes (CNTs) while still providing stiffness [1] and strength improvements when added to an infusion-class thermoset polymeric resin such as vinyl ester (VE) [2-7]. VE is an inexpensive structural grade resin that represents an alternative to the traditional and more expensive epoxy resin systems often used in automotive applications due to its good strength, toughness, and chemical and corrosion resistance [8-13]. VE resins can be easily controlled in liquid forms at room temperature and provide enhanced chemical properties in comparison to other thermoset resins such as polyester or epoxy [14-19]. Recent works have shown that the addition of relatively small amounts (by weight) of nano-reinforcements (CNTs and CNFs) can significantly improve to the mechanical properties of polymer nanocomposites [4,20-35]. However, the literature also shows that an optimal nano-reinforcement loading level exists such that the addition of further amounts of nano-reinforcements past this optimal level actually degrade the properties of the resulting nanocomposites. This degradation was often attributed to the inability to disperse the nano-reinforcement phase properly past its optimal (weight) loading level. Previous work with the aforementioned VGCNF reinforced-VE system (VGCNF/VE) [36,37] has shown that this optimal nanofiber weight fraction is around 0.5%. However, advanced mixing techniques [38-40], such as a prolonged mixing time and a combination of extended mixing methods (ultrasonication and high-shear mixing), present the opportunity to increase the optimal nanofiber loading level by dispersing a greater quantity of nano-reinforcements [41,42] and enhancing the overall quality of reinforcement dispersion.
In this study, VGCNF/VE nanocomposites consistently contain a certain percentage of nanofibers, which were well dispersed uniformly throughout the system; however, some
Five material configuration test matrices accounting for three equally spaced levels of three distinct independent variables (the VGCNF weight fraction, high shear mixing time, and ultrasonication mixing time)
of the nanofibers remained agglomerated into nest-like regions, causing a reduction in the mechanical properties due to stress concentration sites emanating from these nanofiber clusters [43]. Therefore, both scanning electron microscopy (SEM) and transmission electron microscopy (TEM) images at successively higher magnification scales were taken to characterize both the distribution and concentration/density of the agglomerated nests as a whole and the well-dispersed individual fibers. The full scale of SEM resolutions was used to identify the volume fraction of the agglomerated clusters at lower magnifications (~500×) as well as the volume fraction of the well-dispersed individual fibers at higher magnifications (~3000×) using the point count method. Furthermore, TEM images were used to measure the characteristic size of the agglomerations, and the point count method was again used to approximate the volume fraction of the nanofibers within each agglomerated region for each material configuration. Finally, the macroscale mechanical properties of the resulting nanocomposite systems were measured under quasi-static uniaxial compression loading at an engineering strain rate of 10-3 s-1. The measured stiffness, yield strength, and ultimate strength were evaluated for each material configuration, and the mechanical properties were then related to the microstructural morphology and dispersion quality within each configuration.
2.1. Experimental design space
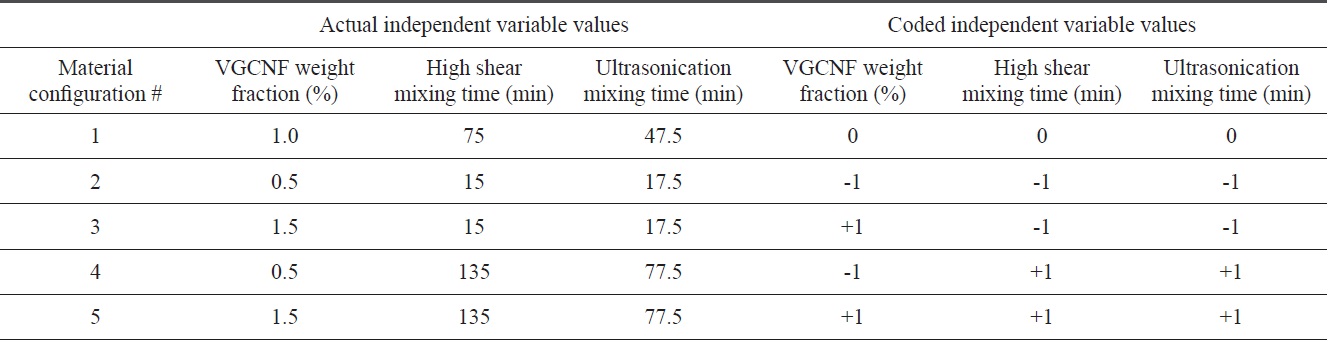
Three different independent variables were considered for this study: the carbon nanofiber weight fraction, the high shear mixing time, and the ultrasonication mixing time. Therefore, five distinct material configurations were considered in an attempt to account for the influence of these three independent variables on the observed mechanical properties under quasistatic uniaxial compression. These five configurations represent a subset of a 20-configuration, three-factor central composite face-centered (CCF) circumscribed design of experiments test matrix that spans the limits of each of the three independent variables. Similarly to the Box-Behnken design [44], the CCF design fits a statistical response surface through a sphere that is circumscribed within a cube representing the design domain of the independent variables. These types of statistically-based response surface models serve as an empirical and phenomenological means of guiding the functional form of future material constitutive model development, which may account for these three independent variables as regards the mechanical response. The CCF model requires that the independent variables take on three equally spaced values (i.e., a low, middle, and high value). Therefore, the first material configuration (1) represents the center point of the design domain with all three independent variables taking their middle values (1.0% weight fraction, 75 min high shear mixing, and 47.5 min ultrasonication). The second and third configurations (2 and 3) represent the low and high values, respectively, for the nanofiber weight fractions (0.5% and 1.5%), while both mixing techniques take their low values (15 min high shear mixing and 17.5 min ultrasonication). Finally, the fourth and fifth configurations (4 and 5) take low and high values, respectively, for the nanofiber weight fraction (0.5% and 1.5%), with both mixing techniques maintaining their high values (135 min high shear mixing and 77.5 min ultrasonication). Therefore, these five material configurations span the full range of the design space for the three independent variables and serve as a natural starting point for the full test matrix. Table 1 shows the actual level of the independent variables along with their corresponding coded values ranging from -1, 0, and 1 for the low, middle, and high values of each independent variable.
2.2. Material characterization techniques
2.2.1. SEM imaging
Fractography refers to the analyses of the fracture surfaces of materials through a variety of microscopic techniques [45-47]. To this end, SEM was used in both a qualitative sense to investigate the morphology of the microstructure and a quantitative sense to gain an understanding of relative proportions of the microstructural features and to quantify the degree of VGCNF dispersion. The JEOL JSM-6500F field emission-SEM model was used to image the microstructural characteristics/distributions of the five material configurations of interest. Special sample preparation steps, such as the sputter-coating of the sample with gold or palladium and drawing a vacuum around the sample, make SEM much more cumbersome and time-consuming than optical microscopy (OM), but SEM offers both a clearer resolution and greater magnification than OM for resolving details on the length scale of the nano-reinforcements of interest [48]. A typical sample of each material configuration was broken into manually to expose a fracture surface for cross-sectional imaging. The fracture surface was then sputter-coated with gold and placed into the sample chamber. Once the sample was sputtercoated and secured in the specimen chamber, an ultra-high vacuum (i.e., <10-9 torr) was set in the system to avoid contamination from atmospheric conditions. The range of SEM magnification was extended to its lower limits (~500×) to characterize bulk microstructure distribution features that cannot be seen at the highest magnification of OM (i.e., the distribution and concentration of agglomerated nanofiber regions that are poorly dispersed) and are much too large to capture with higher resolution microscopy techniques, such as TEM. The magnification of the SEM images was then incrementally increased gradually to resolve smaller length scale features, such as the distribution and concentration of well-dispersed individual nanofibers up to 3000×.
2.2.2. TEM imaging
In order to characterize the dispersion of VGCNFs, SEM was used to characterize the volume fraction of the agglomerations and the volume fraction of well-dispersed individual fibers. TEM images were also used at higher magnifications to measure the characteristic sizes of the agglomerated nests (~3000×-8000×) and the density of the nested regions (using the point count method to approximate the volume fraction of nanofibers within each nest) at magnifications greater than 10 000×. Images at the highest magnification give information about the quality of the nanofiber/matrix adhesion and wetting. A typical sample from each material configuration was sectioned for TEM imaging. Each sample was initially sectioned into a trapezoidal shape (0.6-0.8 mm thick) with a razor blade prior to using a 45° glass knife to cut the sections into 60-90 nm thick pieces using an ultramicrotome. The sections were then prepared on a mesh grid and imaged with the JEOL JEM-100CX II TEM. Multiple regions were examined from each sample in order to capture representative pictures of the dispersion within each material configuration.
2.2.3. Quasi-static uniaxial compression testing
Specimens were fabricated with 0.5-inch diameters with 1.5-inch-deep cylindrical mold cavities. Two compression specimens were cut from each plug of stock material such that the specimens maintained a length-to-diameter ratio of just less than one in order to eliminate global buckling behavior while maximizing the length of the gage section to ensure a uniform state of compression within the specimen. The specimens were then wet-polished on an automated polishing disk under running water using 1200 grit sandpaper. This procedure ensured that no edge defects contributed to a premature failure in the specimens and helped to eliminate frictional effects at the platen-specimen interface by smoothing the specimen faces and reducing the coefficient of friction between the platen-specimen interfaces. In a further attempt to maintain a uniform state of compression by minimizing the shear stress regime due to frictional effects at the platen-specimen interface, a thin film of lubricating grease was used to cover both interfaces of the specimen-free edges with the platens. This technique proved to be useful, as little to no barreling was observed during the tests or in the recovered post-tested specimens. The quasi-static uniaxial compressive response of each material configuration was characterized at an applied engineering strain rate of 10-3 s-1 in order to ensure an isothermal state of pure mechanical loading with no influences from temperature effects that manifest themselves at higher loading rates through the conversion of a percentage of the plastic work into internal heat generation within the sample. An Instron 5882 100 kN capacity screw-driven load frame was used to perform the tests, and an Instron 2630-106 mechanical extensometer with a gage length of 25 mm was clipped to the edges of the compression platens to measure the axial strain. Due to a limited number of specimens available for each material configuration, a total of three repeat tests were conducted for each material configuration. The three tests were then averaged for each material configuration by interpolating the measured stress values to constant increments of strain. The resulting stress values were then averaged at each constant increment of strain. The initial Young’s modulus was calculated by fitting a linear least squares curve through the initial linear regime of the true stress?true strain data after accounting for the toe correction. The peak yield stress was defined as the point at which the true stress?true strain curve first experiences a zero tangent modulus. Finally, the ultimate stress was defined as the maximum stress withstood just prior to compressive failure. These three material/mechanical properties were evaluated for each material configuration and compared to the quantitative information obtained from each microscopy technique.
3.1. SEM imaging and quantitative characterization of the bulk nanofiber dispersion
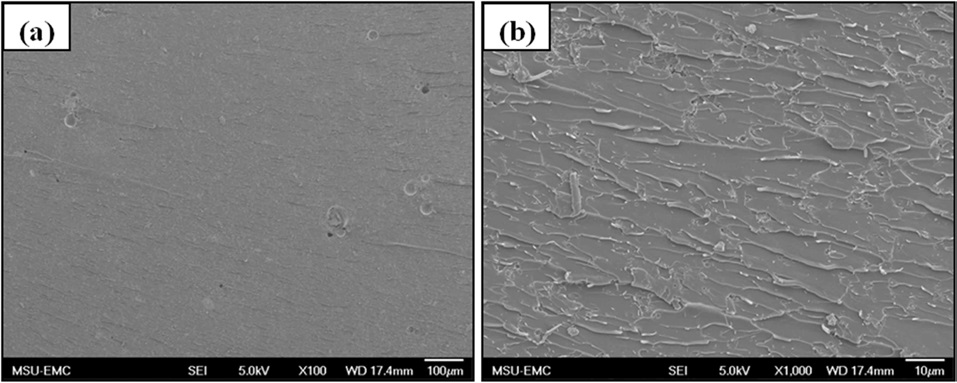
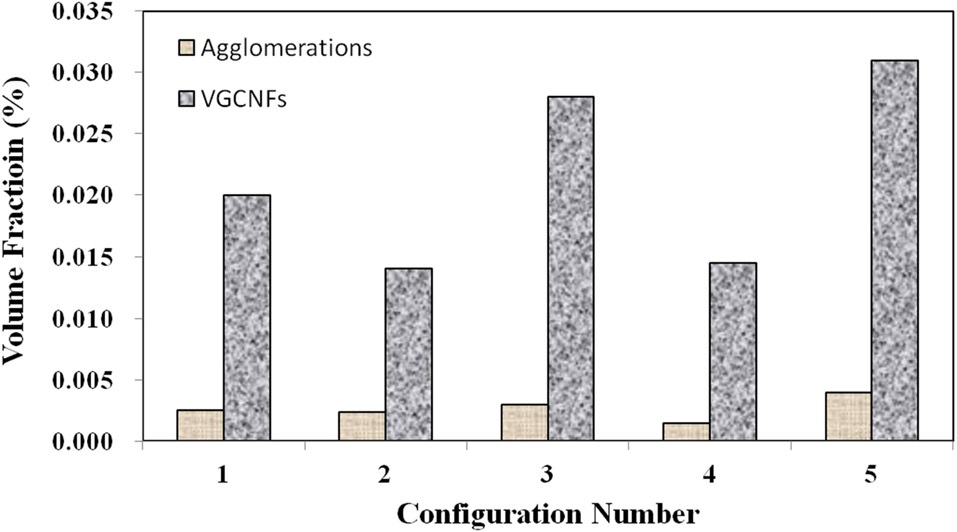
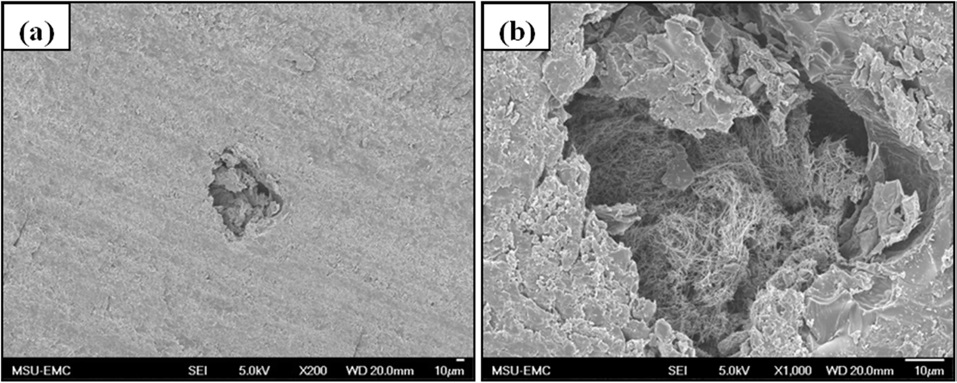
A series of SEM images in the range of 100×-500× magnification were used to characterize the overall number/volume of the agglomerated nests within each material configuration. The point count method was used to measure the average number of agglomeration regions within a given characteristic area/volume of a given image. Fig. 1a shows a typical image from the lower end of this magnification range for material configuration 1. This technique was used for each material configuration in order to approximate the average agglomeration volume fraction at this magnification range. A similar technique was employed at higher magnification ranges (~1000×-3000×) to obtain information on the average volume fraction of well-dispersed nanofibers as well.
Fig. 1b illustrates well-dispersed individual nanofibers at the lower range of these magnifications. Finally, Fig. 2 gives the bulk volume fraction of each phase in graphical form for all five material configurations. At these nanofiber loading levels, the bulk volume fraction of both phases is miniscule over the given representative volume. Configurations 2 and 4 both contain smaller initial amounts of nanofiber loadings. Therefore, these configurations lower volume fractions of each phase.
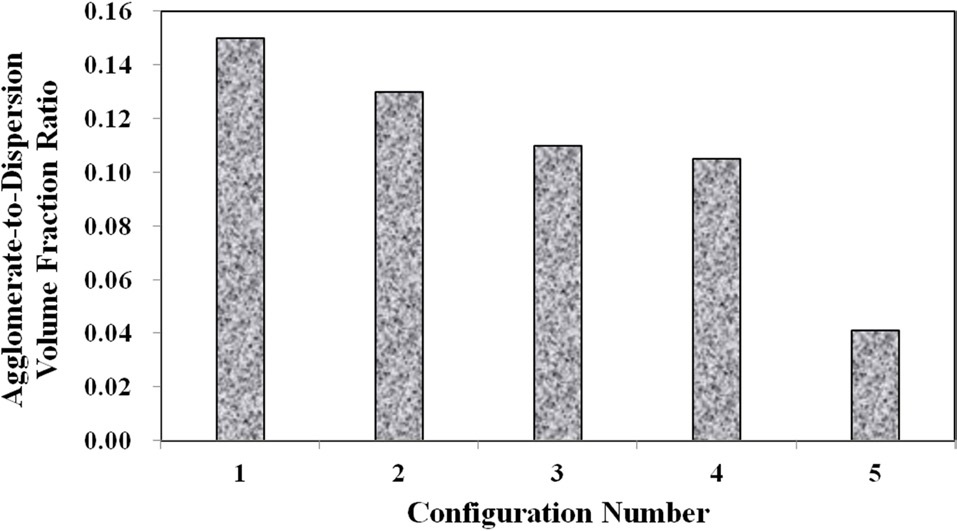
Meanwhile, configurations 4 and 5 show that at the higher mixing times, the ratio of well-dispersed VGCNFs to agglomerated VGCNFs increases as well. Furthermore, Fig. 3 calculates the ratio of the agglomeration volume fraction to the welldispersed fiber volume fraction. The extended mixing times in configurations 4 and 5 certainly prove to reduce the ratio of agglomerated fibers to well-dispersed fibers, while this ratio seems to decrease with further an increase in the weight fractions of the VGCNFs. This observation suggests that in general the fibers are more likely to disperse than to agglomerate; this trend is even more pronounced at higher nanofiber loading levels, where more fibers are available to interact with the mixing devices during the specimen fabrication process.
In addition to this insightful quantitative analysis of the SEM imaging of each material configuration, several additional SEM images were taken of each material configuration in order to assess the specimen quality (i.e., identify porous defects) and to determine the general dispersion characteristics. Material configuration 1 showed significant microstructural defects (Fig. 4). Porous cavities are seen in Fig. 4, and VGCNF agglomerations seem to aggregate around this defect. Fig. 4a shows a reduced magnification image at 200× in which the defect is still visibly obvious. Furthermore, Fig. 4b shows an entangled network of agglomerated nests within the cavity. This type of region can serve as a stress concentration site when the specimens are mechanically loaded. Furthermore, these types of porous cavities act as microvoids, reducing the bulk material stiffness properties in addition to promoting premature failure initiation. Both of these effects can be noticed in the mechanical properties of material configuration 1. However, it should be noted that such defects and images are not representative of the bulk sample as a whole, nor are they meant to be. Such images are simply meant to illustrate the processing difficulties that still exist when fabricating polymer nanocomposites and to correlate the measured mechanical responses to these observed microstructural features.
3.2. TEM imaging and quantitative characterization of local nanofiber agglomerates
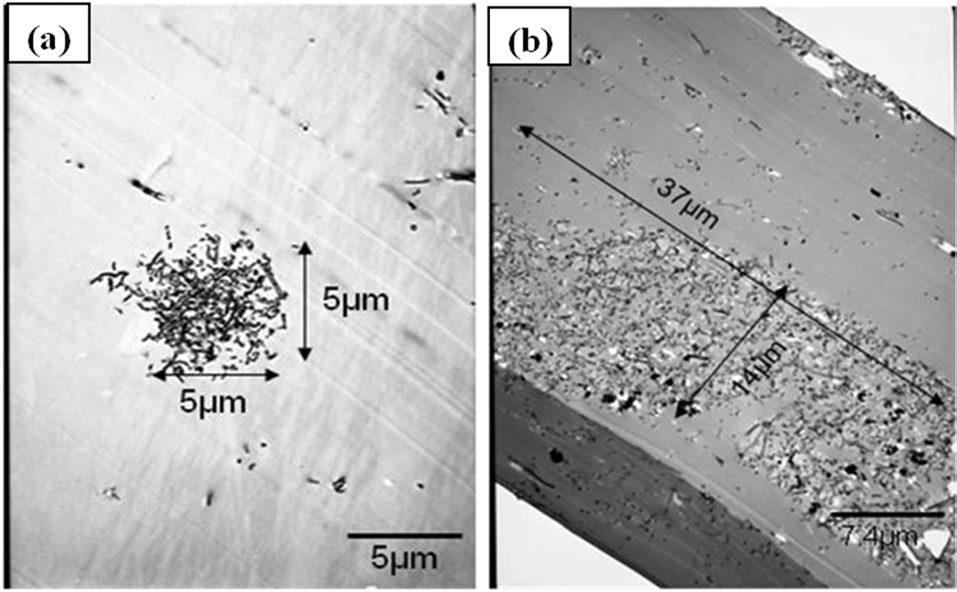
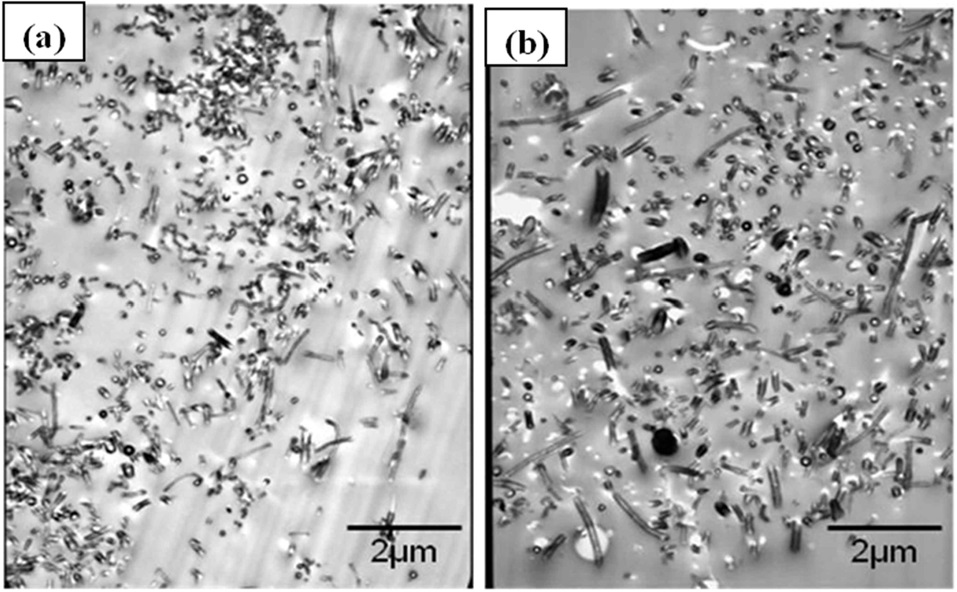
In addition to SEM images at lower magnification scales to quantify the bulk dispersion characteristics, TEM images at higher magnification levels were used to quantify the characteristic size and density of the agglomerated nests of fibers for each material configuration. Fig. 5 shows the characteristic images used to quantify the average size of the agglomerations for each material configuration. Figs. 5a and b show the disparity in the size differences in the agglomerated regions at the lowest mixing times as the VGCNF weight fraction is increased from 0.5% (material configuration 2) in Fig. 5a to 1.5% (material configuration 3) in Fig. 5b. Although the SEM images showed that the ratio of agglomerated fibers to well-dispersed fibers decreased with an increase in the weight fractions of VGCNFs, the difference in both the size and density of the agglomerated regions in the samples with higher VGCNF weight fractions proves to affect the yield strength of these material configurations adversely, as the compression data shows in the following section.
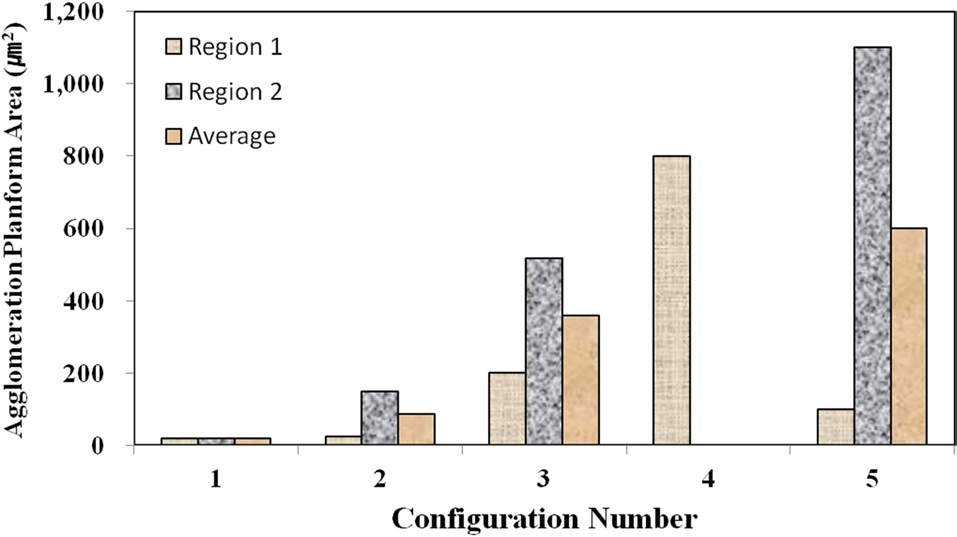
Fig. 6 shows the agglomeration planform area at two regions in TEM samples for each material configuration, except for the configuration 4, as measured through the TEM images. Configuration 4 had to be imaged at a higher resolution in SEM to obtain the quantitative measurements. Interestingly, the configurations with higher mixing times (4 and 5) have some of the largest agglomerations with respect to the planform area. However, Fig. 7,
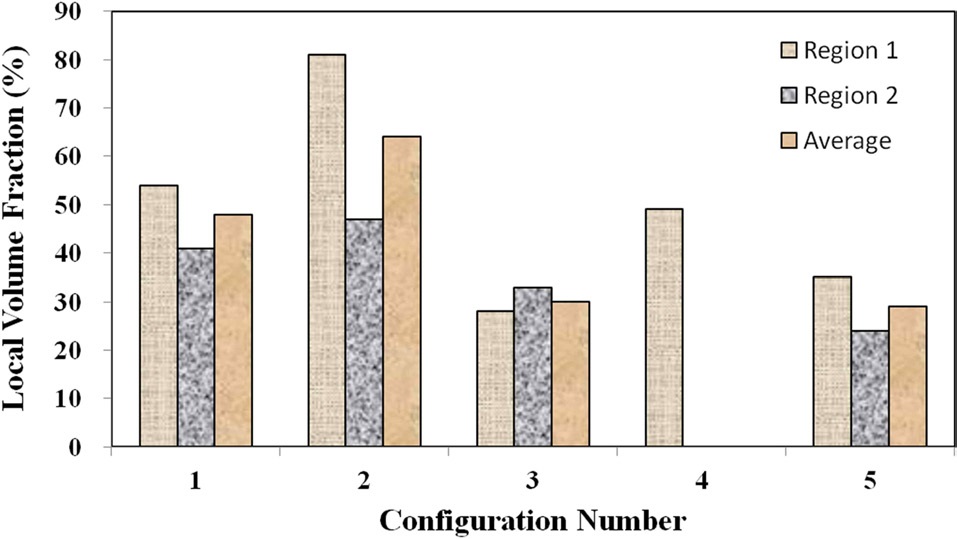
which shows the local fiber volume fraction within two agglomeration sites for each material configuration, demonstrates that the two configurations with higher mixing times (4 and 5) also show lower nanofiber densities within the agglomerates than configurations 1 and 2. Therefore, the agglomerations in configurations 4 and 5 were found to be spread out over a larger surface area, but the agglomerated sites in these advanced mixing time specimens were far less dense than their weight fraction counterpart samples at the shorter mixing times (2 and 3).
Although configuration 3 seemingly inexplicably exhibits a lower nanofiber volume fraction within each agglomerate, this phenomenon can be attributed to the elevated nanofiber loading level in configuration 3 in comparison to 4. Given that the same volume of resin was prepared for each material configuration, the agglomerations in the configurations with higher nanofiber weight fractions have a statistically higher probabilities of coming into direct contact with the mixing mechanisms, even with significantly shorter mixing times. Therefore, the trends observed at this microstructural level make physical sense and do not seem to be arbitrary in nature. Fig. 8 shows characteristic TEM images at higher magnifications as used to calculate the local nanofiber volume fraction within individual agglomerated regions. As shown in this figure, the fiber-matrix adhesion and wetting seem to be adequate, even within the densest agglomerations.
3.3. Quasi-static uniaxial compressive response
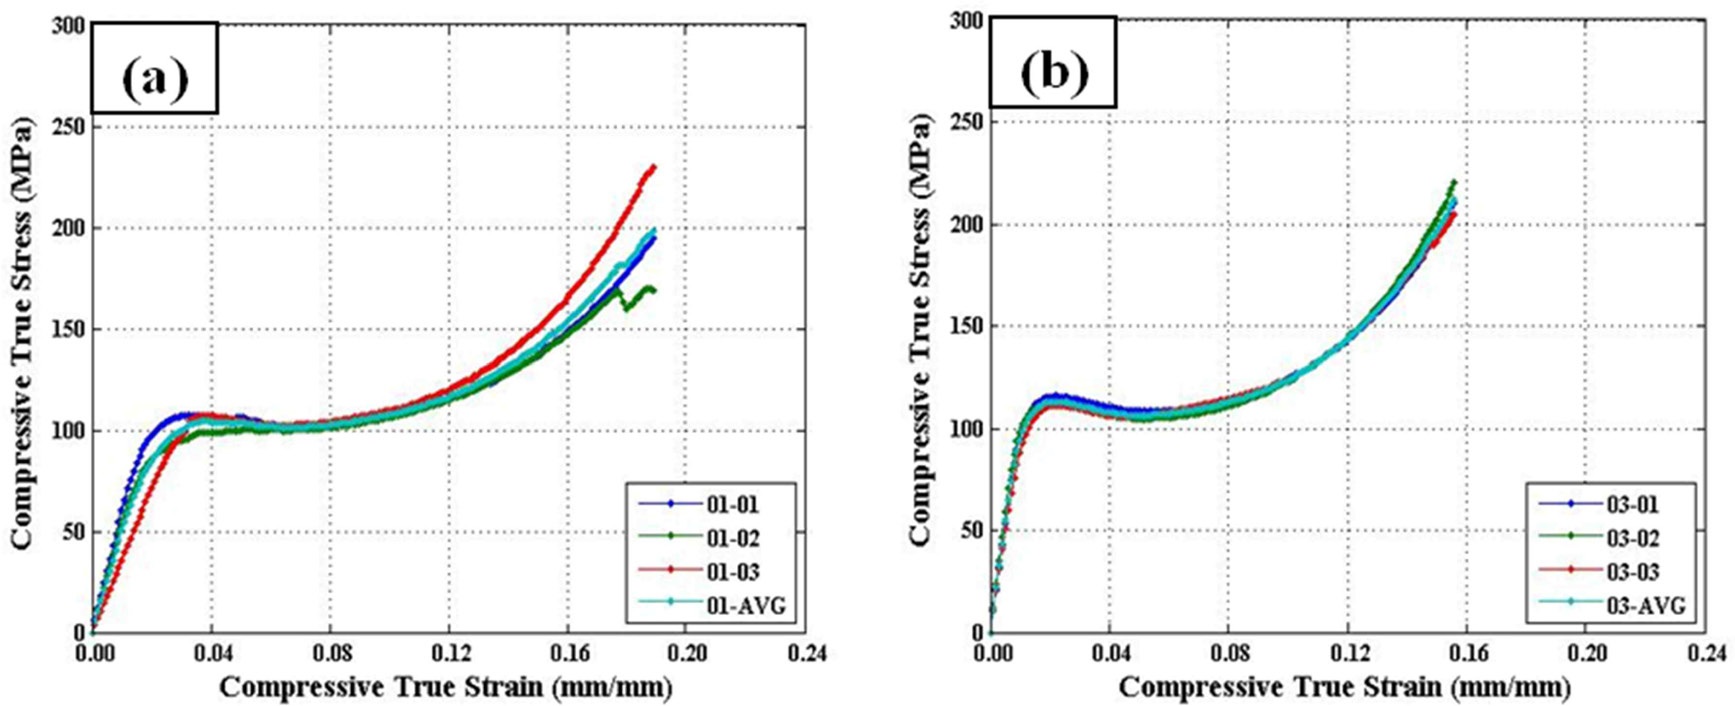
Three repeat quasi-static uniaxial compression tests were performed for all five material configurations. Reasonable repeatability was shown across all configurations (c.f., Fig. 9). It is important to note that the widest scatter was seen in configuration 1, which was documented in Section 3.1 (see Fig. 4) to have issues with defects within some areas of the sample.
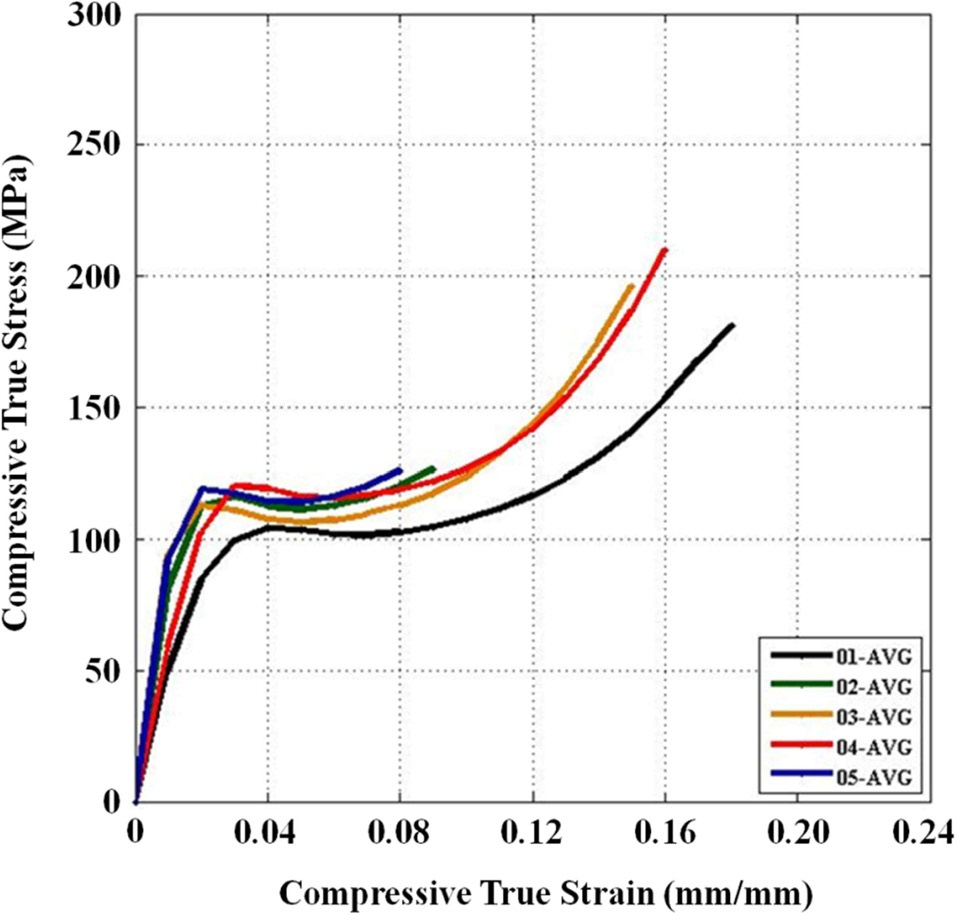
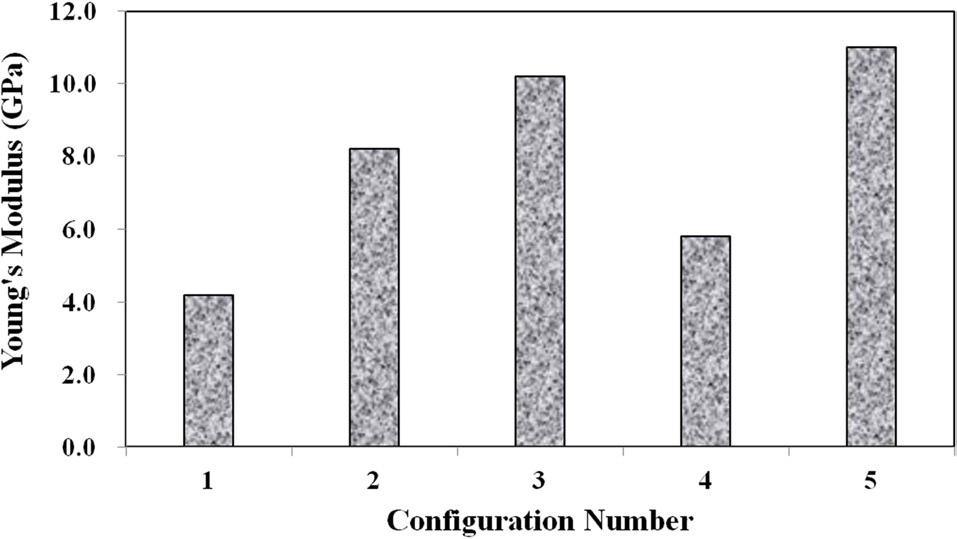
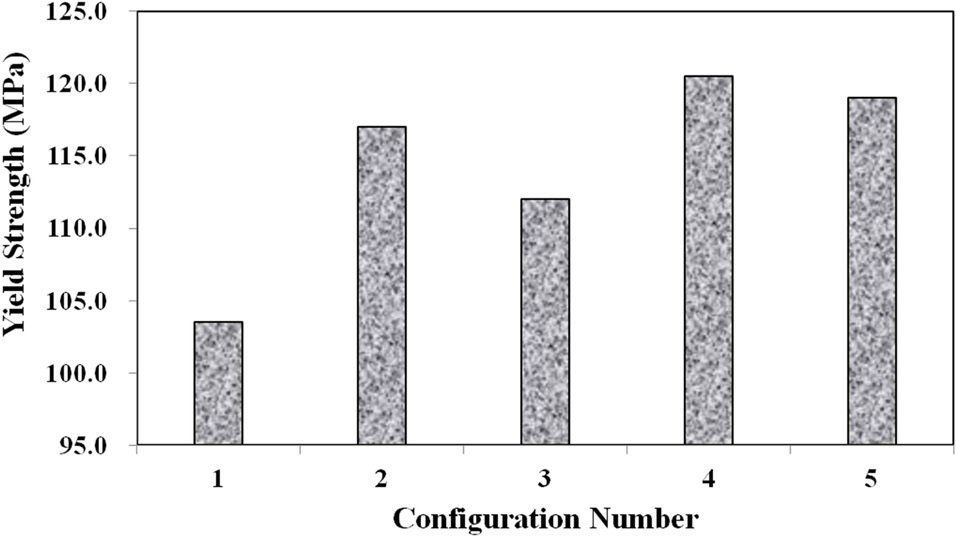
Three main material properties were documented for the compression tests: the Young’s modulus, peak yield strength, and ultimate strength. Fig. 10 shows the average true stress ? true strain response of the three repeat tests at each configuration plotted against each other, which provides a nice visual frame of reference for the relative magnitudes of the differences in the material properties of interest. Figs. 11 and 12 show these material property values plotted against each other for all five material configurations. These figures show that the two configurations with higher VGCNF weight fractions (3 and 5) display the greatest stiffness, with each configuration having a modulus that exceeds 10 GPa (compared to 3.0-3.5 GPa in both the literature and tensile tests of neat VE resin). This result suggests that the lower densities but larger planform areas of the agglomerations
in configurations 3 and 5 do not degrade the stiffness of the nanocomposites. The lower density agglomerations allow for the load to be sheared through the resin into the fibers through the interface/interphase region. Furthermore, both configurations 3 and (especially) 5 have low agglomerate-to-dispersed nanofiber ratios, which suggest that the well-dispersed portion of the fibers is able to carry a significantly higher portion of the load in these configurations. Furthermore, Figs. 10-12 also that although configuration 5 displayed the second highest yield strength, it shows significant adverse effects at finite strains and gives the lowest ultimate strength along with the lowest elongation at failure. This behavior suggests that configuration 5 would lead to an overly stiff material that fails abruptly and catastrophically. As the well-dispersed fibers carry more of the load in the elastic regime, resulting in a substantially higher modulus, the
surrounding matrix cannot withstand the local load spikes as the fibers begin to break and redistribute the load that they were carrying back into the matrix. However, while having the second lowest modulus with a value of only 6.10 GPa, configuration 4 with 0.5% VGCNFs mixed at the highest mixing times exhibits the highest strength properties for both the yield and ultimate strengths.
This result suggests that the fibers do not necessarily have to be primary load-carrying components in order to provide strength benefits. The same general characteristics of the microstructure that allowed configurations 3 and 5 to realize such drastic improvements in its stiffness properties also allow configuration 4 to experience the highest strength properties of larger, less dense agglomerations and a low ratio of agglomerated-to-dispersed nanofibers. However, configuration 4 simply contains three-fold fewer fibers (by weight) than configurations 3 and 5. Therefore, the stiffness properties are reduced in comparison, but the fibers are still able to inhibit the classic polymer deformation and/or damage mechanisms, such as molecular chain motion and free volume cavitation, which then leads to craze initiation and full-blown matrix cracking. Even lower weight fractions of VGCNFs (when dispersed uniformly enough) can contribute to significant strength improvements without realizing as much improvement in the elastic stiffness response. These results suggest that both stiffness and strength likely cannot be optimized simultaneously with the same material configuration parameters. While some instances require high-strength materials, many design applications are governed by deformation limits, not strength requirements. Therefore, practicing engineers must use sound engineering judgment when deciding to optimize the stiffness or strength for a given application using such material systems.
Five VGCNF-VE nanocomposite configurations were fabricated, characterized, and mechanically tested in order to provide insight into the influence of and interactions between the three independent variables (the VGCNF weight fraction, high shear mixing time, and ultrasonication mixing time) as regards both the microstructural morphology (nanofiber dispersion) and the observed mechanical response from quasi-static uniaxial compression tests. Three techniques were used to characterize the materials, two microscopy imaging techniques (SEM and TEM) along with one mechanical response characterization technique (compression testing). Furthermore, each of the three techniques provided information at different length scales about the composition and distribution of the microstructural features. Compression testing provided information at the continuum-level length scale about the effects of the lower length-scale features on the observed macroscale response. SEM imaging was used to provide information about the distribution of nanoscale features at the micro-to-meso scales, while TEM images were employed to derive microstructural information from the nanoscale and within the nanoscale. Both quantitative and qualitative information was obtained from each technique in order to qualify and understand the mechanisms at work at each successively characterized length scale. All of these features and effects must not only be characterized but should also be fully understood from a conceptual standpoint.