The European bumblebee, Bombus terrestris, has been commercially introduced in several parts of the world including South Korea and neighboring countries (Iwasaki, 1995; Mitsuhata, 2000). Despite its importance for crop pollination, the side effects, such as competition among bumblebee species (Inoue et al., 2008) and disturbance of pollination of other bumblebees adapted to a specific crop (Dohzono et al., 2008) have also been reported. In South Korea, an interspecific hybridization, genetic contamination, and competitive copulation between B. terrestris and B. ignitus have also been reported under laboratory conditions (Yoon et al., 2009). Thus, a substantial effort has been directed at establishing an artificial mass rearing system for B. ignitus in order to substitute the B. terrestris (Yoon et al., 2002).
Currently, B. ignitus is under commercialized by several companies in South Korea. Once field-released, the bumblebee populations that have been adapted to local environment may possibly be replaced by artificial ones, which could reduce local genetic diversity and fitness (Kawecki and Ebert, 2004). Therefore, knowledge on genetic diversity and geographic relationships of B. ignitus is essential for long-term preservation and artificial selection. Nevertheless, studies on bumblebee in this regard have been extremely limited for South Korean populations (Lee et al., 2006). Under such circumstances, Tokoro et al. (2010) recently reported that B. ignitus occurring in Japan is slightly, but obviously different from those of South Korea and China by sequencing 1,048 bp of the CO gene of mitochondrial DNA (mtDNA). However, this conclusion was made on the basis of a single population from each Korea and China, and, thus, further confirmation may be required using additional populations.
In this study, therefore, we collected a total of 88 individuals of B. ignitus from nine South Korean localities, and sequenced 658 bp of the mitochondrial COI gene and complete internal transcribed spacer 2 (ITS2) from nuclear ribosomal RNA. The sequence information was subjected to the analysis of population genetic structure with the inference of genetic diversity and genetic relationships for South Korean populations. Further, COI sequences were combined with those of Tokoro et al. (2010) to better understand the geographic variation of the Korean populations relative to Japanese populations. The COI region we employed corresponded to the “DNA Barcode” region (Hebert et al., 2003), which has been used to provide insight into the patterning of withinspecific genomic diversity (Hajibabaei et al., 2007). The nuclear ITS2, which is located between the 5.8S and 28S rRNA genes, has been broadly investigated in population genetic and contemporary gene flow studies (Mukabayire et al., 1999;
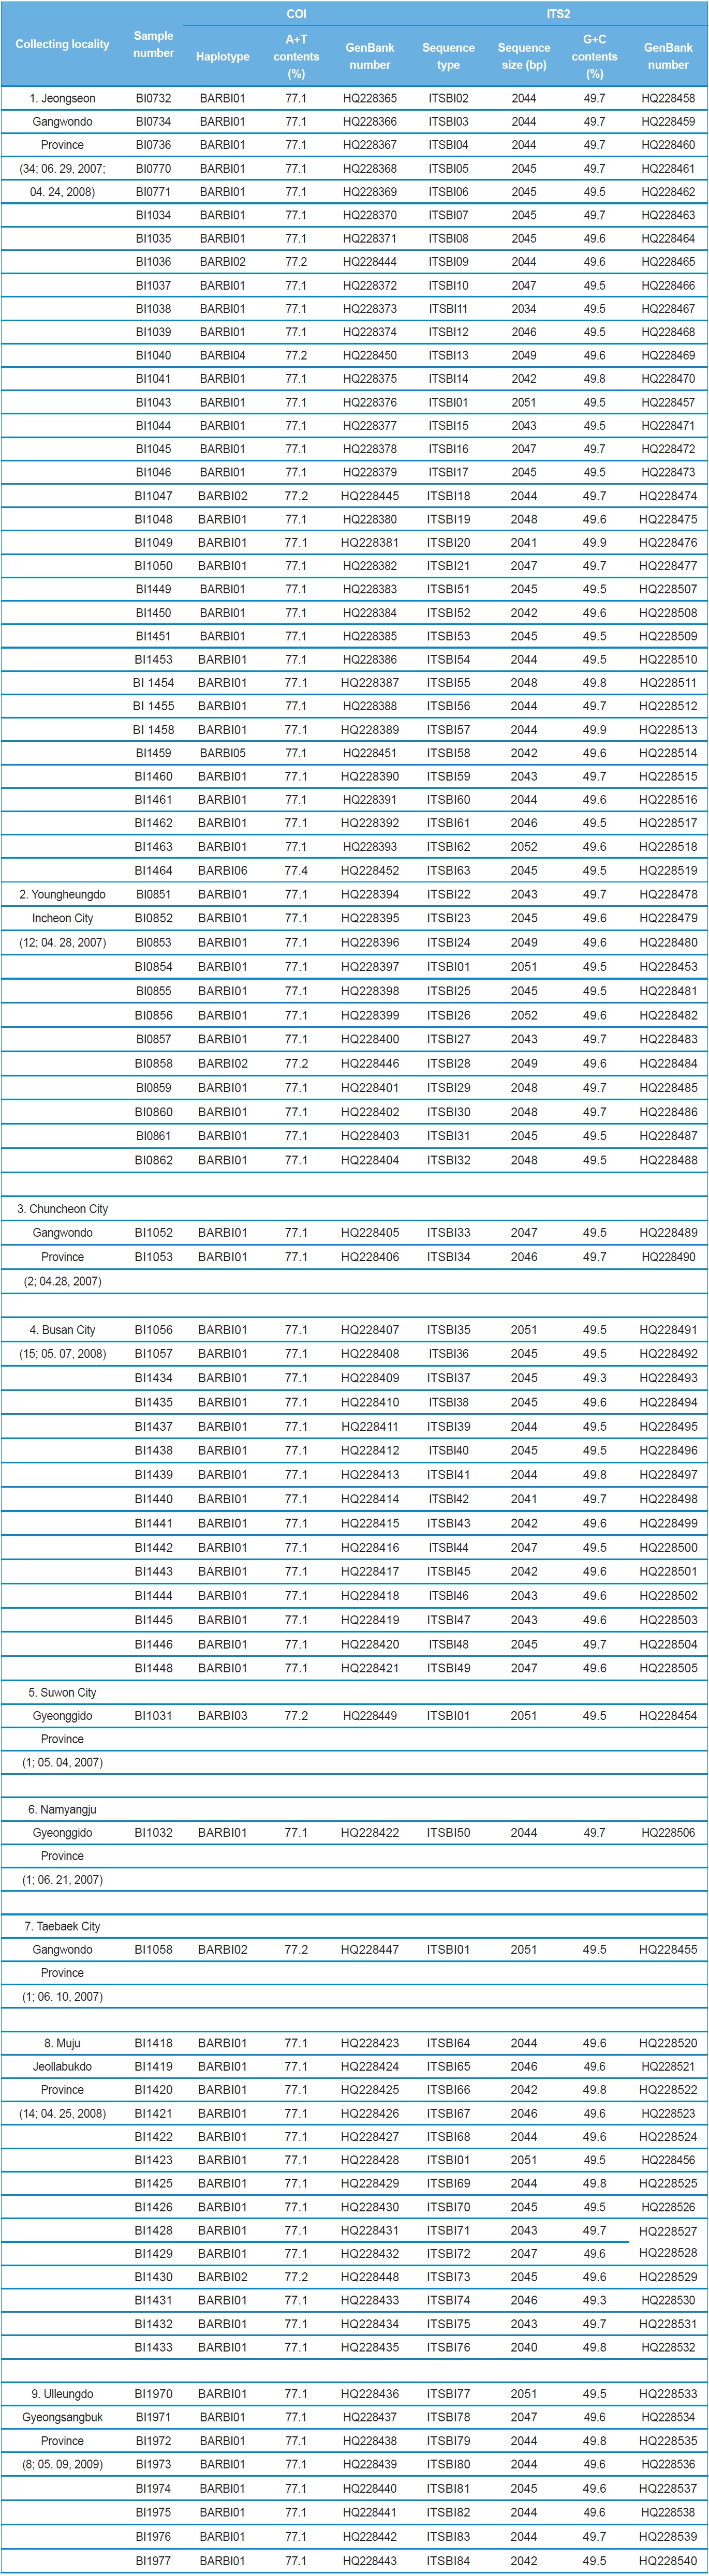
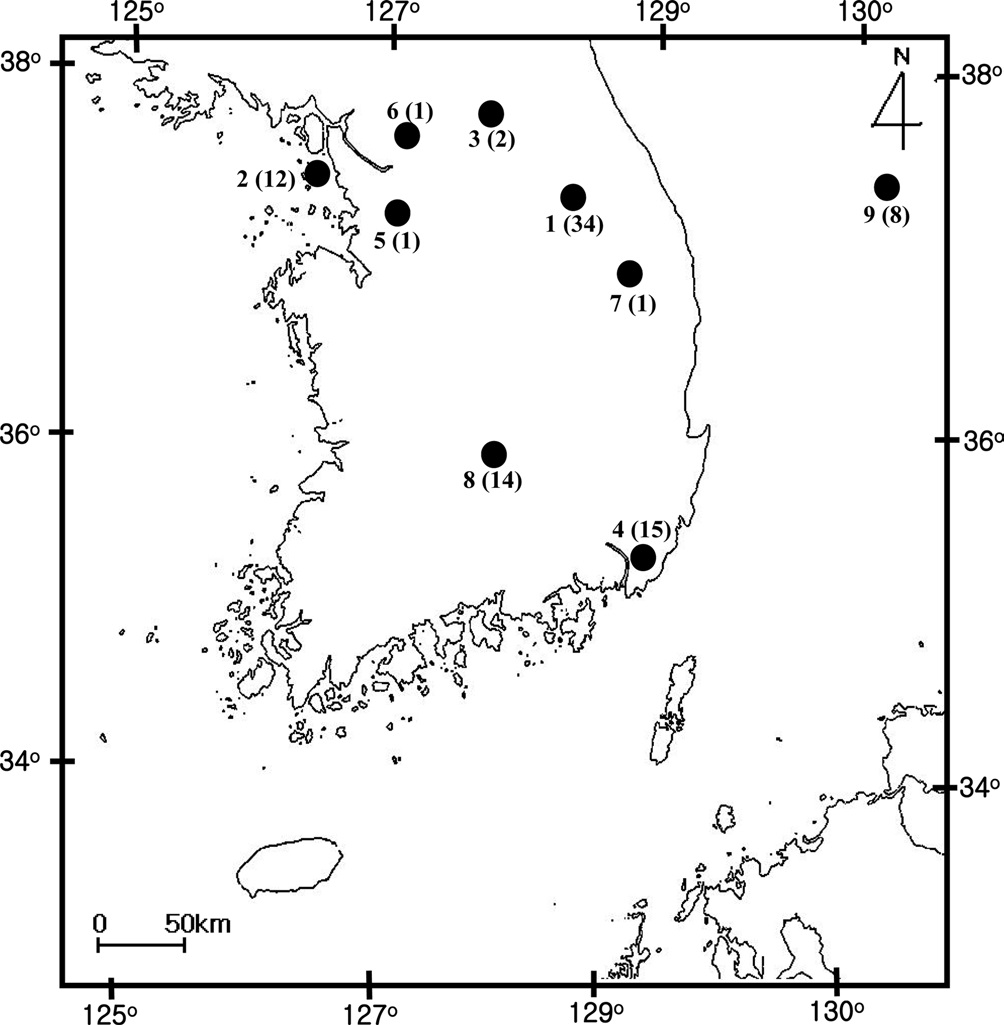
[Fig. 1.] Sampling location of Bombus ignitus in Korea. General
locality names and number of sequence indicated are as follows: 1,
Jeongseon, Baekjeon-ri, Gangwondo Province; 2, Youngheungdo,
Incheon City; 3, Chuncheon City, Gangwondo Province; 4,
Busan City; 5, Suwon City, Gyeonggido Province; 6, Namyangju,
Gyeonggido Province; 7, Taebaek City, Gangwondo Province;
8, Jungseon, Gangwondo Province; and 9. Muju, Jeollabukdo
Province.
Marcilla et al., 2001).
A total of 88 B. ignitus was collected from nine localities around the beautiful corydalis Colidalis speciosa (Fumariaceae) and the cherry blossom Prunus yedoensis (Rosaceae) in South Korea. Although most sampling was performed for only one day, those from Jeongseon (locality 1) were mingled with two days samples, resulting in the highest sampling size (Table 1). Regardless of similar sampling effort, more individuals were collected successfully in some localities when compared with others. Sampling locality, number of individuals, date of collection, and GenBank accession numbers for individual COI and ITS2 sequences are provided in Table 1 and the locality map is shown in Fig. 1.
Total DNA was extracted with a Wizard Genomic DNA Purification Kit, in accordance with the manufacturer's instructions (Promega, USA). A 658-bp region of the mitochondrial COI gene corresponding to the “DNA Barcode” region (Herbert et al., 2003) was amplified using a pair of primer sets reported by Kim et al. (2009). For the amplification of ITS2, the primers NG02955 and AB052895 located on the 5.8S and 28S rDNAs, respectively, were successfully used (Ji et al., 2003). In order to complete the entire ITS2 the internal primer BITSF, 5’-CGTAGTGTTGTCCTCGTGACCGA-3’, was designed from the conserved region of the B. ignitus ITS2 sequences.
For amplification of the COI gene, PCR was conducted under the following conditions: an initial denaturation step at 94℃ for 7 min, a 35-cycle amplification (94℃ for 1 min, 54~56℃ for 1 min, and 72℃ for 1 min), and the final extension step for 7 min at 72℃. For amplification of ITS2, PCR was conducted under the following conditions: an initial denaturation step at 94℃ for 7 min, a 35-cycle amplification (94℃ for 40 sec, 55~64℃ for 20 sec, and 72℃ for 20 sec), and the final extension step for 2 min at 72℃. Although COI amplicons were directly sequenced, those of ITS2 were cloned into a pGEM-T Easy vector (Promega, USA). XL1-Blue competent cells (Stratagene, USA) were transformed with the ligated DNA, and the resultant plasmid DNA from one clone per individual was isolated with a Plasmid Miniprep Kit (Dyne Bio Inc., Korea). Sequencing was performed using the ABI PRISM® BigDye® Terminator v3.1 Cycle Sequencing Kit with an ABI 3100 Genetic Analyzer (PE Applied Biosystems, USA).
COI gene and ITS2 sequenc es were delimitated and aligned using MAFFT ver. 6 (Katoh et al., 2002). The boundary decision to remove 5.8S at the 3′ end and 28S at the 5′ end of the ITS2 sequence was made using the Hidden Markov Modelbased ITS2 annotation software (Keller et al.,, 2009). When the homologous sequences from two individuals differed by one or more nucleotide bases (for both COI and ITS2) or one insertion/deletion (indel) position (for ITS2), the sequences were considered different haplotypes (for COI) or sequence types (for ITS2). Haplotype or sequence type designations were applied to new sequences as they were discovered (i.e., BARBI01, BARBI02, and BARBI03 for COI, and ITSBI01, ITSBI02, ITSBI03 and so on for ITS2).
For the alignment of the indel-containing ITS2 region sequences, GBlocks version 0.91b software (Castresana, 2000) was used to select conserved regions for the subsequent phylogenetic and population level analyses. Resultantly, a total of 84 ITS2 sequence types with 2,034~2,052 positions, including gaps from 84 ITS2 sequence types with ~2,068 positions were obtained, conserving 96% of the original sequences.
To determine the relationships among the COI haplotypes, among ITS2 sequence types, and to detect any describable groups, phylogenetic analysis was conducted via the maximum-parsimony (MP) method (Fitch, 1971) using PAUP* (Phylogenetic Analysis Using Parsimony and Other Method*) ver. 4.0b10 software (Swofford, 2002) and Bayesian Inference (BI) method using MrBayes ver. 3.1 (Huelsenbeck and Ronquist, 2001), respectively. The analysis for the MP method was conducted by heuristic search. The reliability of the trees was assessed by 1,000 iterations of bootstrapping (Felsenstein, 1985).
For the BI analysis, the substitution model was selected by comparing Akaike information criterion scores (Akaike, 1974) using Modeltest ver. 3.7 (Posada and Crandall, 1998). The best-fit model selected was GTR (Lanave et al., 1984) + I + G for the COI gene and K80 + G (Kimura, 1980) for ITS2. The confidence values of the BI tree were presented as the Bayesian posterior probabilities in percentages (BPP). The homologous regions of the within-generic species B. ardens were adapted, respectively, from Kim et al. (2009) for the COI gene and Oh et al. (2009) for ITS2 as an outgroup to root the trees.
Haplotype (COI) or sequence type (ITS2) relationships were determined using the median-joining algorithm (Bandelt et al., 1999) incorporated in SplitsTree ver. 4.11.3 (Huson and Bryant, 2006). This method adds to the network median vectors (consensus sequences) by starting with the minimum spanning trees combined within a single network. Such vectors can be interpreted as possibly extinct unsampled sequences or extinct ancestral sequences (Bandelt et al., 1999).
Haplotype and nucleotide diversity, both of which are reflective of genetic diversity within each locality, were determined using Arlequin ver. 3.5 (Excoffier and Lischer, 2010), whereas maximum sequence divergence within each locality was estimated by extracting within-locality estimates of unrooted pairwise distances from PAUP* ver. 4.0b (Swofford, 2002). The population pairwise genetic distance (FST) and a permutation test for its significance (1,000 bootstraps) were evaluated using Arlequin ver. 3.5 (Excoffier and Lischer, 2010). Pairwise Nm (the product of the effective population size, Ne, and migration rate, m) values were employed to estimate the pairwise FST based on the equilibrium relationship: FST = 1 / (2Nm + 1) for the COI gene and FST = 1 / (4Nm + 1) for ITS2. For these estimates only populations with more than two individuals, possessing more than two haplotypes for the COI gene or more than two sequence types for ITS2 were subjected to analyses. Genetic relationships among populations and sets of populations were assessed by the Holsinger and Mason-Gamer (H-MG) method (1996). A detailed rationale of this method is described in the original study of Holsinger and Mason-Gamer (1996).
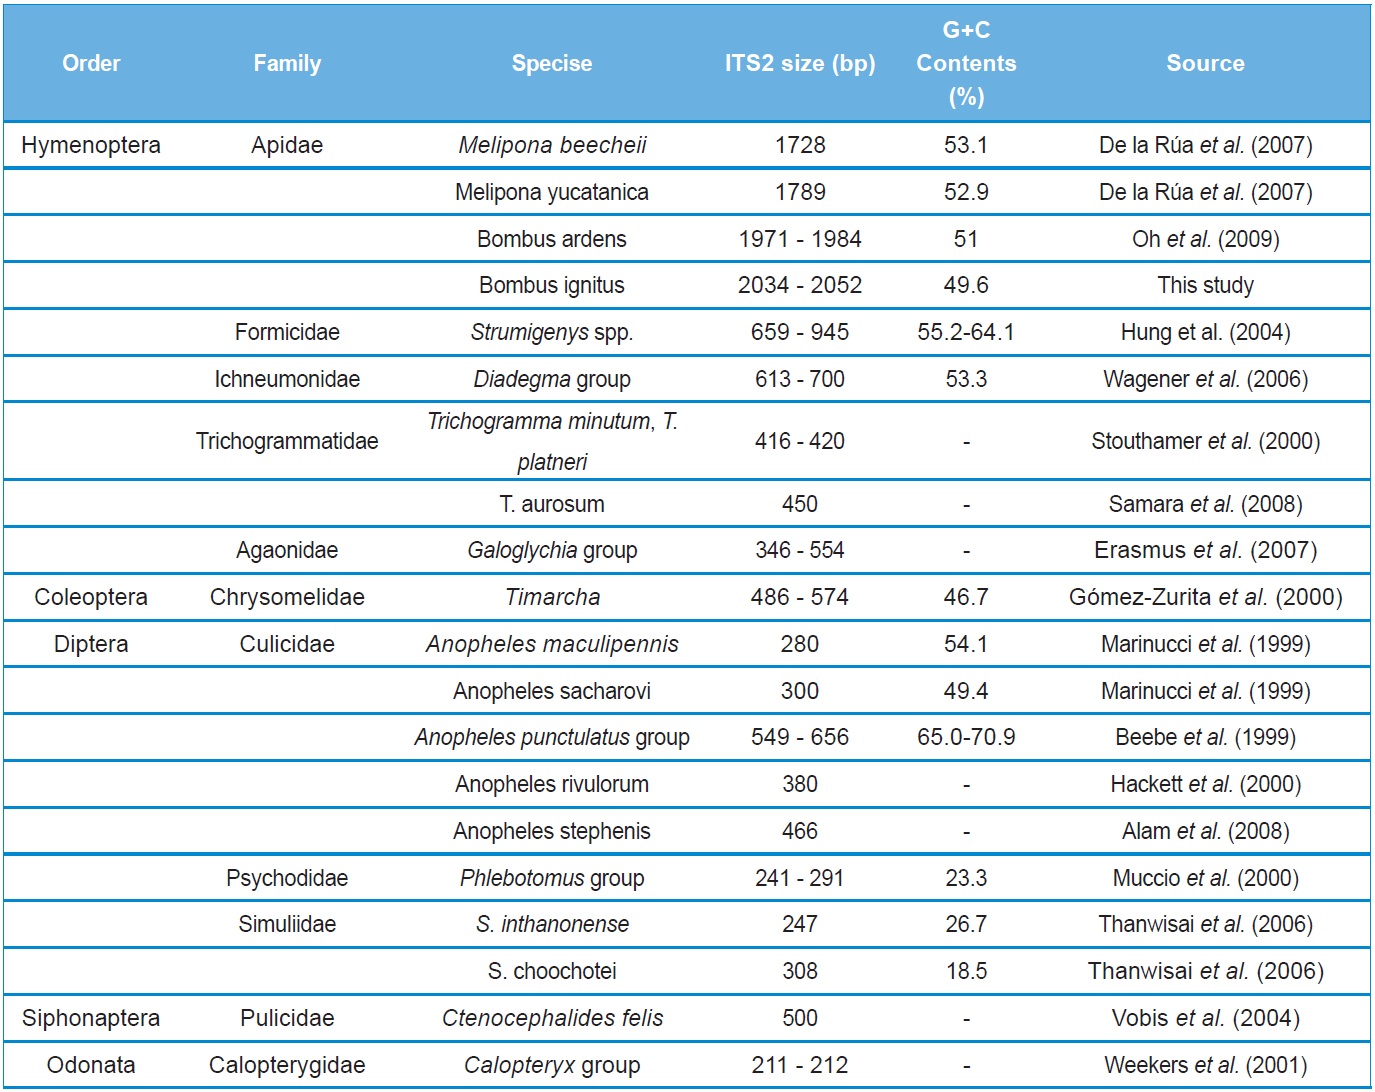
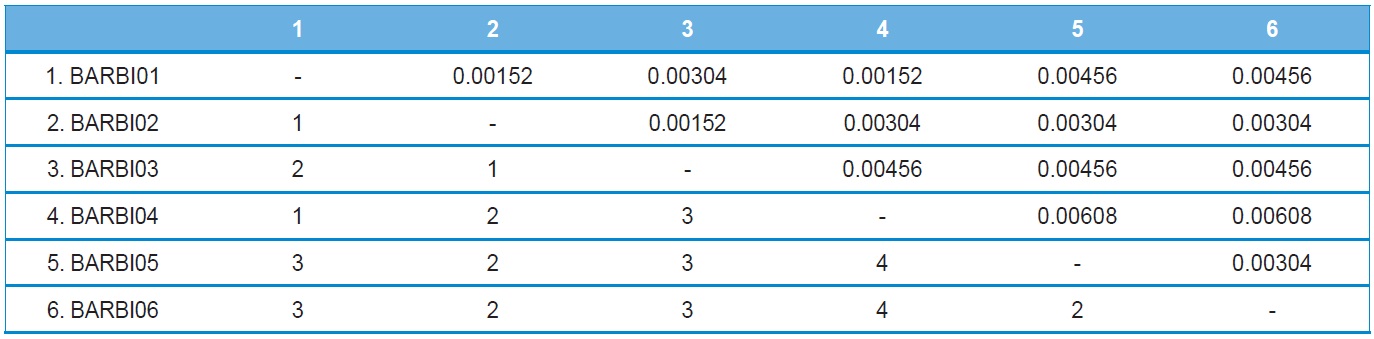
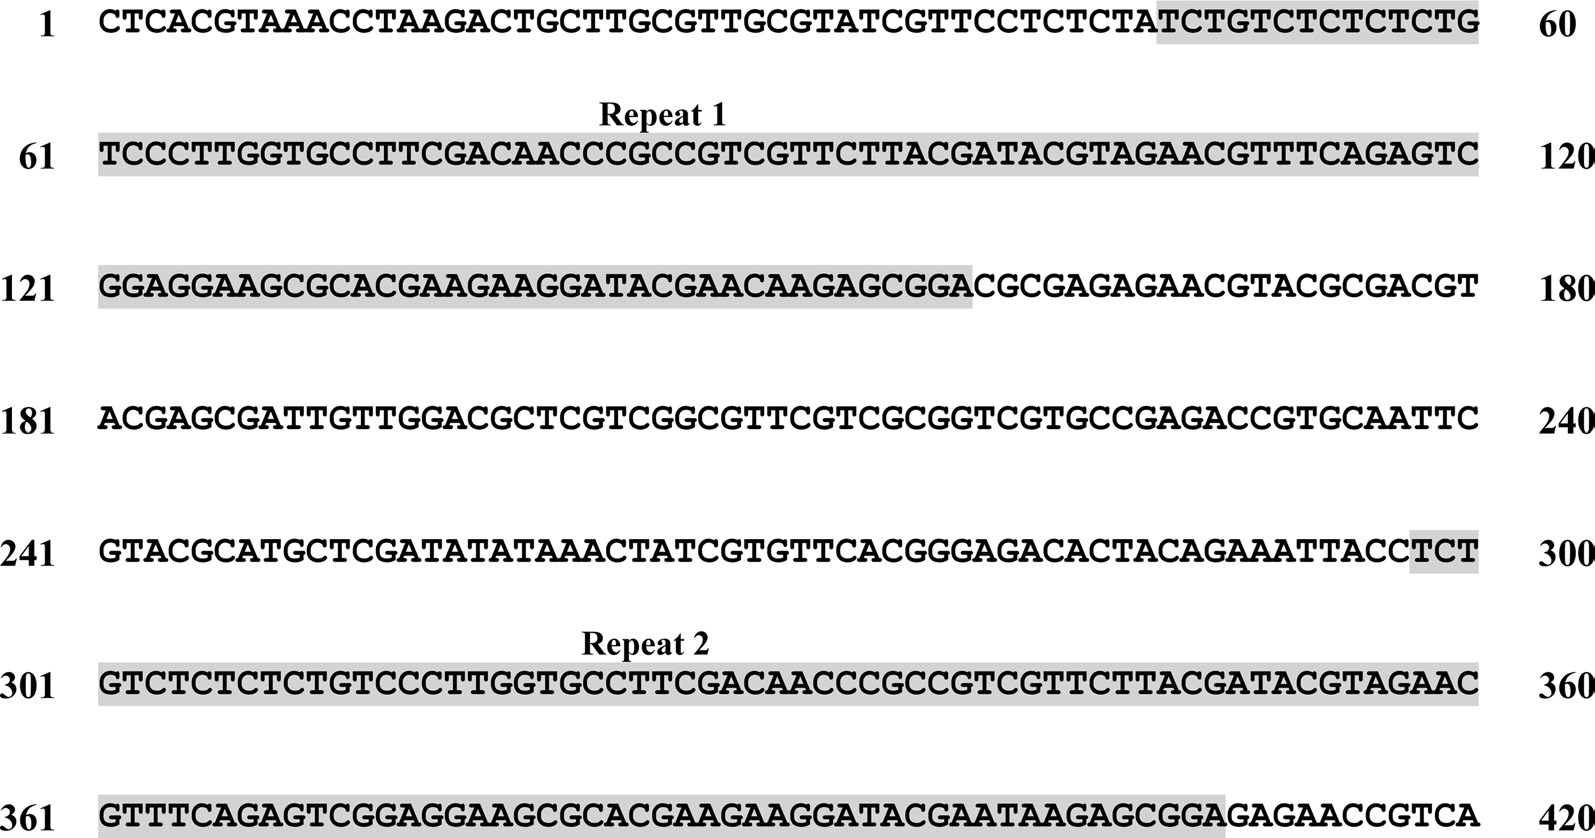
A total of six COI haplotypes (BARBI01 ~ BARBI06) and 84 ITS2 sequence types (ITSBI01 ~ ITSBI84) were obtained by sequencing 88 individuals of B. ignitus (Table 1). Although the COI gene contained no indels, presenting all identical 658 bp, ITS2 was variable in length, ranging from 2,034 to 2,052 bp. The length of B. ignitus ITS2 was the longest among known insects as far as available data are considered (Table 2). Such a long ITS2 sequence in B. ignitus derives, in part, from the presence of a total of 112-bp long, two repeat units, repeated at the beginning region within ~420 bp of B. ignitus ITS2 (Fig. 2). An uncorrected pairwise comparison between pairs of haplotypes demonstrated that the sequence divergence ranged from 0.15 to 0.61% (1 ~ 4 bp) among the six haplotypes (Table 3). From the ITS2 sequences a total of 84 sequence types, a sequence divergence ranging from 0.04% to 1.02% was obtained (one ~21 positions; data not shown). In contrast to the higher sequence type diversity of ITS2, the maximum sequence divergence among sequence types was only slightly higher compared to the COI gene (1.02% vs. 0.61%).
Among the six haplotypes, four were found in a single locality as a single individual (BIBAR03, BIBAR04, BIBAR05, and BIBAR06), but the haplotype BIBAR02 was found in four localities (localities 1, 2, 7, and 8) in a total of five individuals and BIBAR01 was found in seven localities in a total of 79 individuals, accounting for 89.8% of the samples (Table 1). Thus, the distribution of B. ignitus haplotypes can be summarized as a restricted local distribution in most haplotypes, with a wide distribution only in a limited number of haplotypes. On the other hand, no ITS2 sequence type was found in more than one
locality, except for the sequence type ITSBI01, which was found in five localities as a single individual at each locality (1, 2, 5, 7, and 8) (Table 1).
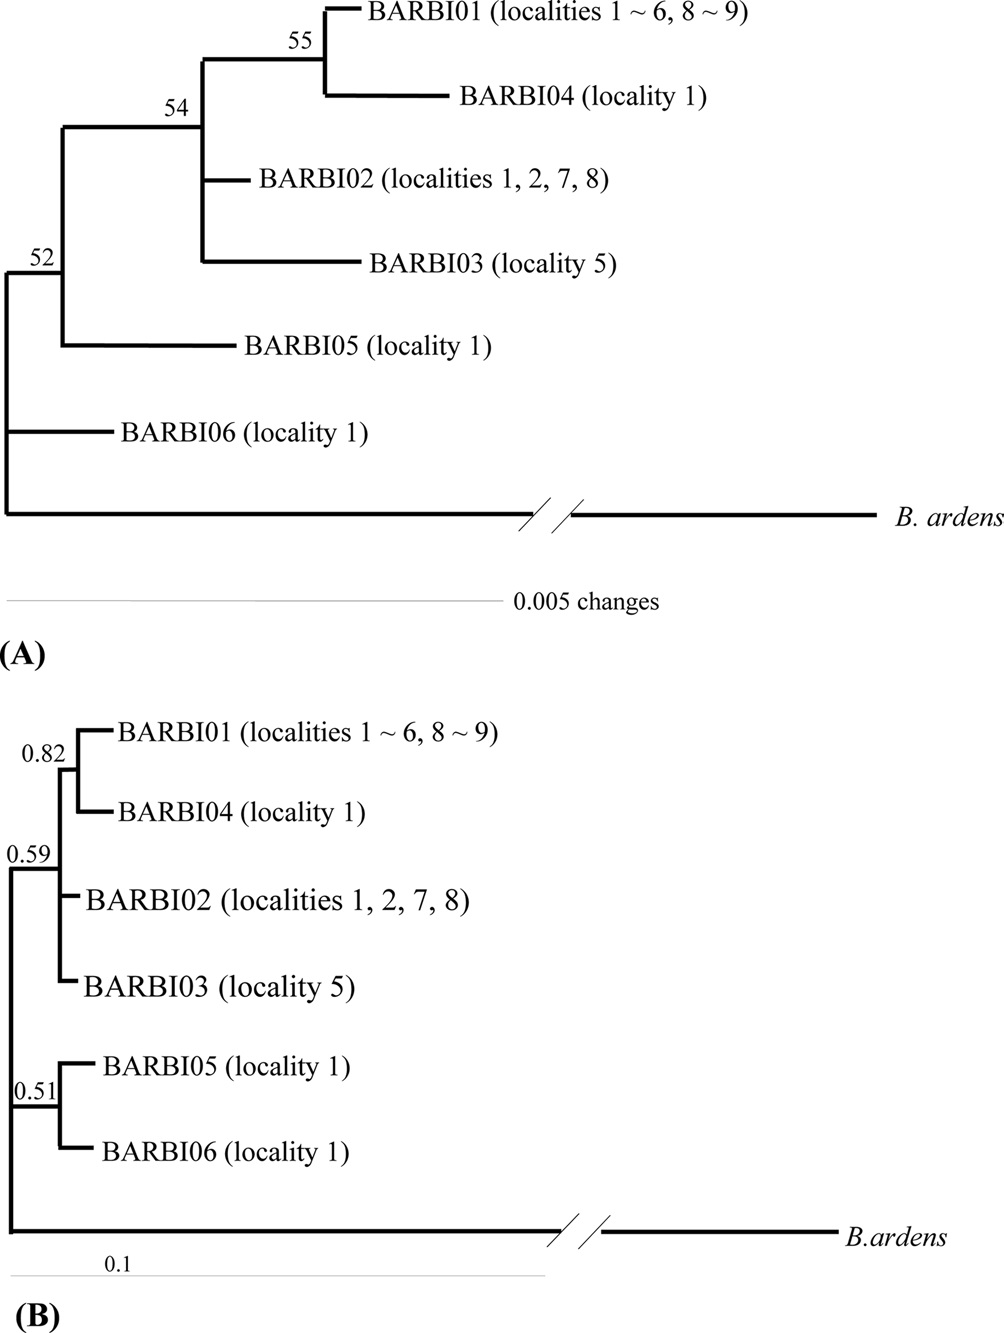
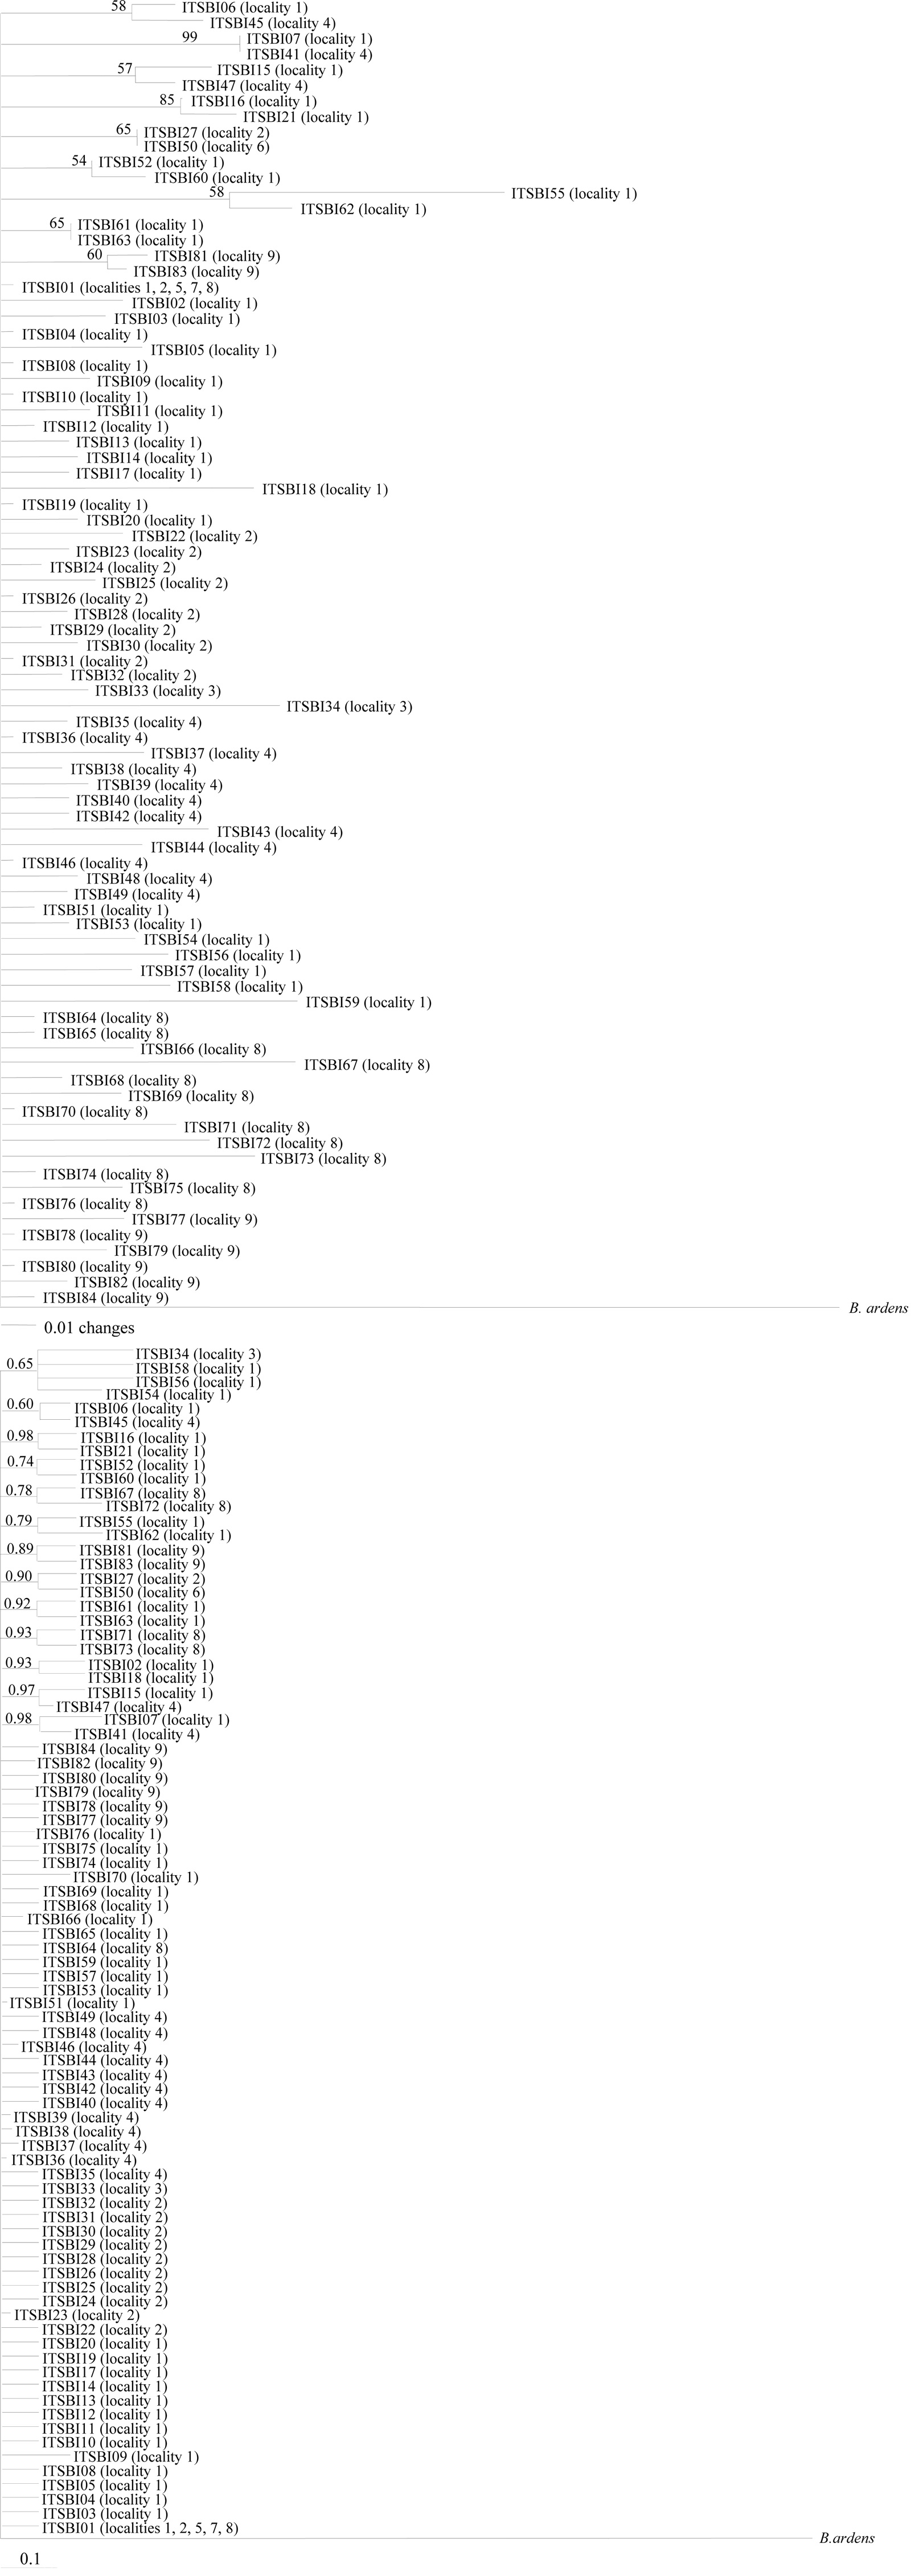
Phylogenetic analysis was conducted to determine the relationships among the six haplotypes of B. ignitus obtained in this study (Fig. 3). All haplotypes were weakly associated or unresolved, owing principally to low genetic divergence among them. One exception was the clustering between BIBAR01 and BIBAR04 in the BI analysis with slightly higher node support (BPP = 0.82), but this group was very weakly supported in the MP analysis as 55%.
Previously, Tokoro et al. (2010) sequenced 1,048-bp of the COI gene from B. ignitus collected from a Korean and Chinese locality and several Japanese localities. They obtained a total of 15 haplotypes, which consisted of six obtained from both Korea and China and nine from Japan and found that Japanese haplotypes were different from both South Korean and Chinese haplotypes using the MP and Neighbor-Joining method. In order to prepare a total dataset for phylogenetic analysis, the current six haplotypes obtained in this study were combined and aligned with those of Tokoro et al. (2010), resulting in 13 new haplotypes with 463 bp in length. These included five from this study (BIBAR01, BIBAR02 = BIBAR03, BIBAR04, BIBAR05, and BIBAR06) and eight from Tokoro et al. (2010) (F1 = F2 = F3, F4, F5 = F6, J1 = J2 = J3 = J5, J4, J6, J7 = J8, J9). Phylogenetic analysis by MP and BI methods demonstrated that the haplotypes found in South Korea and China formed one relatively inclusive group (0.92 by BI and 52% by MP), whereas those found in Japan did not form a monophyletic group (data not shown). This
was likely due to the short sequence length (463 bp) employed in this study.
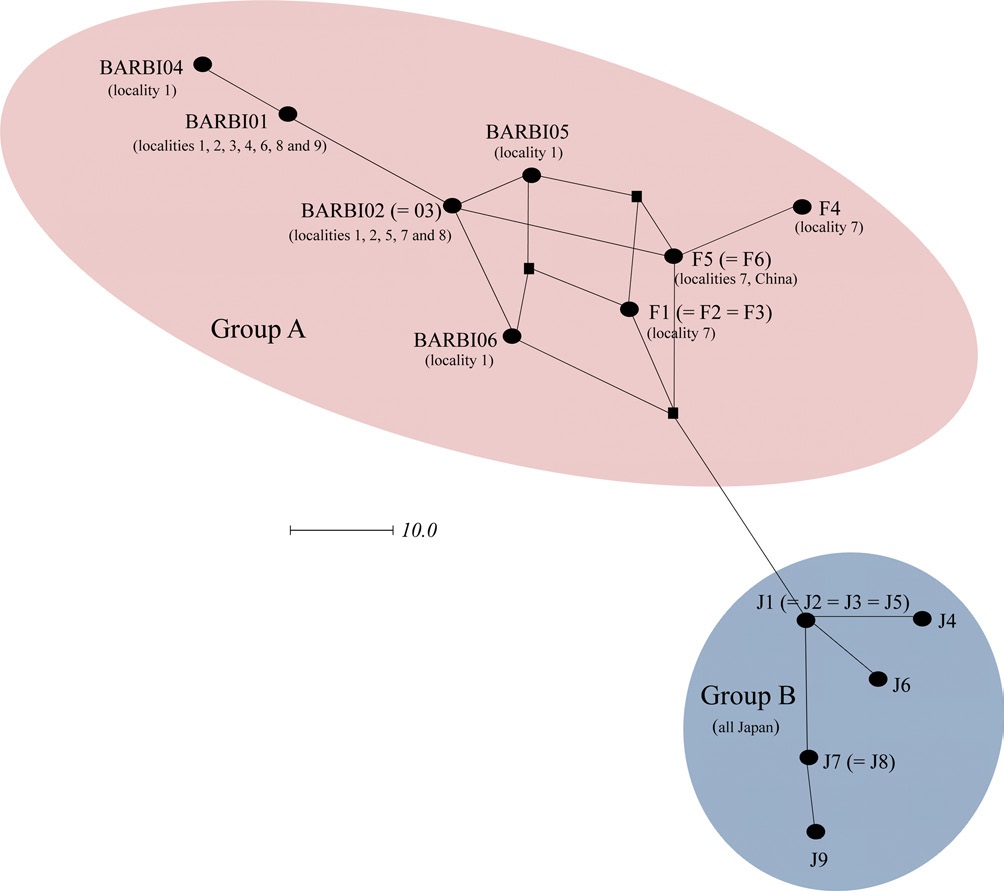
In order to further understand the relationships among B. ignitus haplotypes, the COI-based median-joining network was prepared using the haplotypes obtained in this study and those of Tokoro et al. (2010). Among the five haplotypes found in this study (BIBAR01, BIBAR02 = BIBAR03, BIBAR04, BIBAR05, and BIBAR06) the haplotypes BIBAR01 and BIBAR04 were somewhat distantly related to others, but these were grouped together with other haplotypes found in the South Korea and China with some complexity, due to the presence of more than one most parsimonious connection among haplotypes, forming one distinct group (termed group A) (Fig. 4). On the other hand, the haplotypes found solely in Japan (J1 = J2 = J3 = J5, J4, J6, J7 = J8, J9) formed a somewhat distant independent group (termed group B) that was derived from a single founder, J1 (Fig. 4).
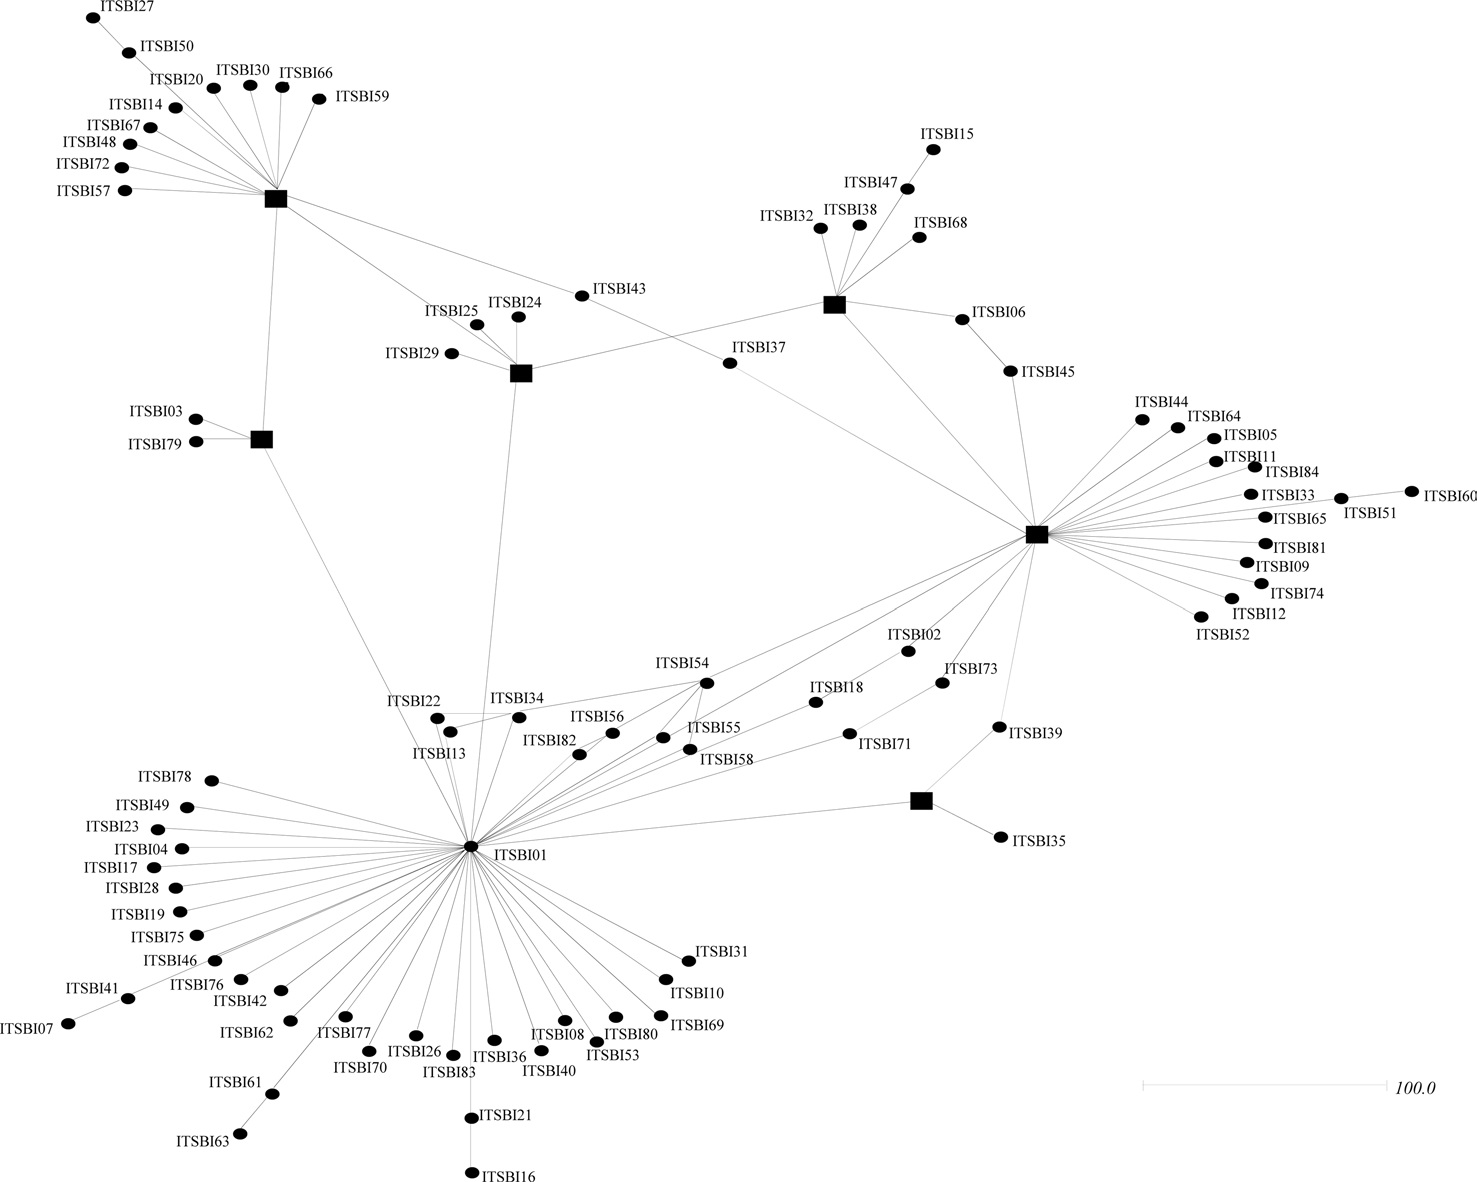
Phylogenetic analyses among the 88 ITS2 rDNA sequence types of B. ignitus have shown largely unresolved multibranches, but a few sequence types were grouped together, although the nodal support for the grouping was relatively low (Fig. 5). MP-based analysis has shown that the majority of the sequence types were weakly associated or unresolved, but two groups were exceptional, with bootstrap values of either 85% or 99% (Fig. 5A). Similarly, BI-based analysis also resulted in largely unresolved or weakly associated groups (Fig. 5B). In an attempt to further understand the relationships among B. ignitus sequence types, an ITS2-based median-joining network was prepared (Fig. 6). In contrast to the MP- and BI-based
phylogenies, the network resulted in a larger number of inclusive groups, providing several star phylogenies, wherein sequence types were composed of centered ones and their derived ones. In any star phylogeny, the derived sequence types were composed of several sequence types that were originated from a diverse locality. Thus, the clustering pattern of the sequence types derived from these localities may reflect non-locality-based clustering, indicating gene flow.
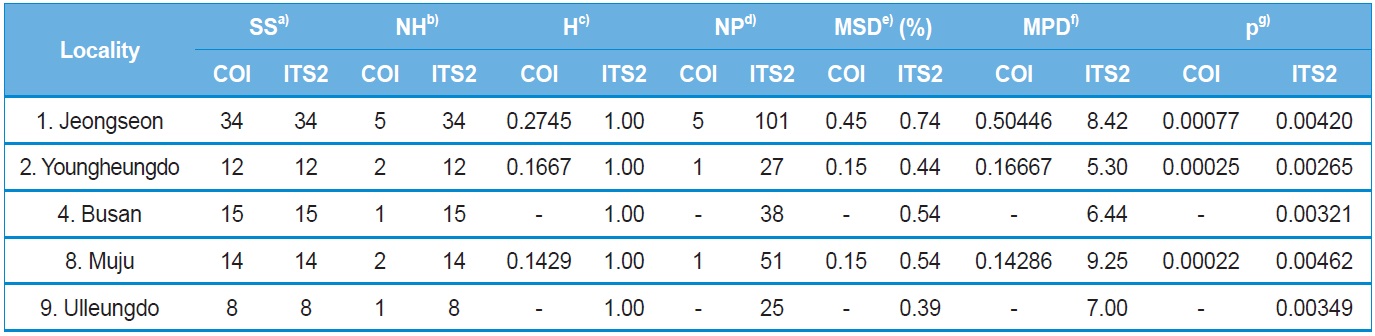
Within-locality diversity was estimated in terms of haplotype
diversity (H), maximum sequence divergence (MSD), mean number of pairwise differences (MPD), and nucleotide diversity (π) for both COI and ITS2 sequences from the localities with a sample size and haplotype number of ≥ two. Consequently, the three and five localities for the COI and ITS2 sequences, respectively, were subjected to analysis (Table 4). In the case of the COI gene, all three localities displayed substantially low estimates of π, ranging from 0.000767 (locality 1; Jeongseon) to 0.000217 (locality 8; Muju). Considering the maximum difference between the highest and lowest estimates only accounted for about 3.5-fold, no single particular locality could be attributed to a center for genetic diversity. Similarly, the ITS2 sequences also provided only 1.75-fold of the maximum difference between the highest and lowest estimates of π, ranging from 0.004615 (locality 8; Muju) to 0.002645 (locality 2; Youngheungdo). Thus, the ITS2 data also indicated that no single particular locality could be attributed to a center for genetic diversity either. On the other hand, the values of π in the ITS2 were about five to 20-fold higher than those of the COI gene sequence.
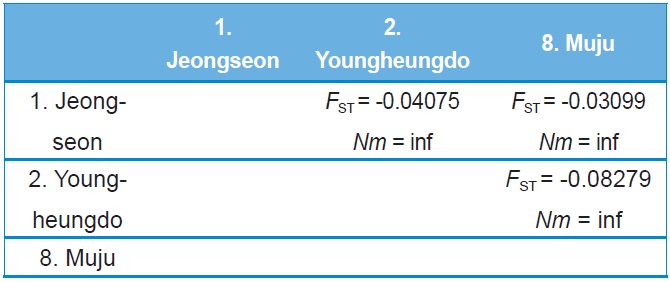
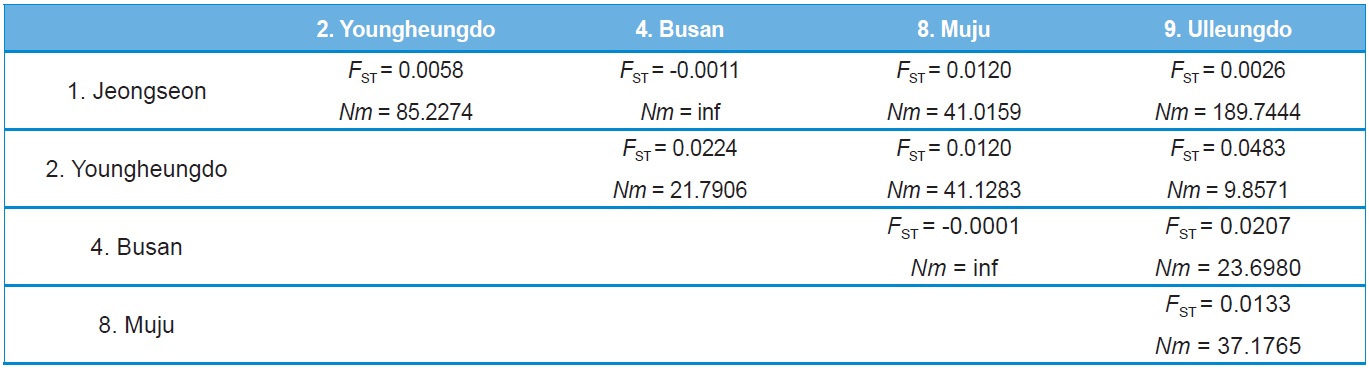
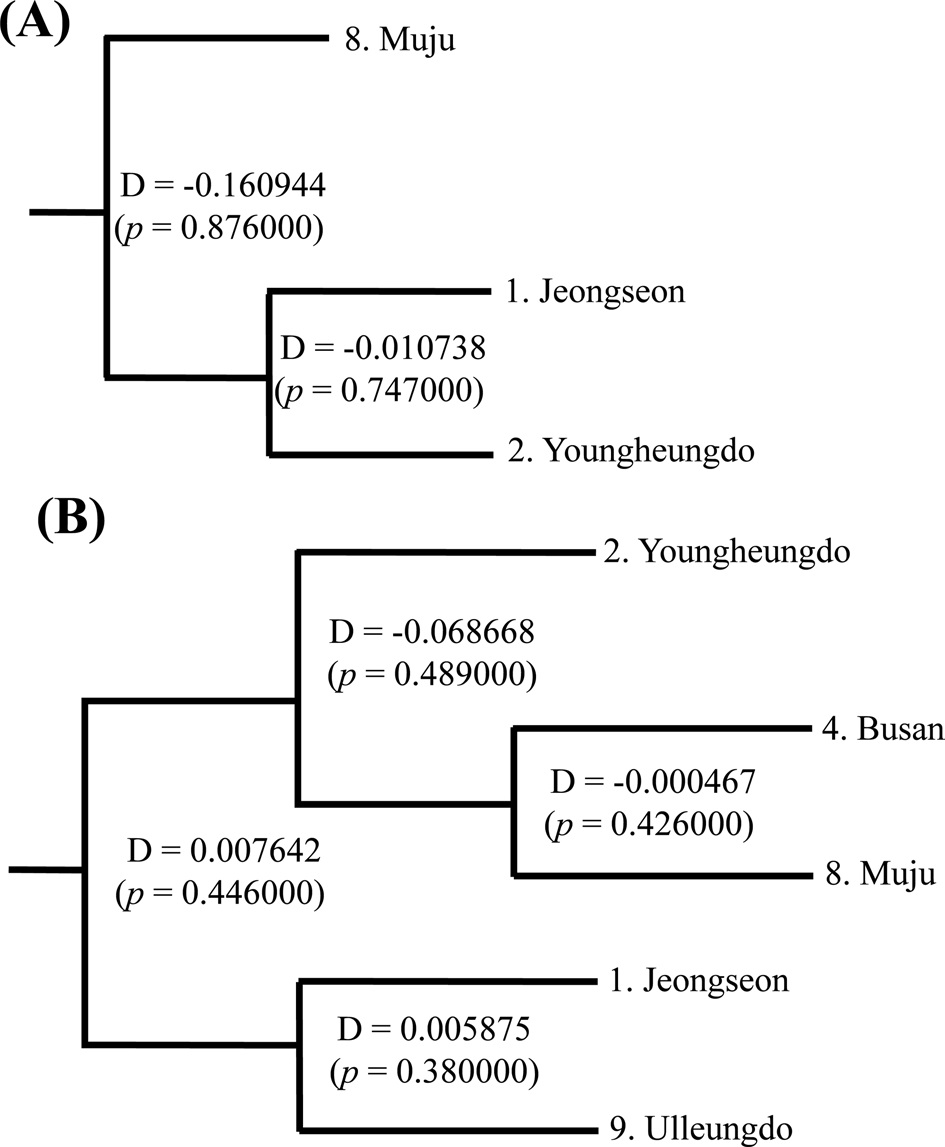
Both COI and ITS2-based genetic distance (FST) revealed
no statistically significant FST in any case (Online Resources 9 and 10). Consistent with the FST data, the estimate of pergeneration migration rates (Nm) showed an overall high gene flow between pairs of populations both in the COI and ITS2 sequences (Tables 5 and 6). To better understand the nature of the genetic relationships between the B. ignitus populations, the hierarchical relationships among localities were analyzed
(Fig. 7). The COI-based analysis demonstrated that there was a close relationship between Jeongseon (locality 1) and Youngheungdo (locality 2), although this relationship was not statistically significant (p > 0.05). In the case of the ITS2-based analysis, Busan and Muju (localities 4 and 8) formed into one group, and Jeongseon and Ulleungdo (localities 1 and 9) formed into another group, and the Busan + Muju group clustered together with the Youngheungdo (locality 2), forming (Youngheungdo + (Busan + Muju)). Nevertheless, separation into these groups was not statistically supported (p > 0.05). Thus, hierarchical analyses also indicated nongeographic distance-based population clustering.
Other available bee species present in South Korea have a COI sequence divergence of 0.3% for the within-generic bumblebee B. ardens (Kim et al., 2009) and 0.76% for the mason bee Osmia cornifrons (Kim et al., 2008), indicating that the sequence divergence was < 1%. Thus, the maximum sequence divergence of the COI gene found as 0.61% in B. ignitus was moderate when compared with other bee species occurring in South Korea.
To the best of our knowledge, the B. ignitus ITS2 sequence is the longest ever reported in insects, which ranged between 2,034 ~ 2,052 bp. Previously, two within-familial species, Melipona, were reported to harbor a ITS2 with lengths of 1,728 bp and 1,789 bp, respectively (De La Rua et al., 2007) and the length of the within-generic species, B. ardens ITS2 sequence was reported to be 1,971 ~ 1,984 bp (Oh et al., 2009), but our B. ignitus was at least 50 bp longer than those of the B. ardens ITS2 sequences. Except for the Apidae family, the length of the ITS2 in other hymenopteran and other ordinal groups were far less than 1,000 bp in most cases (Table 2). Similarly to B. ignitus, the B. ardens ITS2 sequences was 114-bp in length and contained four repeat units, repeated twice at the beginning region within ~430 bp of ITS2, but no such repeat sequence was detected in the ITS2 regions of any other insect, including two within-familial Melipona species (De La Rua et al., 2007). Thus, this repeat sequence of the Bombus ITS2 seems to be a molecular synapomorphic characteristic for the genus, although more Bombus species should be analyzed.
The sequence type diversity of ITS2 was also noteworthy in that nearly all individuals accounted for a different sequence type (Table 1). One of the possible reasons for such high diversity in sequence type is a higher evolutionary ratio of ITS2 since this ITS2 may have been relatively free of structural and functional constrains (Tang et al., 1996).
Previously, Shao et al. (2004) sequenced 450 bp of mitochondrial cytochrome b gene from 16 individuals collected from three localities in China, South Korea, and Japan, and no sequence variation was observed among them. However, further variable microsatellite analysis from 124 individuals showed statistically significant genetic differentiation of the Chinese and South Korean populations from the Japanese populations, which was possibly due to the geographical isolation of Japan (Shao et al., 2004). Tokoro et al. (2010) also found that the genetics of Japanese populations were differentiated from South Korean and Chinese populations when a 1,048 bp of the COI gene was sequenced. Our median-joining network using the data from Tokoro et al. (2010) and the current study also suggested that there was a genetic differentiation between mainland populations and Japan (Fig. 7). Collectively, this data indicate that the B. ignitus in South Korea and China are genetically a large group, but those in Japan is roughly separable into another group. This result reinforces the finding of Tokoro et al. (2010), even though limited sequence information was utilized. It is likely that the geographic connection between the Korean peninsula and mainland China facilitated gene glow, but the geographically isolated Japanese populations may have had little or no chance for gene flow during continental separation at about 110,000 ~ 280,000 (Kawamura, 2006).
Our FST and Nm analyses on the basis of both COI and ITS2 indicate that B. ignitus populations occurring in South Korea were not genetically differentiated from each other (Tables 5 and 6). Furthermore, the hierarchical relationship data based on both the COI and ITS2 indicate that all B. ignitus populations in South Korea were genetically interrelated (Fig. 7). Consistent with the population genetic perspective, the phylogenetic analyses (Figs. 3 and 5) and the median-joining networks (Figs. 4 and 6) among South Korean populations also indicated the importance of gene flow in the B. ignitus.
Although no precise report on the dispersal distance of B. ignitus is available it has been known that the within-generic species, B. terrestris, B. lucorum, and B. lapidaries are capable of dispersal for several thousand kilometers (Mikkola, 1978). Furthermore, it has been theorized that a small number of migrants may be sufficient to prevent drift for genetically homogeneous populations (Hartl and Clark, 1989). Considering these findings, the B. ignitus populations in South Korea seem to be a single panmictic population, regardless of geographic distance.
Summarized, we collected a total of 88 individuals of B. ignitus from nine South Korean localities and sequenced 658 bp of the mitochondrial COI gene and 2,034 ~ 2,052-bp long complete ITS2 rDNA. The sequence analysis of B. ignitus COI provided a moderate to low magnitude of sequence divergence, whereas that of ITS2 indicated higher variability, presenting a total of 84 sequence types. In particular, the lengths of ITS2 were the longest among known insects. Considering the FST and Nm estimates, along with phylogenetic analyses, it appears that the geographic populations of B. ignitus have a high ratio of gene flow, which indicates the potential/actual dispersal ability of the species without long-term zoogeographic barriers. This was likely due to high dispersal ability.